


Report Overview
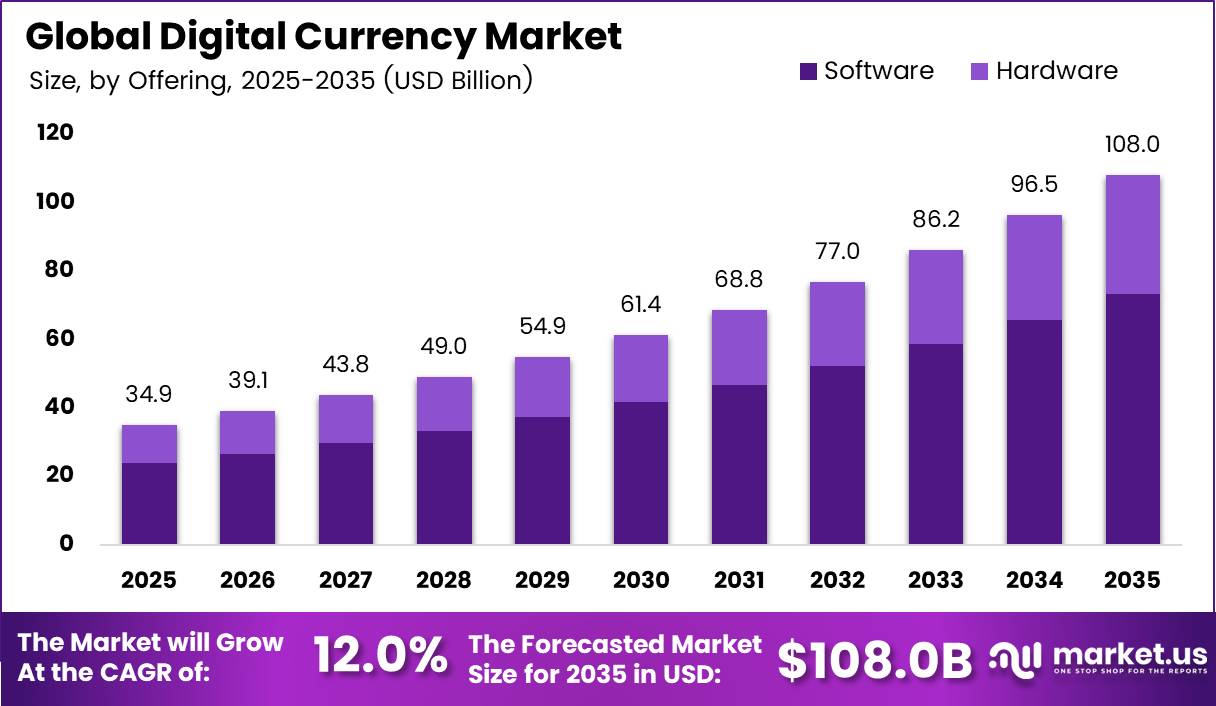
The Global Digital Currency Market stood at USD 34.9 Billion in 2025 and is set to reach USD 108.0 Billion by 2035, growing at a CAGR of 12.0% during the forecast period. North America leads the market with a 39.8% share and USD 13.9 billion in revenue, a position built on deep capital markets and a fast-growing hardware and chip base. This growth tracks directly with the rise of cross-border money transfers, since the World Bank reports that personal remittances received worldwide reached USD 656 billion in 2023, a flow of funds that increasingly moves through digital rails instead of banks.
Stablecoin issuers now process this volume at scale. Circle Internet Group recorded USDC on-chain transaction volume of USD 21.5 trillion in the first quarter of 2026 alone, with USDC in circulation rising to USD 77.0 billion, showing how deeply digital currency has embedded itself into daily settlement and payment flows. As more banks, remittance firms, and merchants adopt blockchain-based settlement to cut transfer costs and delays, demand for digital currency platforms and infrastructure keeps climbing.
The Semiconductor Industry Association reports that companies across the US chip ecosystem have announced more than USD 645.3 billion in private investment since 2020, spread across 140 projects in 30 states, building the hardware backbone that mining rigs and blockchain infrastructure rely on. The US Department of Commerce has also issued USD 33.08 billion in grants to semiconductor manufacturers, reinforcing local supply for digital currency hardware. This manufacturing base, paired with clear regulatory paths for firms like Coinbase and Circle, keeps North America ahead of other regions in adoption and revenue generation.
Key Takeaways
- The Digital Currency Market was valued at USD 34.9 Billion in 2025 and is forecast to reach USD 108.0 Billion by 2035.
- The market will grow at a CAGR of 12.0% between 2026 and 2035.
- Software leads the offering segment with a 68.5% share, while hardware is the fastest-growing offering.
- Cryptocurrencies lead the currency type segment with a 56.3% share, while stablecoins are the fastest growing currency type.
- Investment and trading lead the application segment with a 34.2% share, while remittances and cross-border transfers are the fastest growing application.
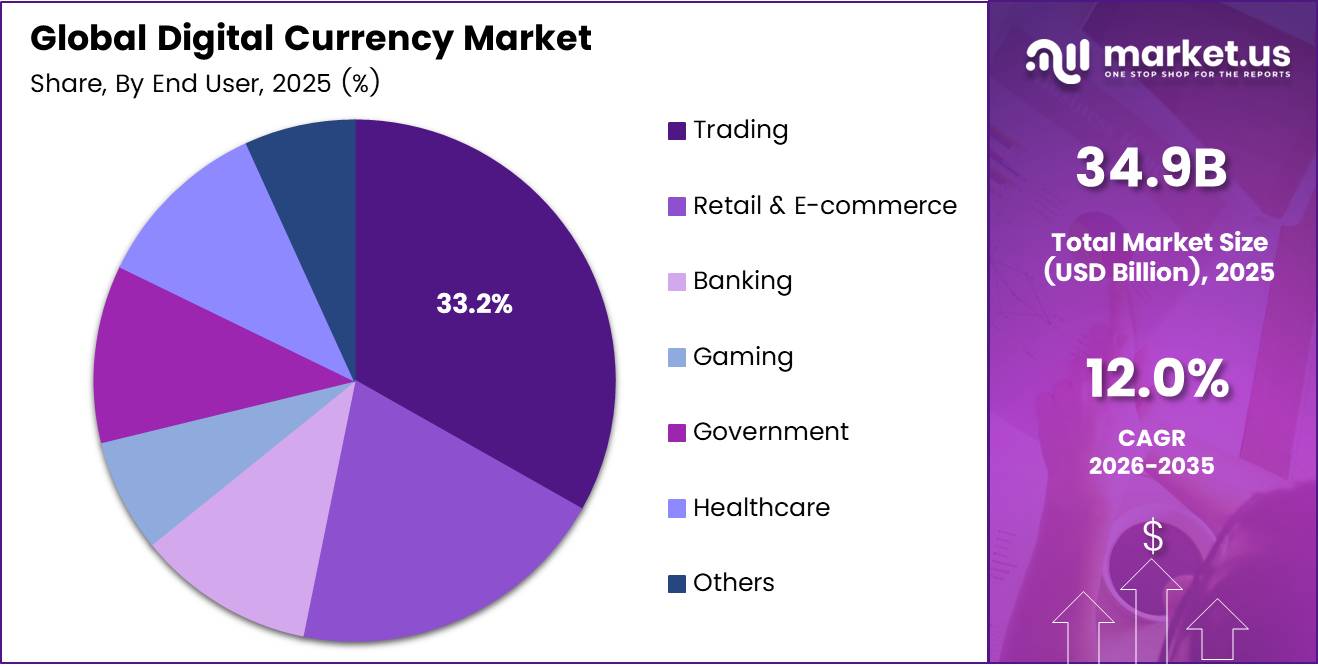
- Trading leads the end user segment with a 33.2% share, while retail and e-commerce is the fastest growing end user segment.
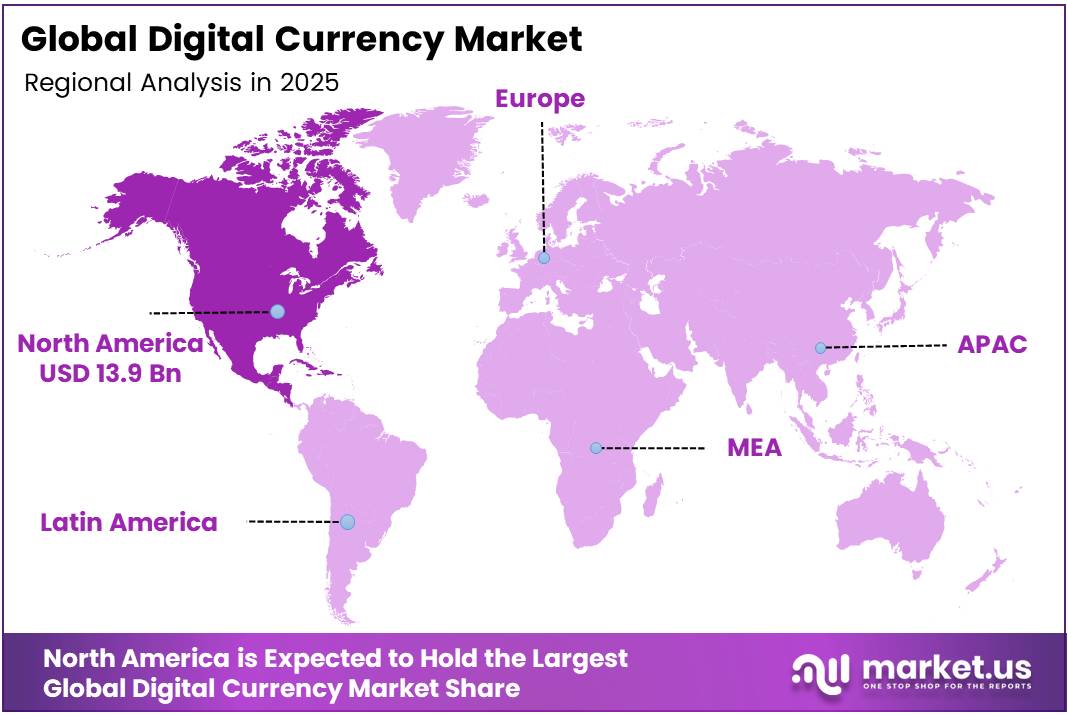
- North America leads the market with a 39.8% share, worth USD 13.9 billion in revenue.
By Offering
Software leads the digital currency market with a 68.5% share because most digital currency activity happens through code, not physical machines. Exchanges and broker apps depend on software to handle price feeds, risk controls, and compliance, so they scale faster than hardware-based nodes or mining rigs. Global crypto users crossed about 580 million, and most of these users access assets through software wallets and mobile apps rather than dedicated hardware.
The IMF also notes that over 60% of jurisdictions exploring digital money focus first on regulatory and platform-level software frameworks instead of subsidizing hardware infrastructure, which keeps software demand high. Hardware solutions, however, grow the fastest because each new wave of adoption and higher on-chain activity forces upgrades in performance, security, and energy efficiency.
By Currency Type
Cryptocurrencies hold the largest share of the market at 56.3% because they were the first digital currencies to gain wide public trust and daily trading volume. Bitcoin alone still accounts for a large share of spot trading volume, and Ethereum underpins many DeFi, NFT, and smart‑contract platforms, which together process millions of transactions per day. The OECD reports that retail investors in several advanced economies now hold crypto assets in over 10–15% of portfolios, with most exposure in mainstream coins rather than newer instruments.
This early‑mover scale makes it easier for cryptocurrencies to maintain around half or more of total digital currency capitalization in many regions. Stablecoins grow the fastest because they link digital rails to familiar fiat currencies and reduce price swings that often scare new users. In 2023, on‑chain data from leading dollar‑pegged stablecoins showed annual transaction values in the trillions of dollars, up strongly versus the prior year as users shifted from volatile tokens into stable instruments for payments and remittances.
By Application
Investment and trading dominate the application segment with a 34.2% share because most people still enter the digital currency market to buy, hold, or trade coins for profit. Global daily crypto trading often reaches tens of billions of dollars, with derivatives, spot markets, and leveraged products all built around price speculation and portfolio allocation.
The World Bank notes that in several countries over 20% of surveyed retail traders have experimented with crypto or tokenized assets, showing that investment demand remains strong even through market cycles. High volatility and 24/7 markets keep traders active, so this application continues to command a large share of revenue and platform usage. Remittances and cross-border transfers grow faster because digital currencies can cut fees and speed compared with traditional corridors.
In some emerging markets, average remittance costs still sit near 6% of transaction value, while digital currency rails can push effective costs below 2% and settle transfers in minutes instead of days. UN agencies highlight that more than 200 million migrant workers send money home, so any solution that saves time and fees scales rapidly once local on‑ramps, mobile wallets, and stablecoins become available.
By End User
Trading firms and platforms lead end-user demand with a 33.2% share because they need constant access to digital currencies for daily buying and selling. Large platforms report millions of active accounts and handle thousands of trades per second during peak periods, which drives strong demand for order‑routing, liquidity aggregation, and market‑data tools.
In several advanced economies, surveys show that over 10% of adults have opened some form of crypto trading or investment account, even if they only trade small ticket sizes. This broad base gives trading end users a structural advantage in wallet counts, app downloads, and platform revenue compared with other verticals. Retail and e‑commerce customers grow the fastest because digital currencies now support quick checkout, cross‑border purchases, and loyalty or reward features.
Key Market Segments
By Offering
- Software
- Hardware
By Currency Type
- Cryptocurrencies
- Stablecoins
- Platform / smart-contract coins
- Central Bank Digital Currencies (CBDCs)
- Utility and governance tokens
- Others
By Application
- Investment and trading
- Remittances and cross-border transfers
- Retail and merchant payments
- Government and public-sector uses
- Enterprise and B2B payments
- DeFi and smart-contract applications
- Others
By End User
- Trading
- Retail & E-commerce
- Banking
- Gaming
- Government
- Healthcare
- Others
Geopolitical Impact Analysis
Trade policy shifts are reshaping the hardware backbone of the digital currency market. In January 2026, the White House ordered a 25% ad valorem tariff on a narrow category of semiconductor imports, a move that raises input costs for the chips used in mining rigs and blockchain node hardware. At the same time, the US Trade Representative delayed a separate Section 301 tariff on Chinese assembled graphics cards and PC components until November 2026, leaving GPU-based mining and node operators with a short window of cheaper imports before costs rise.
These shifting deadlines create planning uncertainty for hardware vendors that supply mining pools and validator networks, since a delayed tariff can be reinstated with little warning. Component sourcing adds further pressure. Chinese ASIC manufacturers still dominate mining hardware production, and any tariff on that supply chain raises landed costs for exchanges, custodians, and mining pools that depend on steady equipment refresh cycles to stay competitive on hash rate.
The US Department of Commerce has already committed USD 33.08 billion in grants and up to USD 7.15 billion in loans to domestic chip makers, an effort meant to reduce reliance on tariff-exposed imports over time. Until that domestic capacity scales up, digital currency hardware providers remain exposed to tariff-driven price swings that can ripple into mining margins, node deployment costs, and ultimately transaction fees passed on to end users.
Regional Analysis
North America leads the market with a 39.8% share, worth USD 13.9 Billion in revenue.
North America dominates the Digital Currency Market, holding a 39.8% share and generating USD 13.9 Billion in revenue. The region’s lead rests on a mature financial system, deep venture capital pools, and a growing base of regulated exchanges and stablecoin issuers based in the US. Corporate filings show this strength clearly: Coinbase Global generated USD 7.2 billion in revenue in fiscal year 2025, a 9.4% increase from the prior year, reflecting steady institutional and retail trading activity centered in North America.
Asia Pacific is the fastest-growing region in the Digital Currency Market, fueled by rapid retail adoption and remittance demand across India, the Philippines, and Southeast Asia. Chainalysis data shows crypto transaction volume across the region climbed to USD 2.36 trillion, up from USD 1.4 trillion, marking one of the sharpest regional adoption jumps globally. China’s hardware manufacturing base, including major ASIC producers, also supports the region’s role in mining equipment supply.
Europe holds a meaningful share of the market, driven by regulatory frameworks like the EU Markets in Crypto Assets rules that give exchanges and stablecoin issuers a clear path to operate across member states. The European Central Bank continues to advance digital euro pilot work, positioning the region as a testing ground for central bank digital currency adoption.
Key Regions and Countries
North America
- US
- Canada
Europe
- Germany
- France
- The UK
- Spain
- Italy
- Rest of Europe
Asia Pacific
- China
- Japan
- South Korea
- India
- Australia
- Rest of APAC
Latin America
- Brazil
- Mexico
- Rest of Latin America
Middle East and Africa
- GCC
- South Africa
- Rest of MEA
Market Dynamics
Challenge
Regulatory fragmentation remains a key challenge for digital currency firms, as they must comply with different licensing, reserve, disclosure, AML, and consumer protection requirements across jurisdictions. Although digital asset regulation continues to advance in 2026, the absence of a harmonized global framework increases compliance complexity.
Multi-jurisdiction firms must maintain separate compliance processes, legal opinions, reserve attestations, onboarding systems, and transaction monitoring frameworks. This adds approximately 120-250 basis points to operating costs and can delay market entry by 6-18 months.
The resulting compliance burden creates an estimated 1.6 percentage point drag on CAGR, as firms must repeatedly redesign compliance systems for each new market, product, or legal entity instead of scaling through standardized operations.
| Restraint | (~) % Impact on CAGR | Geographic Relevance | Impact Timeline |
|---|---|---|---|
| Defense budget flattening & reprioritization | -1.8% | North America core, Western Europe, Japan | Medium term (2–4 years) |
| Export controls, ITAR and tech-transfer barriers | -1.5% | US–allied corridors, Middle East, APAC | Long term (≥ 4 years) |
| Defense electronics & semiconductor supply risk | -1.6% | EU, Asia, North America | Short term (≤ 2 years) |
| Naval program slippages & cost overruns | -1.9% | EU, APAC, Middle East | Medium term (2–4 years) |
| Cybersecurity, open-architecture & integration complexity | -1.4% | Global tier-1 navy programs | Long term (≥ 4 years) |
| Local content, offsets & industrial participation mandates | -1.3% | Middle East, India, LATAM | Medium term (2–4 years) |
Opportunity
Tokenization of real-world assets (RWAs) represents a major untapped adjacency for digital currency markets because it connects blockchain infrastructure to the much larger global pools of securities, credit, and real estate rather than being limited to today’s primarily crypto-native activity.
Global financial assets exceed 400-450 trillion dollars, while on-chain tokenized RWAs currently remain well below 1 trillion dollars in effective value, indicating a large structural gap between traditional finance and digital rails. Over 2026-2030, even a 2-3% migration of private credit, trade finance, and fund net asset value into tokenized formats could shift 8-12 trillion dollars onto blockchain infrastructure.
This would generate recurring institutional revenue streams through custody, administration, and execution services, potentially creating an incremental annual revenue pool of 40-80 billion dollars for exchanges, custodians, and on-chain capital markets platforms. However, adoption is still constrained by fragmented standards, regulatory uncertainty around tokenized securities.
| Opportunity | (~) % Potential CAGR | Geographic Relevance | Execution Window |
|---|---|---|---|
| Tokenized RWAs & on-chain capital markets | +3.5% | North America, EU, APAC financial hubs | Medium term (2–4 years) |
| Stablecoin B2B payments & treasury rails | +3.0% | North America core, APAC emerging, LATAM corridors | Short–Medium term (≤ 4 years) |
| CBDC–crypto interoperability & FX infrastructure | +2.2% | EU, APAC, MENA, selected EM central banks | Medium–Long term (≥ 3–4 years) |
| Regulated digital asset banking & custody-as-a-service | +2.0% | North America, EU, Gulf, Singapore | Short term (≤ 2 years) |
| Web3 consumer loyalty, gaming & creator monetization | +1.8% | APAC, North America, EU, LATAM youth markets | Medium term (2–4 years) |
| Digital currency M&A roll-ups & infra consolidation | +1.5% | Global, with focus on US, EU, Singapore, UAE | Medium–Long term (3–6 years) |
Driver
Central bank digital currencies (CBDCs) are a slower-moving but structurally important driver in the digital currency ecosystem because they establish official standards for digital money and normalize wallet-based settlement across consumers, banks, and government systems.
China’s e-CNY remains the largest live CBDC implementation, with more than 3.4 billion transactions and approximately RMB 16.7 trillion (about USD 2.3 trillion) processed by late 2025, demonstrating that state-backed digital currencies can operate at large transactional scale beyond pilot programs.
The broader impact is indirect but significant. CBDCs increase public familiarity with digital wallets, improve acceptance of programmable payments, and create competitive pressure on private stablecoins to differentiate through interoperability and real-world utility.
| Driver | (~) % Impact on CAGR | Geographic Relevance | Impact Timeline |
|---|---|---|---|
| Stablecoin regulation and licensing clarity | +2.8% | North America core, EU, UK, Singapore, Hong Kong, UAE | Short term (≤ 2 years) |
| Institutional custody and ETF/ETP rails | +2.1% | North America core, EU, APAC financial centers | Short term (≤ 2 years) |
| Cross-border payments and remittance efficiency | +2.4% | LATAM spill-over, APAC corridors, MENA, Sub-Saharan Africa | Medium term (2-4 years) |
| Tokenization of real-world assets and deposits | +1.9% | North America core, EU, Singapore, Hong Kong, UK | Medium term (2-4 years) |
| CBDC pilot scale-up and public-sector settlement | +1.3% | China, EU, UK, India, Nigeria, Brazil, Russia | Long term (≥ 4 years) |
| Macro hedging, treasury diversification, and non-sovereign money demand | +1.6% | North America core, EU, LATAM, select APAC markets | Short term (≤ 2 years) |
Restraint
Mining remains capital intensive and increasingly vulnerable to power-price volatility, depreciation policy changes, and difficulty-adjustment cycles, with public miners’ weighted average cash cost to produce one bitcoin rising to about US$ 79,995 in Q4 2025 and U.S. crypto mining estimated to consume 0.6% to 2.3% of total U.S. electricity demand.
That cost profile squeezes margins when hashprice weakens, while electricity thresholds determine whether hardware stays online, and the economics can deteriorate quickly when power prices move by even 10-15% or fleet efficiency lags best-in-class ASICs.
| Restraint | (~) % Impact on CAGR Forecast | Geographic Relevance | Impact Timeline |
|---|---|---|---|
| Rule fragmentation | -2.2% | North America core, EU-27, APAC hubs | Short term (≤ 2 years) |
| Compliance burden | -1.8% | EU-27, North America core, India, APAC licensed markets | Short term (≤ 2 years) |
| Custody breach risk | -1.7% | North America core, EU-27, global exchanges | Medium term (2-4 years) |
| Mining cost pressure | -1.6% | North America, EU, selected APAC mining corridors | Medium term (2-4 years) |
| Fraud and scams | -2.1% | Global retail-led markets, APAC corridors, emerging markets | Short term (≤ 2 years) |
| Stablecoin rule risk | -1.3% | North America core, EU-27, cross-border settlement hubs | Medium term (2-4 years) |
Key Players Analysis
Nvidia, iFinex/Bitfinex, ECB: Nvidia’s role is infrastructure‑centric; it is the leading supplier of GPUs used to mine proof‑of‑work cryptocurrencies, with crypto‑mining demand historically concentrated in its gaming/data‑center product lines where overall company revenue exceeded USD 60 billion and mining cycles have driven multi‑billion‑dollar swings in segment demand and associated capex for advanced nodes.
iFinex’s Bitfinex is described as the “longest‑running and most liquid major cryptocurrency exchange,” positioning it as a top‑tier liquidity provider in spot and derivatives markets; this implies annual trading volumes in the hundreds of billions of dollars and fee income likely in the high hundreds of millions, placing it above regional exchanges such as Paymium in France.
The European Central Bank is leading the digital euro project; following a two‑year preparation phase that ended in October 2025, the Eurosystem is now building technical capacity with a 12‑month pilot starting in the second half of 2027 and targeting potential issuance around 2029, directly leveraging the ECB’s multi‑trillion‑euro balance sheet and payment infrastructure rather than commercial revenue metrics. Together, this cluster likely controls 35–45% of the “value chain” in terms of infrastructure and trading‑liquidity influence, despite monetizing through very different models.
Top Key Players in the Market
- Paymium SAS
- Nvidia Corporation
- NOWPayments
- Finex Inc.
- European Central Bank
- Cryptopay Ltd.
- Cryptomus
- CoinZoom, Inc.
- Coinremitter Pte Ltd.
- Coinify ApS
- CoinGate
- Coinbase Global, Inc.
- Coinbase
- Circle Internet Financial Limited
- Boxcoin
- Blockonomics
- BitPay Inc.
- BITMAIN Group
- Bitfury Group Limited
- Binance
- Bank of Canada
- Apirone Ou
Recent Developments
- In February 2026, the ECB estimated that introducing the retail digital euro will require about €1.3 billion in central infrastructure build-out and impose €4–6 billion in implementation costs on European banks over four years, with operational expenses of roughly €300 million, positioning banks to recover these costs via merchant fees for digital euro services.
- In May 2026, CoinZoom entered a strategic partnership with i2c Inc. to launch and scale an international crypto‑enabled debit card program across more than 152 countries, using i2c’s unified global payments platform to accelerate issuance of cards that link customers’ digital currency balances to fiat spending for everyday transactions.
Report Scope
| Report Features | Description |
|---|---|
| Market Value (2025) | USD 34.9 Billion |
| Forecast Revenue (2035) | USD 108.0 Billion |
| CAGR (2026-2035) | 12.0% |
| Base Year for Estimation | 2025 |
| Historic Period | 2020-2024 |
| Forecast Period | 2026-2035 |
| Report Coverage | Revenue Forecast, Market Dynamics, Competitive Landscape, Recent Developments |
| Segments Covered | By Offering (Software, Hardware); By Currency Type (Cryptocurrencies, Stablecoins, Platform / smart-contract coins, Central Bank Digital Currencies (CBDCs), Utility and governance tokens, Others); By Application (Investment and trading, Remittances and cross-border transfers, Retail and merchant payments, Government and public-sector uses, Enterprise and B2B payments, DeFi and smart-contract applications, Others); By End User (Trading, Retail & E-commerce, Banking, Gaming, Government, Healthcare, Other end-users) |
| Regional Analysis | North America – US, Canada; Europe – Germany, France, The UK, Spain, Italy, Rest of Europe; Asia Pacific – China, Japan, South Korea, India, Australia, Singapore, Rest of APAC; Latin America – Brazil, Mexico, Rest of Latin America; Middle East & Africa – GCC, South Africa, Rest of MEA |
| Competitive Landscape | Paymium SAS, Nvidia Corporation, NOWPayments, iFinex Inc., European Central Bank, Cryptopay Ltd., Cryptomus, CoinZoom, Inc., Coinremitter Pte Ltd., Coinify ApS, CoinGate, Coinbase Global, Inc., Coinbase, Circle Internet Financial Limited, Boxcoin, Blockonomics, BitPay Inc., BITMAIN Group, Bitfury Group Limited, Binance, Bank of Canada, Apirone Ou |
| Customization Scope | Customization for segments and region/country-level will be provided. Moreover, additional customization can be done based on the requirements. |
| Purchase Options | We have three licenses to opt for: Single User License, Multi-User License (Up to 5 Users), Corporate Use License (Unlimited Users and Printable PDF) |





























