
Quick Navigation
- Introduction
- Editor’s Choice
- Count of Active Cryptocurrency Exchanges
- Top Crypto Performance Trends
- General Cryptocurrency Statistics
- Crypto Investor Statistics
- Cryptocurrency Ownership
- Crypto Cyberattacks
- Cryptocurrency Trading Statistics
- Cryptocurrency Mining Statistics
- Growth Trend in Cryptocurrency Users
- Where Crypto Adoption Is Growing the Fastest?
- Cryptocurrency Fraud Statistics
- Reasons Why People Choose to Invest in Cryptocurrency
- Crypto Concerns in 2025
- The Future of Cryptocurrencies
- Public Expectations for Crypto Under the Trump Administration
- Conclusion
Introduction
Cryptocurrency statistics offer valuable insights into how digital assets are transforming global finance, driving technology adoption, and influencing user behaviour. With usage expanding across continents, cryptocurrencies are gradually transitioning from specialised investment instruments to widely accepted financial alternatives.
Increasing engagement from retail users, major corporations, and government bodies underscores the growing importance of blockchain-powered systems in areas such as payments, trading, asset management, and international transfers. These figures highlight shifting investor profiles, increasing transaction volumes, regulatory changes, and evolving market participation patterns. Collectively, they demonstrate the significant impact that cryptocurrencies now have on modern financial systems and the broader digital economy.
Editor’s Choice
- The global cryptocurrency market was valued at $2.2 trillion in August 2024, representing a 36% increase from $1.6 trillion at the start of the year.
- An estimated 562 million people now own cryptocurrency, representing 8% of the world’s population.
- In the United States, more than half of adults (52%) have invested in cryptocurrency, with the highest participation seen among individuals aged 45–60.
- The average crypto investor recorded $887 in net realised gains in 2023, a significant turnaround from the $7,102 in losses they had averaged the previous year.
- Combined global trading activity across spot, futures, and PTL markets reached $77 billion in March 2024, marking the second-highest trading level since March 2021.
- Worldwide cryptocurrency users now exceed 560 million, reflecting strong mainstream adoption.
- Bitcoin accounts for about half of the entire cryptocurrency market capitalization.
- Users on the Binance platform trade over $11.5 billion worth of crypto every 24 hours.
- Bitcoin’s highest recorded daily close surpassed $73,000, marking a major pricing milestone.
- Nearly 40,000 crypto ATMs are operational worldwide, providing widespread access to digital assets.
- By 2025, a total of 17,151 cryptocurrencies will exist, though most have minimal market relevance.
- Ethereum and Bitcoin together control nearly 75% of the total global market cap, underscoring the market’s strong concentration.
- As of 2025, Bitcoin remains a high-cap asset with a market value exceeding $10 billion, reaffirming its position as a leader.
- As of 2025, there are 217 active cryptocurrency exchanges worldwide.
- The global cryptocurrency market cap has reached $2.96 trillion, illustrating rapid expansion despite persistent volatility.
- Global revenue from cryptocurrency markets is projected to reach $45.3 billion in 2025, with a worldwide penetration rate of 11.02% by year-end.
- By 2025, more than half of all cryptocurrencies created to date are expected to have failed, highlighting the high failure rate.
Count of Active Cryptocurrency Exchanges
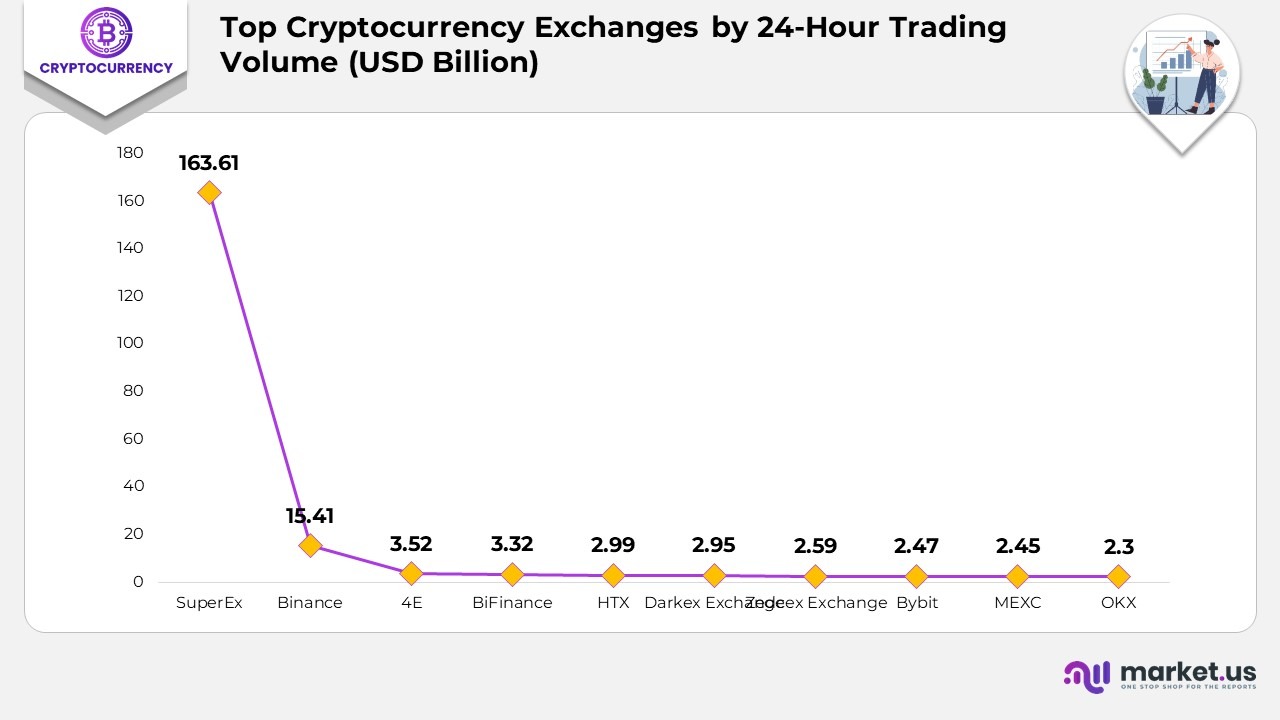
- As of 2025, there are 217 active cryptocurrency exchanges worldwide, highlighting the scale of global trading activity.
- SuperEx leads the market with an exceptional $163.61 billion in 24-hour spot trading volume.
- Binance follows in second place, recording $15.41 billion in daily trades.
- SuperEx now processes more than 10 times Binance’s volume ($163.61 vs $15.41), showing a major shift in trader preference and regional dominance.
- 4E secures a high ranking with $3.52 billion in 24-hour trading activity.
- BiFinance posts a strong daily volume of $3.32 billion.
- HTX continues to remain competitive, with $2.99 billion traded in a single day.
- Darkex Exchange closely follows with $2.95 billion in 24-hour volume.
- Zedcex Exchange registers $2.59 billion in daily trades.
- Bybit attracts significant trading interest, processing $2.47 billion within a day.
- MEXC maintains a solid level of activity with $2.45 billion in daily trading volume.
- OKX completes the top group, recording $2.30 billion in 24-hour trades.
(Source: Demandsage, Statista)
Top Crypto Performance Trends
- The global number of cryptocurrency users expanded sharply between 2018 and 2020, recording a remarkable growth of nearly 190%, marking the fastest adoption surge to date.
- As of January 30, 2025, Bitcoin (BTC) reached $105,510, representing a 12.5% increase over the previous 30 days, up from approximately $93,800 one month prior.
- Ethereum (ETH) stood at $3,217.96 on the same date, showing a 6% decline during the past month.
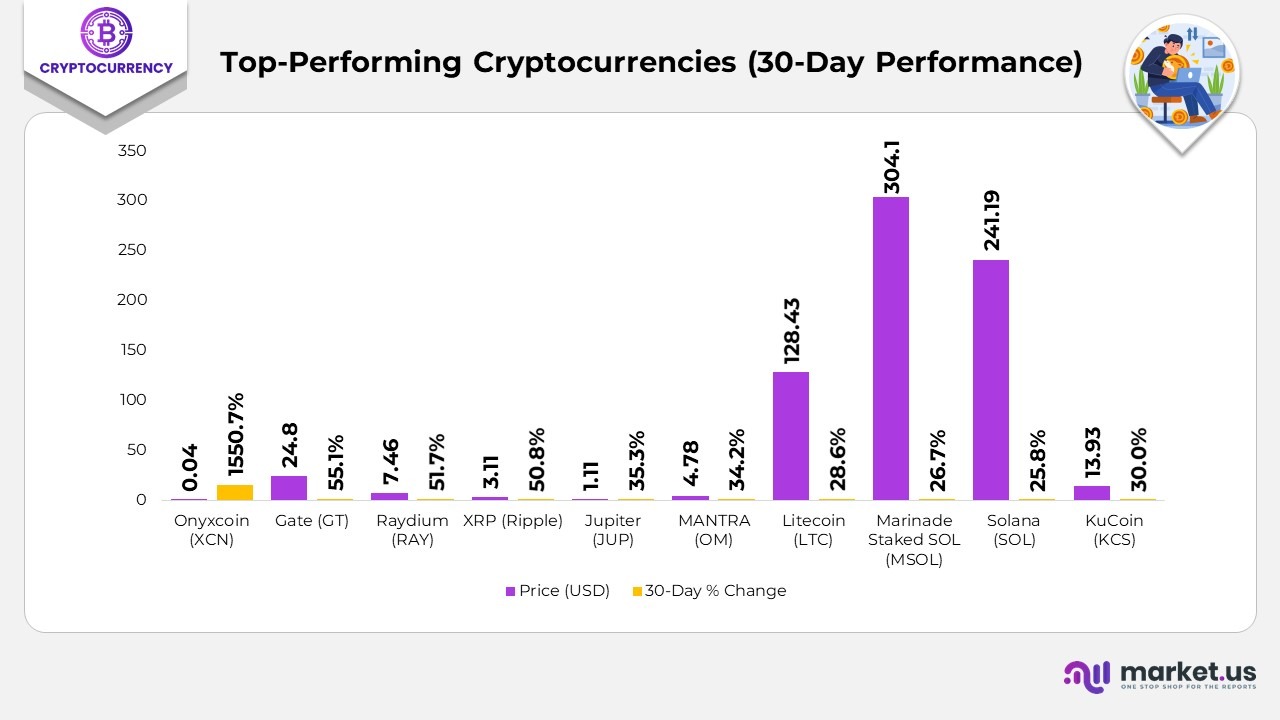
- Among the top global cryptocurrencies in 2025, Onyxcoin (XCN) delivered extraordinary performance, recording a 1,550% price increase in January, demonstrating how lower-cap assets can outperform leading tokens during strong market rallies.
- Onyxcoin (XCN) dominated the market over the past month, trading at $0.04 after an extraordinary jump of 1,550.7%.
- Gate (GT) delivered a strong monthly performance, reaching $24.8 with a growth rate of 1%.
- Raydium (RAY) showed solid upward momentum, rising 7% to a price of $7.46.
- XRP (Ripple) continued its positive trend, climbing 8% to trade at $3.11.
- Jupiter (JUP) gained notable market attention, increasing 3% to $1.11.
- MANTRA (OM) also performed well, hitting $4.78 after advancing 2% in 30 days.
- Litecoin (LTC) recorded consistent growth, rising 6% to reach $128.43.
Moreover
- Marinade Staked SOL (MSOL) increased by 26.7%, rising to $304.1.
- Solana (SOL) added 8% over the past month, landing at $241.19.
- KuCoin (KCS) closed the list with a 30.0% rise, trading at $13.93.
- Bitcoin continues to dominate investor preference, with 74% of cryptocurrency holders owning it, making it the most widely held digital asset.
- Ethereum ownership has fallen from 65% in 2022 to 49% in 2025, a shift that aligns with increased competition from high-speed smart contract networks such as Solana, which delivers up to 65,000 TPS, far exceeding Ethereum’s throughput.
- Dogecoin ownership has climbed to 31%, surpassing Solana at 18% and USDC at 17% among current holders.
- Among individuals planning to enter the market in 2025, 66% intend to purchase Bitcoin, followed by 43% who are considering Ethereum and 24% who are looking toward Dogecoin.
- Solana continues to gain investor interest, with 17% of prospective crypto buyers planning to invest in it this year.
- Ethereum logged more than 39 million on-chain transactions in December 2024, making it the most actively used blockchain during that month.
- In comparison, Bitcoin recorded 7 million transactions in the same period, roughly one-third of Ethereum’s total activity.
(Source: Demandsage, Statista)
General Cryptocurrency Statistics
- Since June 2013, cyberattacks have resulted in the theft of more than $75 billion worth of cryptocurrencies.
- Around 53% of small businesses report a preference for hiring candidates with cryptocurrency-related skills.
- One of the most devastating crypto collapses occurred in May 2022, when the Terra Classic crash wiped out approximately $40 billion; by February 2023, roughly $6 billion had been
- China dominates blockchain innovation, holding nearly 84% of all blockchain-related patents globally.
- The current price of Bitcoin stands at approximately $69,044.77.
- India has an estimated 27 million Bitcoin owners, placing it among the leading countries for crypto adoption.
- Gen X investors spend more on crypto than Gen Z and millennials, averaging $9,611 per buyer.
- About 75% of crypto holders view their digital assets primarily as an investment.
- Roughly 33 new cryptocurrencies are launched every week.
- A cryptocurrency-related post appears on social media roughly every two seconds.
- Daily cryptocurrency trading volume has fallen to $47.1 billion.
- Approximately 67% of millennials consider Bitcoin to be a safe-haven asset.
- Trading volume for crypto investment products has grown by 127%.
- By August 2022, the number of cryptocurrency wallets worldwide had reached 02 million.
- The global cryptocurrency industry is forecasted to grow at a 4% CAGR by 2025, signaling rapid expansion.
- Tokenised assets are expected to reach a market value of $16 trillion by 2030, roughly equivalent to the current size of the EU economy.
- A record 43% of individuals who do not own crypto say they are likely to invest within the next year.
(Source: G2.com, Inc., Statista)
Crypto Investor Statistics
- Men make up over 70% of Bitcoin holders, while women represent about 30% of all cryptocurrency owners.
- Security concerns stop 36% of people from investing in crypto; meanwhile, 35% are unsure what they would use it for, and 33% do not understand how to buy it.
- A lack of clear regulations discourages 28% of potential investors from entering the crypto market.
- In the United States, high earners are overrepresented among cryptocurrency owners: individuals making $ 100,000 or more per year account for 25% of crypto investors but only 15% of the general population.
- As of September 2022, Vietnam ranked first in global crypto adoption, followed by the Philippines and Ukraine.
- In Q1 2024, venture capital funding in crypto and blockchain companies reached $2.49 billion, a 29% quarter-over-quarter increase across 603
- 44% of non-crypto owners say they have no intention of ever purchasing cryptocurrency.
- The average cryptocurrency investor earns roughly $111,000 per year.
- Infrastructure-related projects received the largest share of crypto venture capital in Q1 2024.
- Nigeria shows the highest rate of cryptocurrency adoption globally.
- In 2022, about 45% of Nigerians were using or holding cryptocurrencies.
- In the United States, 77% of crypto owners hold Bitcoin.
- Among U.S. college students, 18% own cryptocurrency.
- 66% of Americans say they have no interest in owning cryptocurrencies.
- As of February 2023, there were 37,368 crypto ATMs worldwide, with owners able to convert assets to cash in 79 countries.
- In May 2022, 4% of Bitcoin owners expected their financial situation to improve within a year—significantly higher than the 27.1% of all Americans and 29.5% of high-income earners who shared the same sentiment.
- Only 6% of Americans earning under $50,000 per year own cryptocurrency.
(Source: G2.com, Inc., Statista)
Cryptocurrency Ownership
- Approximately 76% of crypto investors currently own Bitcoin (BTC), maintaining its position as the most widely held cryptocurrency.
- Ethereum (ETH) remains the second-most owned asset, held by 54% of investors, down from 65% in 2022, reflecting a shift in interest toward alternative chains.
- Concerns about market Cryptocurrency ownership continue to be the top reasons both investors and non-investors approach crypto cautiously.
- Research suggests that approximately 75% of all Bitcoin transaction volume since 2015 has been processed through cryptocurrency exchanges.
- Nearly all fiat money used for buying crypto passes through a checking account first, and 90% of cash-to-crypto transactions end up deposited into an exchange account.
- Kraken ranks among the longest-running crypto trading platforms, now supporting over 1,000 spot, margin, and futures markets and employing more than 2,500 people across 60 countries.
- Since early 2023, Kraken has maintained approximately 40% of the total EUR-denominated trading volume, consistently ranking as a highly liquid venue for major cryptocurrency pairs.
- 31% of investors did not report their crypto holdings on 2023 tax filings; half said they had no profits to declare, while 18% were unaware that crypto must be reported.
- Stablecoins reached their peak popularity in 2022, with the top ten assets collectively boasting a market cap of $152 billion.
(Source: Security.org, National Library of Medicine, NBER, FDIC, Kraken, CoinLedger, Statista)
Crypto Cyberattacks
- Since June 2013, hackers have collectively stolen more than $75 billion in cryptocurrency.
- By December 2020, losses from hacks, scams, and exploits had reached roughly $15 billion.
- This figure rose dramatically, surpassing $77 billion by October 2023, reflecting a surge in escalating security breaches in the cryptocurrency sector.
- The most devastating single event occurred in May 2022, when the Terra Classic collapse wiped out an estimated $40 billion during a rapid bank run.
- By October 2023, about $6 billion of previously stolen funds had been recovered.
- In the first half of 2024, hackers stole more than $1.38 billion in crypto over double the $657 million lost during the same period in 2023.
(Source: DeFiYield, Reuters)
Cryptocurrency Trading Statistics
- Binance remains the world’s largest cryptocurrency exchange, with Coinbase Exchange in second place, handling $1.6 billion, and Kraken third with $0.98 billion in daily trading volume.
- Users on Binance transact approximately $20.37 billion worth of cryptocurrencies every 24 hours, highlighting its massive global activity.
- Coinbase has a verified user base of nearly 110 million, making it one of the most widely used crypto trading platforms.
- In Q1 2024, the United States accounted for 3% of all global crypto-related deals. Singapore followed with 10.8%, the United Kingdom with 10.2%, Switzerland with 3.5%, and Hong Kong with 3.2%.
- As of February 2023, 65% of crypto owners in the United States reported using Coinbase as their primary exchange.
- Around two-thirds of all Bitcoin hedge funds are headquartered in either the United States or the Cayman Islands.
- The Cayman Islands, known for its favourable tax regulations, host 34% of all cryptocurrency hedge funds, with the United States in close second at 33%.
- Cryptocurrency funds collectively manage more than $59.6 billion in assets worldwide.
- Only 7% of crypto companies possess assets exceeding $100 million, while 39% operate with under $10 million.
- Crypto funds employing venture or ICO-focused strategies yield an average return of 31.2%, making them among the highest-yielding fund types in the sector.
(Source: G2.com, Inc, Statista)
Cryptocurrency Mining Statistics
- A standard Ethereum mining setup is estimated to produce around $4,854.50 in annual revenue.
- A Real Research Media survey found that 44% of participants expect Bitcoin to hit $100,000 in 2024.
- Over 90% of the total Bitcoin supply has already been mined, leaving a limited amount remaining.
- The United States accounts for approximately 38% of global Bitcoin mining activity.
- The top 10 Bitcoin-mining countries collectively contribute 8% of the network’s total hash rate, with the leading three being China, the U.S., and Kazakhstan.
- A single Bitcoin transaction consumes approximately 2,264 kWh of energy, which is significantly higher than most traditional digital payment systems.
- If Bitcoin were classified as a country, its energy consumption would rank 23rd in the world.
- Bitcoin’s carbon emissions are estimated at 77 megatons of CO₂, comparable to the national footprint of Kuwait.
(Source: G2.com, Inc, Statista)
Growth Trend in Cryptocurrency Users
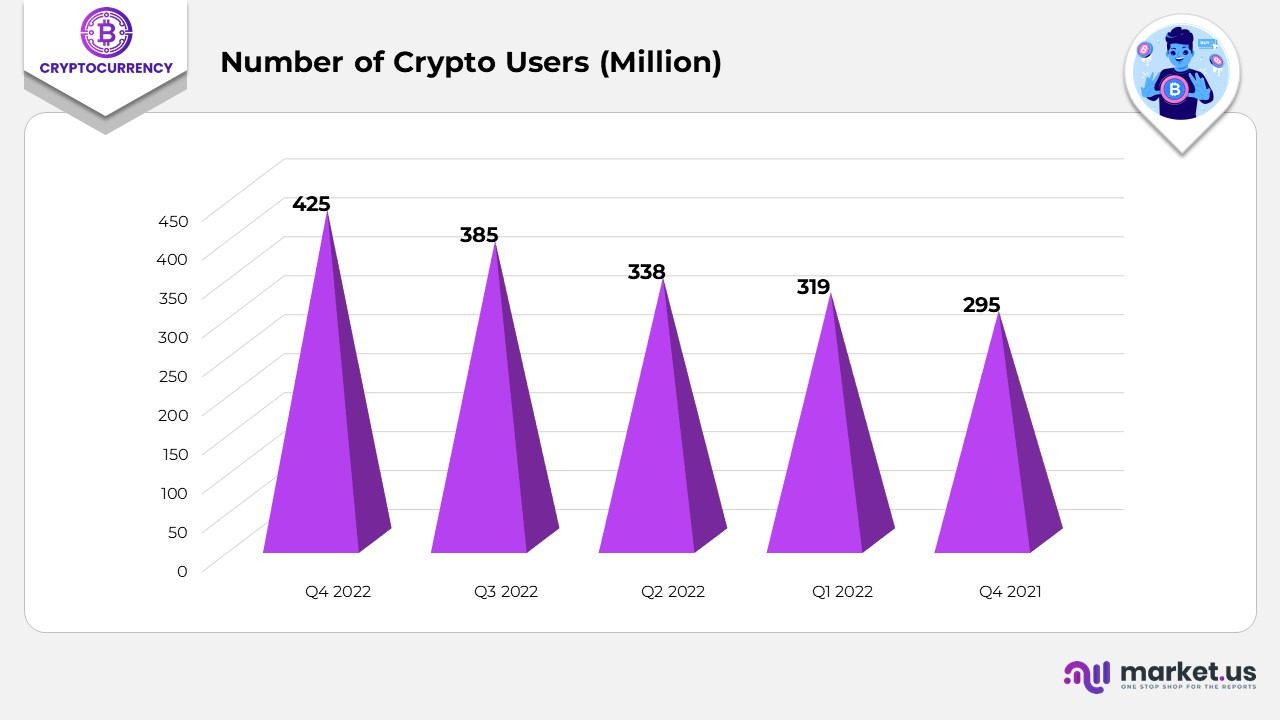
- By Q4 2022, the global cryptocurrency user base had climbed to 425 million, marking a significant surge in adoption.
- In Q3 2022, the number of crypto users reached 385 million, continuing the upward growth trend.
- During Q2 2022, global crypto participation increased to 338 million, reflecting growing market interest.
- In Q1 2022, the global cryptocurrency community consisted of approximately 319 million
- At the end of Q4 2021, the number of crypto users stood at 295 million, laying the foundation for continued growth into 2022.
(Source: G2.com, Inc, Statista)
Where Crypto Adoption Is Growing the Fastest?
- India leads global cryptocurrency adoption, with 29% of its population engaging in digital asset usage.
- Nigeria follows closely, recording a 27% adoption rate driven by high mobile payments and financial innovation.
- Vietnam ranks next with 25% of its population using cryptocurrencies, reflecting strong grassroots uptake.
- Australia is showing growing interest in digital assets, with 22% of citizens participating in cryptocurrency activities.
- Ghana demonstrates notable adoption at 20%, highlighting increasing demand for decentralized financial tools.
- Singapore also reports a 20% adoption rate, supported by its tech-forward economy and regulatory clarity.
- Hong Kong records an 18% adoption rate, reflecting its strong trading environment and robust digital finance ecosystem.
- Venezuela, driven by economic instability, also has an 18% crypto usage rate among its population.
- Brazil reaches a 17% adoption level, showing rising enthusiasm across Latin American markets.
- Indonesia rounds out the list with 16% of its population actively using digital currencies.
(Source: G2.com, Inc, Statista)
Cryptocurrency Fraud Statistics
- Binance users collectively trade approximately $5.79 billion in cryptocurrency every 24 hours, reflecting the platform’s massive global activity.
- Coinbase Exchange records daily trading volumes of approximately $1.6 billion, while Kraken handles close to $0.98 billion in the same period.
- In the United States, 62% of crypto owners choose Coinbase, making it the most widely preferred exchange among American traders.
- Many users report choosing Coinbase over platforms like Robinhood due to its ease of use and stronger brand trust.
- Despite Coinbase’s dominance in the U.S., international traders often seek platforms with competitive incentives. Bybit’s referral bonuses attract a large number of active global users.
- Crypto funds worldwide manage over $59.6 billion in assets, with a small percentage of firms holding the majority of the shares.
- Only 7% of crypto firms control assets worth $100 million or more, while 39% operate with assets of $10 million or less, indicating a highly uneven distribution of assets.
Moreover
- More than 46,000 people reported crypto-related losses exceeding $1 billion between January 2021 and June 2022.
- Cyberattacks continue to target exchanges, businesses, and individuals, causing widespread financial harm.
- Consumers in the United States lost an estimated $2.6 billion to crypto scams during this period.
- Analysts warn that scam activity is likely to surpass previous levels as fraud tactics continue to evolve.
- Crypto-related scams resulted in $2.57 billion in losses in 2022, representing over one-third of all investment fraud for that year, which totalled $3.31 billion.
- The crypto industry’s largest single loss occurred in May 2022, when the Terra Classic collapse erased $40 billion.
- The year 2022 saw the highest number of crypto fraud cases, with 120 incidents, marking a 28% increase from 2021.
- Although the number of fraud incidents rose sharply, total losses were less than half of the previous year’s financial damage.
- Long-term data shows 120 fraud incidents in 2022, 84 in 2021, 31 in 2020, and 28 in 2019, highlighting a sharp rise in criminal activity as crypto adoption expands.
(Source: G2.com, Inc., The Fintech Times, Statista)
Reasons Why People Choose to Invest in Cryptocurrency
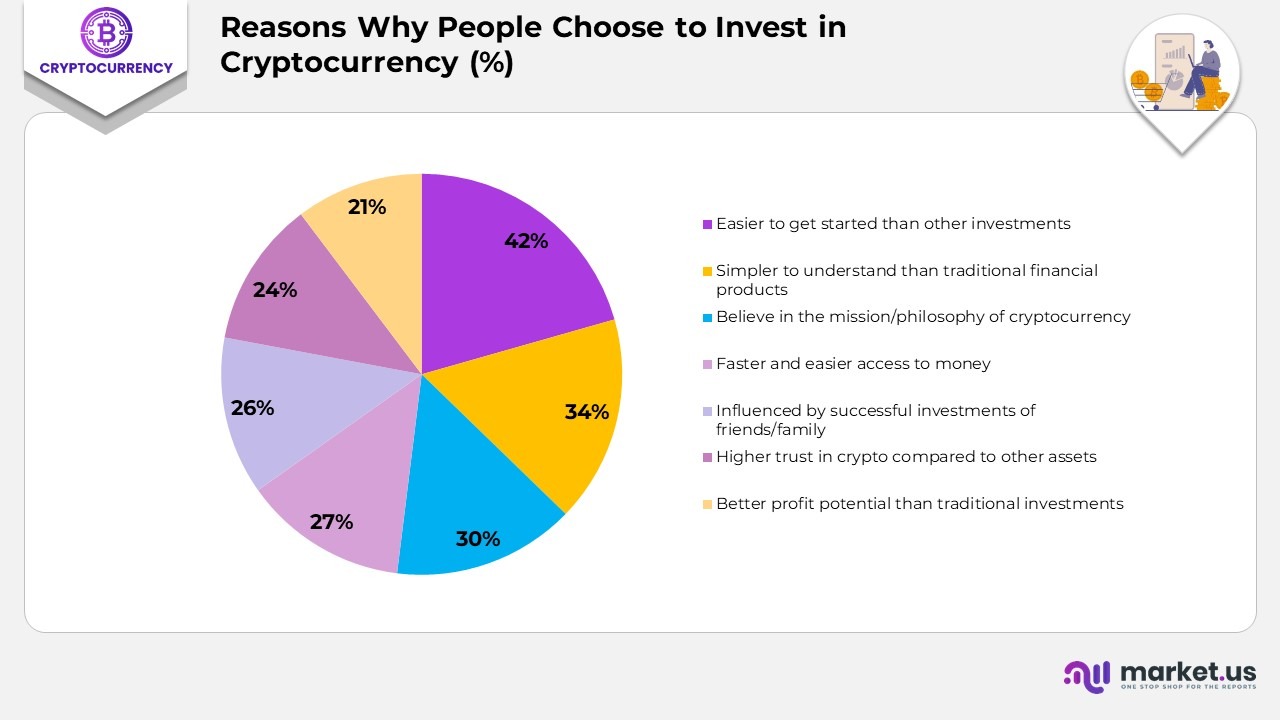
- 42% of people invest in cryptocurrency because they find it easier to get started compared to other investment options.
- 34% say they choose crypto because the concepts and platforms are simpler for them to understand.
- 30% are motivated by a belief in the broader mission or philosophy behind cryptocurrency.
- 27% appreciate that crypto allows quicker and easier access to their money.
- 26% were influenced by successful crypto investments made by friends or family members.
- 24% feel a higher level of trust in cryptocurrency than in other financial assets.
- 21% believe that investing in crypto offers better profit potential than traditional investment avenues.
(Source: DemandSage, Forbes)
Crypto Concerns in 2025
- 59% of people familiar with cryptocurrency lack confidence in its security, including 40% of active crypto owners.
- Nearly 1 in 5 crypto holders have experienced difficulties withdrawing funds from custodial platforms.
- Among non-owners, 39% cite price instability as their biggest concern, while 32% of owners worry most about cyberattacks.
- A combined 93% of respondents come from Europe, Asia, North America, and Africa, showing widespread global interest in Crypto-AI innovations.
- 53% of survey participants are in their first crypto cycle, meaning they have been involved in crypto for 0–3 years, signaling a wave of newer market entrants.
- In 2025, 51% of users considered themselves long-term crypto investors, whereas 26% identified primarily as short-term traders.
(Source: DemandSage, Coin Gecko)
The Future of Cryptocurrencies
- The use of cryptocurrency in global payments is expected to remain small. Projected to represent only 0.2% of the worldwide transaction value by 2027.
- The number of global cryptocurrency users is forecast to reach 01 million in 2025, with a worldwide penetration rate of 11.02%.
- The United States is expected to generate the highest crypto-related revenue by the end of 2025, reaching approximately $9.4 billion.
(Source: DemandSage, Statista)
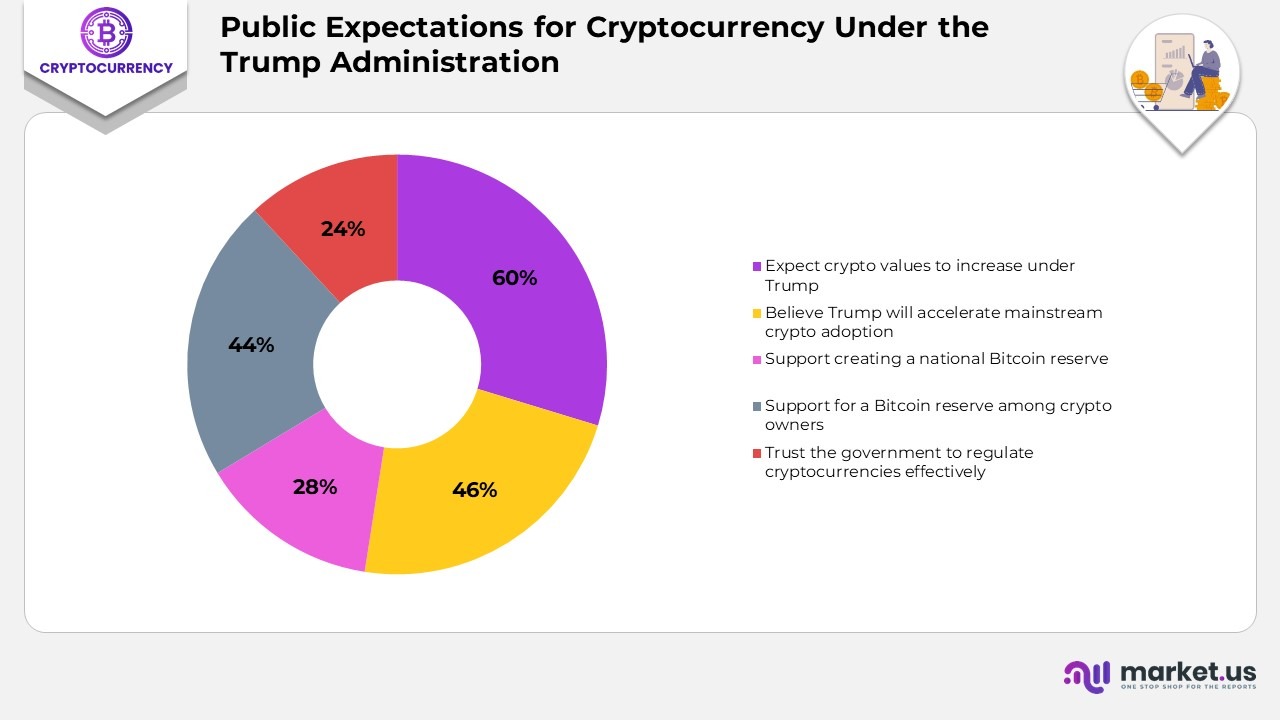
Public Expectations for Crypto Under the Trump Administration
- 60% of Americans familiar with crypto expect digital asset values to rise under President Trump’s leadership.
- 46% believe his administration will help accelerate mainstream adoption of cryptocurrency.
- 28% support establishing a national Bitcoin reserve, a figure that rises to 44% among current cryptocurrency owners.
- Only 24% of respondents trust the government to regulate cryptocurrencies effectively.
(Source: DemandSage, Security org)
Conclusion
Cryptocurrency statistics reveal how quickly digital assets are transforming global finance, user participation, and investment behavior. Increasing transaction activity, a growing number of users, and rising institutional interest show that the crypto ecosystem is steadily advancing while remaining highly adaptive. Although Bitcoin and Ethereum continue to anchor the market, newer altcoins and high-speed blockchain networks are gaining meaningful traction.
Shifts in investor choices, global usage patterns, and technological adoption indicate a future in which digital currencies will become an integral part of financial systems, digital infrastructure, and everyday economic activity. As innovation accelerates, these insights help illustrate the ongoing evolution of the crypto landscape and the direction it is poised to take.