


Report Overview
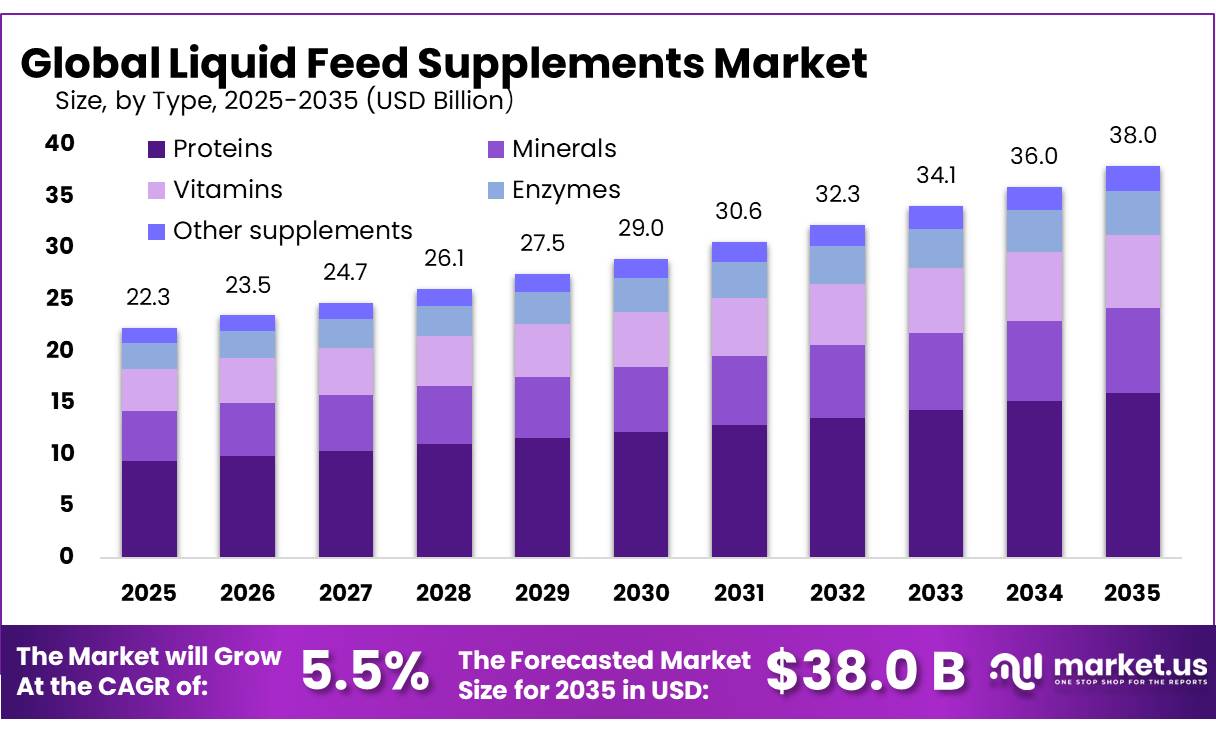
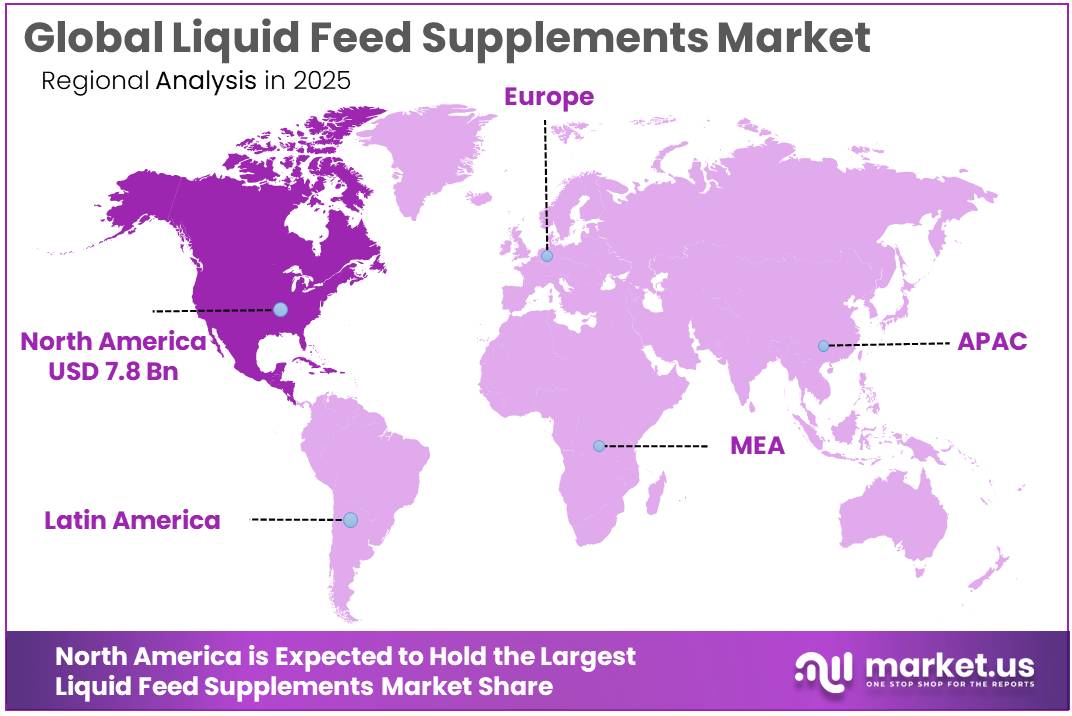
The Global Liquid Feed Supplements Market size is expected to be worth around USD 38.0 Billion by 2035, from USD 22.3 Billion in 2025, growing at a CAGR of 5.5% during the forecast period from 2026 to 2035. In 2025, North America held a dominant market position, capturing more than a 35.00% share, holding USD 7.8 Billion revenue.
The liquid feed supplements industry forms an important part of modern livestock nutrition, particularly in cattle and other ruminant production systems. These formulations commonly combine energy sources, protein or non-protein nitrogen, minerals, vitamins, fats and other functional ingredients in a pumpable liquid form. USDA technical information notes that liquid supplements commonly use materials such as molasses, fat and urea, with molasses content in some formulations reaching as high as 70% by weight on a solids basis.
- The International Feed Industry Federation estimates that world compound-feed production could reach around 1.4 billion tonnes annually in 2025, while global commercial feed manufacturing generates annual turnover exceeding USD 500 billion. IFIF members represent more than 80% of worldwide compound-feed production, demonstrating the scale and industrialisation of the livestock nutrition supply chain.
North America remains an important demand environment because of its large commercial cattle population. USDA reported 94.2 million cattle and calves on U.S. farms on July 1, 2026, including 28.5 million beef cows, 9.65 million milk cows and 13.2 million cattle on feed. Cattle-on-feed numbers were 2% higher than a year earlier. Such large managed herds support continued requirements for convenient energy, protein, mineral and micronutrient supplementation, particularly where forage quality changes seasonally.
- A similarly established feed infrastructure exists in Europe. FEFAC expects EU industrial compound-feed production to reach approximately 152 million tonnes in 2026, while cattle-feed production is forecast at about 45.358 million tonnes. The European Commission also states that European livestock requires roughly 450 million tonnes of feed annually, indicating the substantial underlying nutrition requirement across commercial livestock systems.
Industry growth is being driven by the need for more precise nutrition, improved feed utilisation, labour-efficient delivery and greater use of co-products. The American Feed Industry Association reports that U.S. livestock, poultry and aquaculture consume nearly 284 million tons of feed annually, while approximately 37% of feed ingredients, excluding harvested forage and roughage, are co-products from other industries. Liquid systems can support this circular approach by incorporating suitable soluble or fluid co-products while allowing nutrients to be distributed consistently.
Innovation in environmental nutrition could create another development route. European Commission research indicates that an average dose of approximately 120 mg of 3-NOP per kg of dry-matter intake reduced methane formation by around 39% in dairy cattle and 22% in beef cattle in reviewed studies. These developments encourage research into accurately dosed functional feeds and advanced delivery systems, although commercial adoption remains dependent on regulatory approval, animal safety and validated performance. Feed-additive authorisations in the EU are generally valid for 10 years, reinforcing the importance of scientifically supported formulation and traceability.
Key Takeaways
- Liquid Feed Supplements Market size is expected to be worth around USD 38.0 Billion by 2035, from USD 22.3 Billion in 2025, growing at a CAGR of 5.5%.
- Proteins held a dominant market position, capturing more than a 42.00% share.
- Molasses held a dominant market position, capturing more than a 38.00% share.
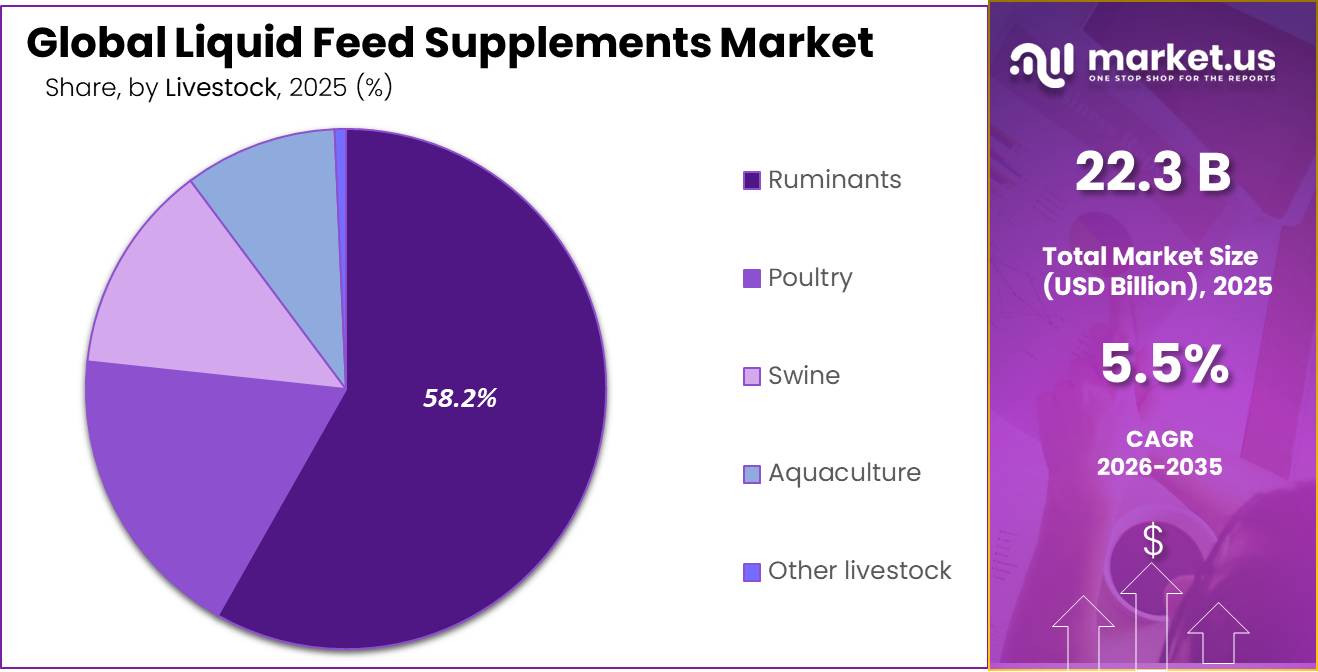
- Ruminants held a dominant market position, capturing more than a 58.20% share.
- Direct sales held a dominant market position, capturing more than a 52.30% share.
- North America held a dominant position in the Liquid Feed Supplements Market, capturing more than a 35.00% share and generating approximately USD 7.8 billion.
By Type Analysis
Proteins dominate the Liquid Feed Supplements Market with more than a 42.00% share, supported by large commercial cattle and dairy feeding operations.
In 2025, “Proteins” held a dominant market position, capturing more than a 42.00% share. Protein-based liquid feed supplements remained widely used because they provide cattle with a convenient source of supplemental protein, particularly when forage or basal diets cannot fully meet nutritional requirements. Large feedlot operations create a steady consumption base for these products.
- In July 2026, the United States had 13.2 million cattle on feed, an increase of 2% from the previous year, while the national milk-cow population reached 9.65 million head. USDA specifically defines cattle on feed as animals receiving rations containing grain, silage, hay and/or protein supplements, directly supporting the importance of supplemental protein in intensive cattle production.
Protein supplementation also gains importance as livestock productivity increases. USDA reported that U.S. milk production reached 232 billion pounds in 2025, representing an increase of 2.6%, while average production reached 24,390 pounds per cow. Higher-output dairy animals require balanced diets capable of supplying adequate protein alongside energy, minerals and other nutrients.
Liquid protein supplements can be incorporated into feed programs to improve nutrient delivery, support rumen function and complement lower-quality forage. Their easy mixing and controlled feeding characteristics therefore make protein formulations particularly suitable for commercial dairy and beef operations seeking consistent animal performance.
By Source Analysis
Molasses dominates the Liquid Feed Supplements Market with more than a 38.00% share, supported by its energy value and established use in liquid formulations.
In 2025, “Molasses” held a dominant market position, capturing more than a 38.00% share. Molasses remains a preferred source for liquid feed supplements because its naturally fluid form makes it suitable for blending with protein, minerals and other nutritional ingredients. It also supplies readily fermentable energy and can improve the handling and palatability of liquid feed mixtures.
Official USDA information confirms that animal-feed supplements extensively use molasses and that finished liquid supplements can contain molasses at concentrations reaching 70% by weight on a solids basis. The material also helps maintain the stability of liquid formulations, which supports its continued use in commercial cattle-feeding programs.
Corn represents an important source in the Liquid Feed Supplements Market because it provides a widely available energy input for livestock nutrition and can also generate liquid and soluble co-products through processing. USDA Economic Research Service identifies corn as the primary U.S. feed grain and states that most corn used for livestock feeding serves as a main energy ingredient. Corn processing also produces ingredients such as starch, sweeteners and various feed co-products, creating additional opportunities for their use in formulated animal nutrition systems.
By Livestock Analysis
Ruminants dominate the Liquid Feed Supplements Market with more than a 58.20% share
In 2025, “Ruminants” held a dominant market position, capturing more than a 58.20% share. Liquid feed supplements are widely suited to ruminant feeding because cattle, sheep, and goats can receive supplemental protein, energy, minerals, and other nutrients alongside forage-based diets. Large commercial cattle populations create a steady requirement for these formulations.
USDA reported that the United States had 94.2 million cattle and calves as of July 2026, including 28.5 million beef cows and 9.65 million milk cows. Cattle on feed reached 13.2 million head, showing the size of the intensive feeding base where balanced supplementation plays an important role.
Poultry represents an important segment of the Liquid Feed Supplements Market, supported by the large scale and continuous production cycle of commercial broilers, layers, and turkeys. Liquid nutritional ingredients can be incorporated into feeding and drinking systems where suitable, helping producers manage vitamins, minerals, amino acids, and other nutritional inputs efficiently. USDA reported that U.S. producers raised 9.40 billion broilers in 2025, with total live-weight production reaching 62.2 billion pounds.
By Distribution Channel Analysis
Direct sales lead the Liquid Feed Supplements Market with more than a 52.30% share
In 2025, “Direct sales” held a dominant market position, capturing more than a 52.30% share. Direct purchasing is well suited to liquid feed supplements because large cattle and dairy farms often require bulk volumes, scheduled deliveries, storage tanks, and formulations adjusted to specific feeding programs. USDA reported that U.S. feedlots with capacity of 1,000 head or more held 11.5 million cattle on feed at the beginning of 2026.
These large operations account for about 85% of all fed cattle in the country, creating a strong customer base for direct manufacturer-to-farm supply arrangements. Direct sales can also simplify technical support, product handling, formulation changes, and recurring deliveries for high-volume livestock producers.
Distributors and retailers represent an important distribution channel in the Liquid Feed Supplements Market because they provide local product availability, smaller purchasing quantities, storage support, and easier access for farms that do not require direct bulk deliveries. USDA estimated that the United States had 1.865 million farms in 2025, covering approximately 873.95 million acres, with an average farm size of 469 acres.
The large number and geographic spread of farms creates a practical role for agricultural dealers, feed stores, cooperatives, and regional distributors that can maintain local inventories and serve producers without requiring manufacturer-level order volumes.
Key Market Segments
By Type
- Proteins
- Minerals
- Vitamins
- Enzymes
- Other supplements
By source
- Molasses
- Corn
- Urea
- Other sources
By Livestock
- Ruminants
- Poultry
- Swine
- Aquaculture
- Other livestock
By Distribution Channel
- Direct sales
- Distributors and retailers
- Online sales
Driver Analysis
Forage-Risk Supplementation
Weather-driven grazing losses convert liquid supplements from discretionary productivity inputs into tactical energy-protein insurance: USDA’s Livestock Forage Disaster Program explicitly compensates producers for increased feed costs arising from qualifying drought or fire, with support now beginning after four consecutive weeks of severe D2 drought, rising to two monthly payments after seven of eight weeks, three payments at D3, four payments after four D3 weeks or any D4 event, and five payments after four D4 weeks.
This matters against a still-constrained U.S. herd base of 86.2 million cattle and calves on January 1, 2026, including 27.6 million beef cows, while the 2025 calf crop fell 2% to 32.9 million head; fewer breeding animals increase the value of maintaining body condition and reproductive performance per cow rather than maximizing supplement volume indiscriminately. In a modeled 500-cow operation, replacing a 2 kg daily forage-energy shortfall for 120 days creates 120 metric tons of as-fed supplement demand; shifting only 10% of the 27.6 million U.S. beef-cow base into a comparable four-month program would represent approximately 662,000 metric tons of annualized product throughput before calves or stockers.
Liquid systems capture this demand because molasses supplies rapidly fermentable energy and carries urea, minerals and additives uniformly, while tanks permit scheduled bulk delivery; suppliers therefore move from seasonal commodity selling toward drought-triggered contracts, pasture-monitoring alerts and minimum-volume reservations. The modeled +2.1-percentage-point CAGR contribution is highest in drought-prone North America, Brazil, Australia and southern Africa over 2026-2028, with value accruing to regional blenders that pre-position molasses, tank fleets and credit before forage indices deteriorate.
Drivers Impact Analysis
| Driver(~) | % Impact on CAGR Forecast | Geographic Relevance | Impact Timeline |
|---|---|---|---|
| Forage-Risk Supplementation | +2.1% | North America, LatAm, ANZ | Short term (≤ 2 years) |
| Dairy Output Intensification | +1.8% | North America, EU, APAC | Medium term (2-4 years) |
| Labor-Saving Self-Feeding | +1.5% | North America, ANZ, LatAm | Short term (≤ 2 years) |
| Low-Cost Nitrogen Delivery | +1.3% | Americas, APAC, Africa | Short term (≤ 2 years) |
| Precision Liquid Nutrition | +1.1% | North America, EU, APAC | Medium term (2-4 years) |
| Functional Additive Carriers | +0.9% | EU, North America, ANZ | Long term (≥ 4 years) |
Restraint Analysis
Feedstock Volatility and Biofuel Diversion
Molasses, urea, corn-derived solubles, fats, vitamins, and minerals create a cost structure exposed simultaneously to crop weather, energy prices, fertilizer cycles, and industrial demand; the most disruptive 2026 mechanism is the competition between livestock nutrition and biofuel production for sugar- and grain-based inputs.
India had already reached 19.93% ethanol blending in July 2025, allocated 4.0 million tonnes of sugar to ethanol in ethanol supply year 2024/25, and then permitted unrestricted ethanol production from cane juice, syrup, B-heavy molasses, and C-heavy molasses for 2025/26, materially strengthening the bidding position of distilleries for the same carbohydrate streams used in liquid feed.
Nitrogen economics add a second shock channel: Illinois urea rose 42% between February 20 and March 20, 2026 to roughly $0.89 per pound of nitrogen, while the international urea benchmark was around $451 per tonne in September 2026, making non-protein nitrogen fortification materially more expensive and more difficult to price on annual farm contracts.
The modeled -1.6 percentage-point CAGR drag assumes that molasses and nitrogen compounds together account for roughly 45–60% of variable formulation cost, that a 15–25% blended-input shock raises finished-product cost by approximately 7–14%, and that manufacturers can recover only 50–65% through pricing before farmers substitute dry blocks, commodity concentrates, or untreated by-products; the resulting 3–7% gross-margin compression weakens distributor incentives, delays new blending capacity, and concentrates purchasing among large integrators.
India and other ethanol-expanding Asian markets face the highest near-term exposure, the EU remains vulnerable to declining long-run sugar production, and North and Latin America retain weather- and energy-linked volatility even where physical supply is comparatively deeper.
Restraint Impact Analysis
| Restraint(~) | % Impact on CAGR | Geographic Relevance | Impact Timeline |
|---|---|---|---|
| Feedstock volatility | -1.6% | India, EU, Americas | Short term (≤ 2 years) |
| Herd-cycle contraction | -1.2% | North America core | Medium term (2-4 years) |
| Logistics and storage cost | -1.1% | Cold regions, rural APAC/MEA | Medium term (2-4 years) |
| Intake inconsistency | -0.8% | Extensive grazing markets | Long term (≥ 4 years) |
| Regulatory burden | -0.7% | EU, North America | Medium term (2-4 years) |
| Smallholder affordability | -1.4% | India, Africa, Southeast Asia | Long term (≥ 4 years) |
Opportunity Analysis
Methane-Reduction Liquid Platforms
FDA’s 2024 review found that 3-NOP at 60–80 mg per kilogram of total-ration dry matter reduced methane per pound of dry-matter intake in lactating dairy cows, while the EU authorizes 53–80 mg per kilogram and Denmark’s program design uses an expected 28.5% average reduction per animal; commercial evidence commonly frames the effect near 30%, or about 1.2 tonnes of CO2-equivalent per lactating cow annually.
Verra’s active VM0041 methodology now covers scientifically substantiated, approved feed ingredients globally, while Gold Standard provides a route for beef projects using either direct measurement or regression/IPCC Tier 2 quantification, creating the infrastructure to sell outcomes rather than tonnes of supplement.
The modeled +1.9 percentage-point CAGR upside assumes suppliers convert 4–7% of commercially addressable dairy and feedlot animals by 2030, capture an incremental $35–$70 per treated head annually through additive handling, MRV, and program-management fees, and earn gross margins of 30–45% on the service layer versus approximately 12–22% on commodity-heavy liquid feed; using the documented 1.2-tonne reduction as the technical ceiling, even $15–$30 per verified tonne creates $18–$36 of annual environmental value per cow before downstream dairy or beef premiums.
Winning models will use multi-year contracts in which processors, brands, or carbon buyers absorb part of the estimated $100–$150 annual inhibitor cost, while the liquid-feed supplier controls formulation, dosing continuity, audit records, and revenue sharing, thereby increasing retention and revenue per animal without relying on herd expansion.
Opportunity Impact Analysis
| Opportunity(~) | % Potential CAGR Upside | Geographic Relevance | Execution Window |
|---|---|---|---|
| Methane-reduction platforms | +1.9% | North America, EU, Oceania | Short term (≤ 2 years) |
| Smart dispensing subscriptions | +1.4% | North America, EU, Australia | Medium term (2-4 years) |
| Cooperative micro-depots | +1.7% | India, Pakistan, East Africa | Short term (≤ 2 years) |
| Circular by-product hubs | +1.2% | EU, Americas, APAC clusters | Medium term (2-4 years) |
| Grazing-herd formulations | +1.0% | Americas, Australia, Africa | Long term (≥ 4 years) |
| Dealer-network roll-ups | +0.9% | North America, Brazil, India | Medium term (2-4 years) |
Challenges Analysis
Variable Nutrient Inputs
Liquid supplement manufacturers must continuously normalize heterogeneous molasses, glycerol, fermentation solubles, minerals, and other co-products whose dry matter, sugar, crude-protein, sulfur, ash, pH, and viscosity move by source and season; published commercial specifications illustrate dry matter spanning roughly 50-74%, sugar 28-64%, and crude protein 6.5-65% across common molasses blends, while current dairy-nutrition literature identifies feed-composition variation as a material formulation issue rather than an isolated procurement event.
The friction is operational, not a sales prohibition: an analyst operating case assumes that a 3-5 percentage-point dry-matter deviation in a 25-ton batch can shift delivered nutrient solids by approximately 0.75-1.25 tons before correction, requiring more near-infrared or wet-chemistry assays, tighter supplier certificates, micro-ingredient rebalancing, and 1-3% contingency over-formulation; acidic conditions can also destabilize trace-mineral complexes, weakening confidence that label inclusion equals biological availability.
These corrections increase laboratory touches, working inventory and batch-release time, and can erase an estimated 80-140 basis points from attainable market CAGR by making small regional runs uneconomic, raising customer-specific reformulation costs, and discouraging distributors from carrying broad SKU portfolios; mitigation requires multi-source ingredient databases, incoming-lot testing, statistical process control, digital certificates of analysis, dynamic least-cost formulation, and contracts that price on nutrient solids rather than delivered liquid mass, but agricultural co-products will remain intrinsically variable beyond 2030.
Challenges Impact Analysis
| Challenge(~) | % CAGR Friction Drag | Geographic Relevance | Mitigation Horizon |
|---|---|---|---|
| Variable Nutrient Inputs | -1.4% | Global; APAC, LatAm | Long term (≥ 4 years) |
| Uneven Free-Choice Intake | -1.2% | North America, ANZ, LatAm | Medium term (2-4 years) |
| Viscous Bulk Logistics | -1.0% | Cold-climate NA/EU; remote APAC | Medium term (2-4 years) |
| Quality-Control Complexity | -0.9% | EU, North America | Medium term (2-4 years) |
| Technical Advisory Gaps | -0.8% | APAC, LatAm, Africa | Long term (≥ 4 years) |
| Outcome Verification Burden | -0.7% | EU, North America, ANZ | Long term (≥ 4 years) |
Geopolitical Impact Analysis
Ongoing Wars Increase Feed Input and Supply-Chain Pressure on Liquid Feed Supplements
The ongoing Russia–Ukraine war and the 2026 Middle East conflict continue to influence the Liquid Feed Supplements Market through feed-grain availability, fertilizer costs, fuel prices, and freight disruption. Liquid supplements depend on inputs such as corn, molasses, urea, minerals, and other agricultural co-products, so higher transport and raw-material costs can quickly affect formulation expenses.
USDA data show Ukraine’s corn exports at about 23.2 million metric tons for 2025/26, confirming that the Black Sea region remains important to global feed-grain supply despite wartime risks.
The Middle East conflict adds another layer of cost pressure. The World Bank reported that energy prices are projected to rise 24% in 2026, while fertilizer prices could increase 31%, driven partly by a 60% rise in urea prices. This is important for liquid feed producers because urea is widely used as a non-protein nitrogen source in ruminant supplements. Higher crude oil and natural-gas costs can also raise manufacturing, storage, and tanker-delivery expenses.
As a result, producers are likely to diversify sourcing, increase regional procurement, reformulate around available co-products, and build larger safety stocks. These measures can protect supply continuity, but geopolitical uncertainty is expected to keep input-price volatility elevated across major livestock-producing markets through the year.
Regional Insights
North America Leads the Liquid Feed Supplements Market, While Asia-Pacific Shows Strong Growth Potential
In 2025, North America held a dominant position in the Liquid Feed Supplements Market, capturing more than a 35.00% share and generating approximately USD 7.8 billion. The region benefits from large commercial dairy and beef operations, well-developed feed manufacturing infrastructure, and widespread use of supplemental protein, minerals, molasses, and energy ingredients.
In July 2026, the United States had 94.2 million cattle and calves, including 28.5 million beef cows and 9.65 million milk cows. Cattle on feed reached 13.2 million head, increasing 2% from the previous year. These large managed herds create consistent demand for liquid supplements that can support nutrient intake, forage utilization, and feeding efficiency.
Asia-Pacific is positioned as the fastest-growing regional segment, supported by expanding livestock production, higher animal-protein consumption, and greater adoption of commercially formulated feeds. China remains a major contributor to this expansion. Official government statistics show that China produced 100.72 million metric tons of pork, beef, mutton, and poultry meat in 2025, representing growth of 4.2%. Beef production reached 8.01 million metric tons, increasing 2.8%, while poultry production rose 6.7% to 28.37 million metric tons.
Feed availability also strengthened, with corn production reaching 301.24 million metric tons, up 2.1%. This expanding livestock and feed base creates favorable conditions for liquid nutritional supplements, especially formulations containing molasses, protein, minerals, and other energy-rich ingredients used to improve ration consistency and livestock productivity.
Key Regions and Countries Insights
- North America
- US
- Canada
- Europe
- Germany
- France
- The UK
- Spain
- Italy
- Rest of Europe
- Asia Pacific
- China
- Japan
- South Korea
- India
- Australia
- Rest of APAC
- Latin America
- Brazil
- Mexico
- Rest of Latin America
- Middle East & Africa
- GCC
- South Africa
- Rest of MEA
Key Players Analysis
Cargill remains a major participant in animal nutrition through its global feed, micronutrition, and health-solutions portfolio. In fiscal 2026, the company generated USD 164 billion in revenue and employed more than 155,000 people across 70 countries. Its animal-nutrition business includes liquid applications such as LiquiCare RTU, a ready-to-use cattle drench, alongside feed additives and precision-nutrition tools.
ADM maintains a strong position in animal nutrition through complete feeds, premixes, additives, amino acids, and customized livestock solutions. In 2025, ADM reported USD 80.269 billion in total revenue, while Animal Nutrition generated USD 3.325 billion. The company produces about 3 million metric tons of feed annually through more than 50 plants worldwide, with distribution across 6 continents.
Land O’Lakes, through Purina Animal Nutrition, has a long-established position in livestock feed and supplementation. The cooperative states that its businesses feed about 100 million animals each day. Purina’s Animal Nutrition Center covers 1,263 acres, includes a 300-cow dairy operation, and evaluates more than 3,000 animals annually with over 150 nutritionists, veterinarians, and animal-care staff. Its Accuration Range Liquid portfolio includes formulations containing 5%, 10%, and 12% fat, supporting pasture cattle with protein, energy, vitamins, and minerals.
Top Key Players Outlook
- Cargill, Incorporated
- ADM
- Land O’Lakes/Purina Animal Nutrition
- BASF SE
- Nutreco/Trouw Nutrition
- Alltech, Inc.
- GrainCorp Limited
- Westway Feed Products
- Quality Liquid Feeds
- Performance Feeds
- Ridley Corporation
- Dallas Keith
- Kemin Industries
- Evonik Industries
- De Heus Animal Nutrition
Recent Developments
- In March 2026, BASF subsidiary trinamiX and Eurofins Agro expanded their partnership for mobile forage analysis into 4 additional countries—France, Italy, Portugal and Spain—while adding alfalfa/lucerne silage analysis and energy measurements, strengthening BASF’s digital support for dairy and cattle nutrition. From an investment perspective, BASF’s Nutrition & Care segment, which includes Nutrition & Health, recorded €662 million in investments and €137 million in R&D expenses for 2025.
- In November 2025, under Investment & Expansion, GrainCorp reported record Animal Nutrition sales of 713,000 metric tonnes, compared with 517,000 metric tonnes a year earlier, while volumes had risen 83% from FY2021. XF Australia contributed 241,000 metric tonnes during FY2025 and generated about AUD 14 million EBITDA. GrainCorp also invested in expanding liquid-feed and dry-lick production capacity at Kyneton, Victoria, responding to stronger feedlot demand.
Report Scope
| Report Features | Description |
|---|---|
| Market Value (2025) | USD 22.3 Bn |
| Forecast Revenue (2035) | USD 38.0 Bn |
| CAGR (2026-2035) | 5.5% |
| Base Year for Estimation | 2025 |
| Historic Period | 2020-2024 |
| Forecast Period | 2026-2035 |
| Report Coverage | Revenue Forecast, Market Dynamics, Competitive Landscape, Recent Developments |
| Segments Covered | By Type (Proteins, Minerals, Vitamins, Enzymes, Other supplements), By source (Molasses, Corn, Urea, Other sources), By Livestock (Ruminants, Poultry, Swine, Aquaculture, Other livestock), By Distribution Channel (Direct sales, Distributors and retailers, Online sales) |
| Regional Analysis | North America – US, Canada; Europe – Germany, France, The UK, Spain, Italy, Rest of Europe; Asia Pacific – China, Japan, South Korea, India, Australia, Singapore, Rest of APAC; Latin America – Brazil, Mexico, Rest of Latin America; Middle East & Africa – GCC, South Africa, Rest of MEA |
| Competitive Landscape | Cargill, Incorporated, ADM, Land O’Lakes/Purina Animal Nutrition, BASF SE, Nutreco/Trouw Nutrition, Alltech, Inc., GrainCorp Limited, Westway Feed Products, Quality Liquid Feeds, Performance Feeds, Ridley Corporation, Dallas Keith, Kemin Industries, Evonik Industries, De Heus Animal Nutrition |
| Customization Scope | Customization for segments, region/country-level will be provided. Moreover, additional customization can be done based on the requirements. |
| Purchase Options | We have three licenses to opt for: Single User License, Multi-User License (Up to 5 Users), Corporate Use License (Unlimited User and Printable PDF) |





































