
Quick Navigation
Report Overview
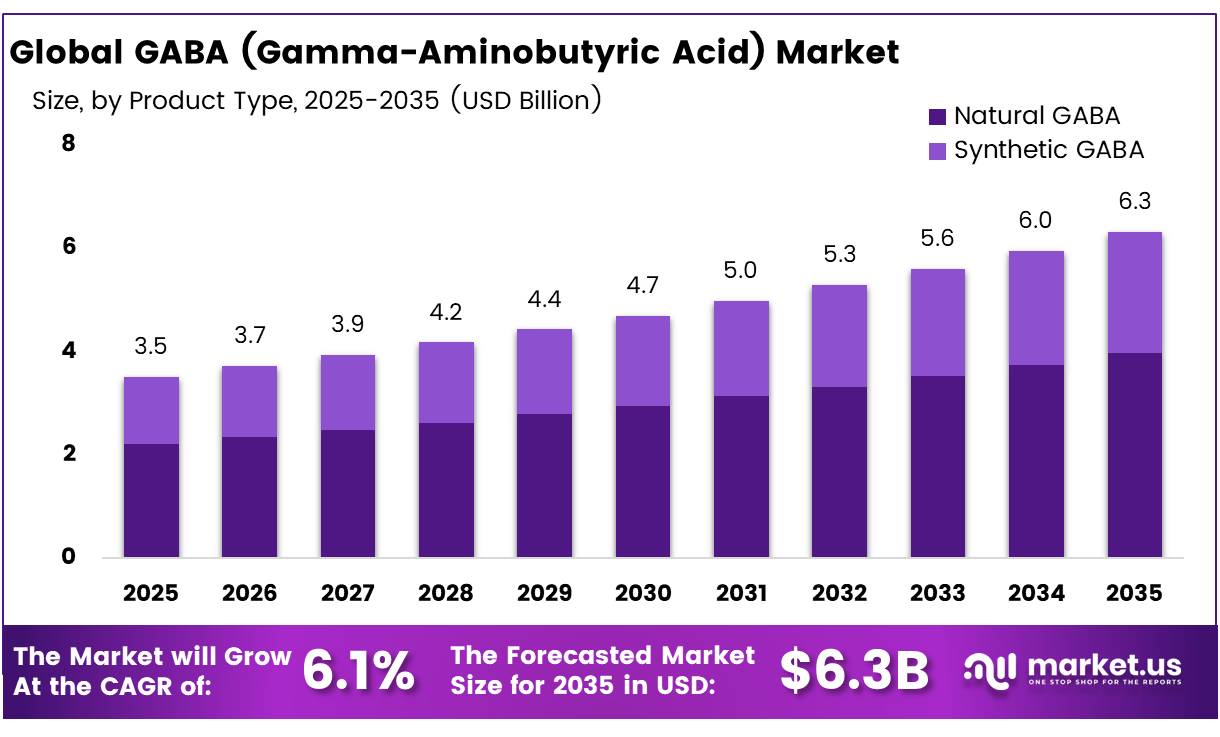
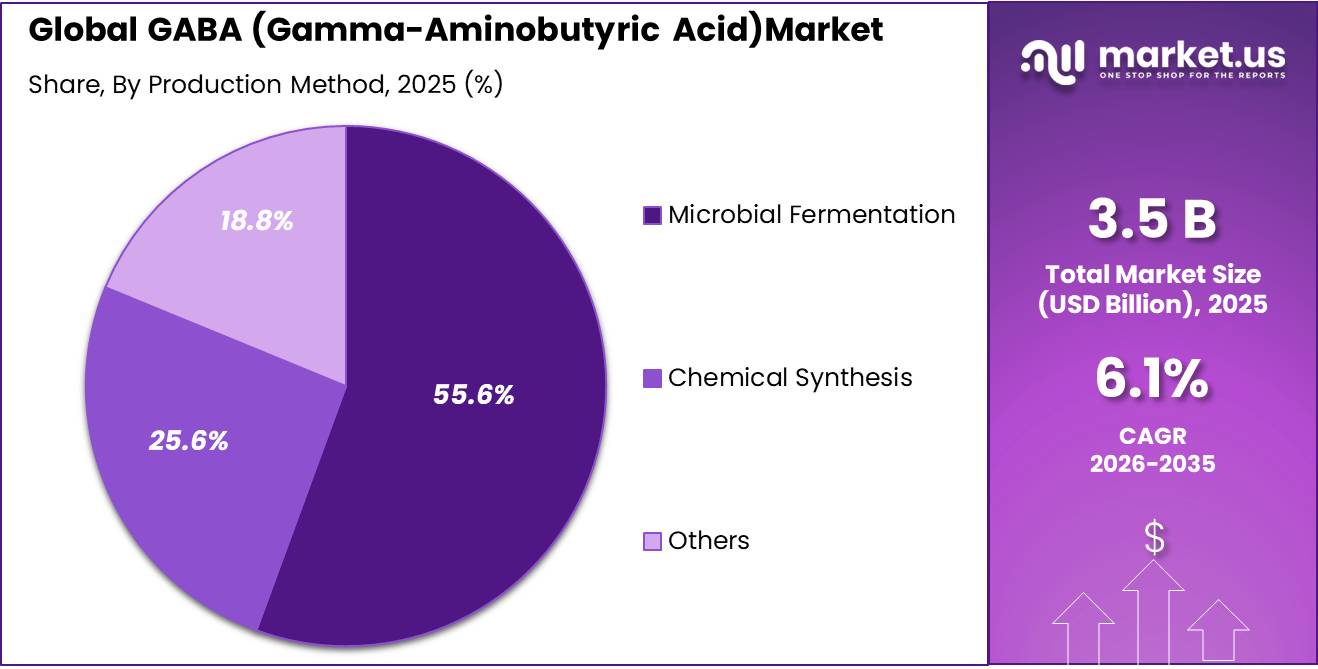
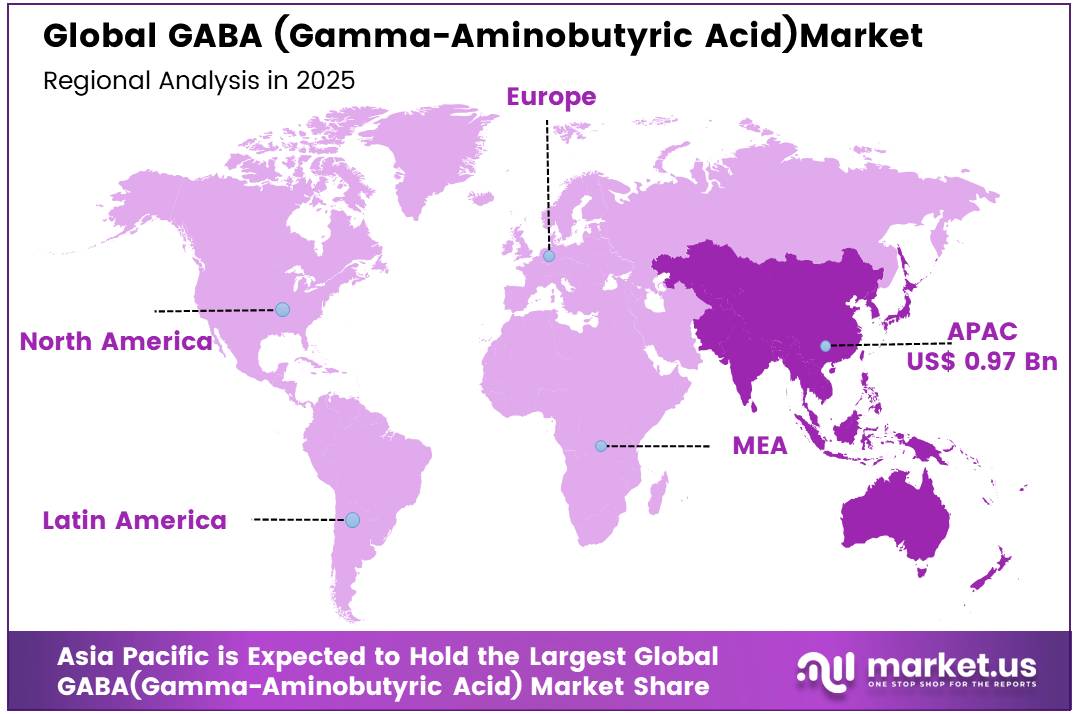
The Global Gamma-Aminobutyric Acid (GABA) Market size is anticipated to reach USD 3.5 billion by 2025, recording a CAGR of 6.1% to reach USD 6.3 billion by 2035. Asia Pacific held a dominant market position, capturing more than a 27.8% share, holding USD 0.97 billion in revenue.
Gamma-aminobutyric acid, commonly known as GABA, is a naturally occurring non-protein amino acid and the principal inhibitory neurotransmitter in the mature central nervous system. Commercial demand is centered on dietary supplements, functional beverages, fortified foods, sports nutrition, and specialized health products. Industrial suppliers produce GABA through chemical synthesis, plant enrichment, and microbial fermentation, although food-grade lactic acid bacteria are receiving greater attention because they can generate GABA directly in fermented products.
- A 2023 study demonstrated a sodium-ion-free process that accumulated 331±8.3 grams per litre after 48 hours in a 10-litre fermenter, showing the potential for more efficient food-grade production. Regulatory requirements remain important. The U.S. FDA records GABA intended-use notices covering beverages, chewing gum, ready-to-drink coffee and tea, and candy at concentrations ranging from 0.04% to 4%, although the related evaluation was discontinued at the notifier’s request.
- Demand is supported by consumer interest in sleep, relaxation, and mental-wellness products. In April 2026, the U.S. National Center for Health Statistics reported that 30.5% of adults slept less than seven hours in 2024, while 15.4% regularly experienced difficulty falling asleep and 18.1% had trouble staying asleep. WHO reported in September 2025 that anxiety disorders affected 359 million people in 2021, representing 4.4% of the global population.
Key Takeaways
- The Global GABA (gamma-Aminobutyric acid) market size was USD 3.5 billion in 2025.
- The Global GABA (gamma-Aminobutyric acid) market size is estimated to grow to USD 6.3 billion by 2035.
- The Compound Annual Growth Rate (CAGR) of the market from 2026 to 2035 will be at 6.1%.
- Natural GABA accounts for the largest market share at 62.8% of the total product type segment.
- In terms of the production method segment, Microbial Fermentation accounts for 55.6% of the total production method segment.
- For the application segment, the dominant application is Dietary Supplements accounting for 31.4% of total application revenue.
- Direct Sales account for 32.1% market share based on the distribution channel segment, thanks to bulk B2B pharmaceutical and nutraceutical purchasing agreements.
- The largest market region is the Asia Pacific region accounting for 27.8% market share of total global revenue.
Future opportunities include GABA-enriched dairy products, cereals, beverages, confectionery, fermented foods, personalized nutrition, and pharmaceutical-grade ingredients. The European Commission’s listing of a GABA novel-food application also indicates continuing regulatory and commercial interest. Growth will favor producers improving fermentation yields, stability, sensory compatibility, traceability, and clinically supported claims while meeting different regional food and supplement rules. Companies can differentiate through low-sodium processes, cleaner labels, controlled-release formats, and validated ingredient standardization.
Global GABA Market Segmentation
Product Type Analysis
Natural GABA leads due to strong demand for naturally sourced wellness ingredients.
In 2025, Natural GABA held a dominant market position, capturing more than a 62.8% share. The segment gained support from rising demand for clean-label supplements, functional foods, relaxation products, and sleep-support formulations. During December 2025, manufacturers preferred naturally derived GABA because it aligned with consumer interest in fermentation-based ingredients and minimally processed nutrition products. Its compatibility with beverages, capsules, powders, gummies, and fortified foods also widened use. Producers focused on improving purity, taste, stability, and formulation flexibility to strengthen adoption across nutraceutical and wellness applications.
Synthetic GABA remained a growing segment because it offers controlled composition, dependable quality, and scalable production. It continued to serve pharmaceutical, laboratory, and nutrition applications where precise specifications are important. Better purification systems and efficient manufacturing processes supported its use, particularly when consistency, supply reliability, and standardized performance were essential for product development.
Production Method Analysis
Microbial Fermentation dominates with 55.6% due to clean, efficient, food-grade production.
In 2025, Microbial Fermentation held a dominant market position, capturing more than a 55.6% share. The segment benefited from rising use of fermentation-derived GABA in dietary supplements, functional beverages, gummies, powders, and wellness formulations. During December 2025, producers increasingly preferred microbial processes because they support consistent quality, cleaner-label positioning, and suitability for food-grade applications. Strain improvement, controlled pH, optimized temperature, and better purification methods also helped manufacturers improve production efficiency and product stability.
Chemical Synthesis remained a growing segment because it supports large-scale output, precise composition, and dependable batch consistency. It continued to serve pharmaceutical, laboratory, and specialized nutrition applications where strict specifications are important. Improved process control and purification technology also supported wider adoption among manufacturers seeking reliable supply, standardized quality, and efficient production worldwide.
Application Analysis
Dietary Supplements lead as consumers seek convenient support for relaxation and wellness.
In 2025, Dietary Supplements held a dominant market position, capturing more than a 31.4% share. The segment benefited from growing use of GABA in capsules, tablets, powders, gummies, and blended wellness products. During December 2025, manufacturers focused on convenient formats that fit daily routines and support relaxation, sleep, stress management, and mental well-being. Strong availability through pharmacies, specialty nutrition stores, and online platforms also helped dietary supplements reach a wider consumer base.
Functional Food & Beverages remained a growing segment as brands introduced GABA into drinks, dairy products, snacks, confectionery, and other everyday foods. The segment gained attention because it combines nutritional support with familiar consumption habits. Better taste masking, formulation stability, and consumer interest in functional nutrition supported broader product development.
Distribution Channel Analysis
Direct Sales dominates with 32.1% due to strong supplier relationships and bulk purchasing demand.
In 2025, Direct Sales held a dominant market position, capturing more than a 32.1% share. The segment benefited from direct transactions between GABA producers, supplement manufacturers, pharmaceutical companies, and functional food brands. During December 2025, buyers preferred direct sourcing because it supported product traceability, customized specifications, steady supply, and closer coordination on quality requirements. Bulk purchasing also helped commercial users manage procurement costs and maintain consistent production schedules.
Pharmacies & Drug Stores remained a growing segment as consumers increasingly looked for trusted and convenient access to GABA-based wellness products. These outlets supported wider visibility for capsules, tablets, powders, and sleep-support formulations. Professional guidance, established retail networks, and stronger consumer confidence continued to encourage purchases through pharmacies and drug stores.
Key Market Segments
By Product Type
- Natural GABA
- Synthetic GABA
By Production Method
- Microbial Fermentation
- Chemical Synthesis
- Others
By Application
- Dietary Supplements
- Functional Food And Beverages
- Pharmaceuticals
- Animal Feed
- Sports Nutrition
- Cosmetics & Personal Care
- Neurological Health Products
- Stress & Sleep Management Products
- Cognitive Health Products
- Others
By Distribution Channel
- Direct Sales
- Pharmacies & Drug Stores
- Supermarkets & Hypermarkets
- Specialty Nutrition Stores
- Online Retail
- Others
Driver Analysis
Clinical safety envelope enabling broader product architecture
The USP safety review reported no serious adverse events associated with GABA at intakes up to 18 g/day for 4 days and in longer studies at 120 mg/day for 12 weeks, giving the category a usable safety envelope for mainstream low-dose product design. Combined with FDA-recognized use levels of 100 mg per serving in numerous foods, this gives formulators a practical benchmark for designing single-serve beverages, bars, and confectionery without pushing into unusually high-dose territory that would complicate tolerance messaging or consumer education.
Strategically, better-defined safety parameters expand adjacent applications multi-serve drinks, daily mood-support snacks, and stackable combination formulas because brands can model exposure per day with more confidence; this is a slower-burn driver than immediate channel expansion, but it still adds roughly +0.7 percentage points to long-term CAGR by improving insurer, retailer, and manufacturer comfort with repeated-use formats.
Drivers Impact Analysis
| Driver | (~) % Impact on CAGR | Geographic Relevance | Impact Timeline |
|---|---|---|---|
| Food-format expansion via FDA-recognized GABA ingredient uses | +1.6% | North America core, APAC transfer, selected LATAM spill-over | Short term (≤ 2 years) |
| Functional-food mainstreaming in Japan and wider APAC wellness channels | +1.3% | Japan core, South Korea/Taiwan spill-over, APAC corridors | Medium term (2-4 years) |
| Stress-sleep preventive health demand supported by NIH supplement research agenda | +1.1% | North America core, EU urban wellness markets, APAC premium retail | Short term (≤ 2 years) |
| Fermentation-led ingredient manufacturing scale-up and formulation flexibility | +1.0% | China and Japan supply base, North America import-dependent buyers, EU formulators | Medium term (2-4 years) |
| Regulatory codification of use restrictions and labeling standards | +0.8% | North America, APAC regulated food channels, EU novel-food pathway | Medium term (2-4 years) |
| Clinical safety envelope enabling broader product architecture | +0.7% | North America core, EU specialist nutrition, APAC functional beverages | Long term (≥ 4 years) |
Restraint Analysis
Fragmented food‑additive and GRAS pathways
The first major restraint is the structural fragmentation of food‑additive and GRAS‑style pathways for GABA across leading jurisdictions, which forces manufacturers to run parallel regulatory workstreams and slows down formulation pipelines; in the United States, for example, GABA is notified as “generally recognized as safe” (GRAS) for specific food uses through the FDA’s voluntary GRAS notice system (e.g., GRN 000595), yet each notice is narrowly scoped by food category and inclusion level, often requiring 6–18 months of dossier preparation and agency review for each new condition of use, with toxicology, exposure modeling, and manufacturing‑process detail aligned to 21 CFR 170.3 and 170.30.
This fragmented landscape inflates pre‑commercialization regulatory CapEx by an estimated 8–12% of total development cost for a new multi‑country GABA‑fortified portfolio, as firms must fund duplicate stability studies, reformulation work, and legal review for overlapping but non‑identical national rules, while also constraining SKU rationalization many formulators keep regional variants with 15–30% lower GABA inclusion than desired simply to stay below local uncertainty thresholds. Strategically, the result is delayed product launches by 9–18 months in secondary markets, slower penetration of mainstream food channels, and erosion of scale economies, all of which compresses operating margins by an estimated 80–120 basis points versus a counterfactual where a Codex‑level additive entry or more uniform GRAS recognition were in place, and this drag is most visible in North America, the EU, and Japan/APAC corridors where regulatory sophistication is high but mutual recognition for novel nutraceuticals remains limited.
Restraint Impact Analysis
| Restraint | (~) % Impact on CAGR | Geographic Relevance | Impact Timeline |
|---|---|---|---|
| Fragmented food-additive and GRAS pathways | -1.0% | North America, EU, Japan, selective APAC | Medium term (2–4 years) |
| Health-claim scrutiny on stress and sleep | -0.8% | EU, North America core | Medium term (2–4 years) |
| India and emerging-market nutraceutical licensing frictions | -0.7% | India, ASEAN, Middle East, LatAm | Short to Medium term (≤ 4 years) |
| Fermentation feedstock and energy cost volatility | -1.2% | APAC corridors, EU, North America | Short term (≤ 2 years) |
| Cross-border logistics and port-of-entry testing delays | -0.6% | Global, with focus on EU and India imports | Short term (≤ 2 years) |
| Pharmacovigilance and safety-monitoring overheads for higher-dose formats | -0.4% | North America, EU, developed APAC | Long term (≥ 4 years) |
Opportunity Analysis
Neurocentric functional foods 2.0
This opportunity centers on moving beyond today’s basic “relaxation drinks” and gummies toward rigorously dosed, meal‑integrated neurocentric functional foods that embed GABA into mainstream food formats under clear, compliant structure function claims, leveraging the fact that GABA has already been determined to be Generally Recognized as Safe (GRAS) as a food ingredient in the US at typical use levels of roughly 30–200 mg per serving in beverages, confectionery, and related matrices.
This is not a baseline driver because most current GABA volume sits in niche dietary supplements; the penetration of GABA into the global functional foods market valued in the hundreds of billions of dollars and growing at roughly mid‑single‑ to high‑single‑digit CAGR is still de minimis relative to the broader fortified foods segment, leaving more than 90% of potential host categories effectively untouched by clinically informed neuro‑positioning. If manufacturers systematically reformulate 1–2% of existing functional SKUs in high‑income markets to include 50–150 mg GABA per serving, with a retail price premium of 5–10% and GABA cost of goods below 5% of net sales due to economies of scale in fermentation, the addressable incremental retail layer could reach several billion dollars by 2030, supporting an estimated 2.0 percentage‑point uplift to GABA market CAGR through higher volume pull‑through into B2B ingredient contracts and expanded application diversity, while gross margins for GABA suppliers can expand by 300–500 basis points via value‑based pricing versus bulk commodity supply.
Opportunity Impact Analysis
| Opportunity | (~) % Potential CAGR | Geographic Relevance | Execution Window |
|---|---|---|---|
| Neurocentric functional foods 2.0 | +2.0% | North America, EU, urban APAC | Medium term (2–4 years) |
| Regulated clinical-grade GABA Rx & Rx-adjacent | +1.5% | North America, EU, Japan, S. Korea | Long term (≥ 4 years) |
| Mental-wellness & sleep ecosystems with GABA as core API | +1.3% | North America, EU, China, India | Medium term (2–4 years) |
| Precision GABA nutrition for ageing populations | +1.0% | EU, Japan, China, high-income LMICs | Long term (≥ 4 years) |
| Plant- and fermentation-derived GABA as clean-label input | +0.8% | EU, North America, premium APAC | Short term (≤ 2 years) |
| B2B white-label and private-brand GABA platforms | +0.7% | North America, EU, global e-commerce | Short term (≤ 2 years) |
Challenges Analysis
Fragmented functional food regulation
The GABA market operates within a mosaic of functional food and supplement regulations that differ sharply by jurisdiction, forcing manufacturers to fragment product portfolios and compliance workflows, which erodes effective global CAGR by an estimated 1.4 percentage points through duplicated development cycles, delayed launches, and regulatory hold times of 12–36 months per SKU in key markets. In Taiwan, for example, GABA used as a food ingredient must be produced via microbial fermentation with specified Lactobacillus strains, contain at least 20% GABA, and comply with a maximum intake of 100 mg per day, with new labelling provisions taking effect from 1 January 2026, while legacy batches can continue only until expiry, creating a rolling 12–24 month relabelling and reformulation window for local and imported products.
In Japan, Foods with Function Claims (FFC) and FOSHU systems require structured dossiers, clinical or systematic review evidence, and a notification or licence path that typically adds at least 6 months of pre‑commercial lead time per product and requires ongoing evidence upkeep, which acts as a structural drag on pipeline throughput for GABA-containing SKUs. Firms seeking to run pan‑regional GABA brands must therefore maintain multiple formulations, labels, and claims sets across markets such as Japan, Taiwan, and the EU, tying up regulatory affairs and legal resources and increasing per‑SKU compliance OPEX by 15–25%, while also lowering utilization of shared manufacturing lines due to small, region‑specific batches.
Over 2026–2030, strategic mitigation will require companies to standardize around the strictest overlapping specifications and embed regulatory intelligence into NPD gates, while prioritizing a “core plus localization” architecture in which 60–70% of volume comes from harmonized core formulations and only 30–40% from localized variants, progressively reducing friction drag as regulators converge and mutual recognition mechanisms expand
Challenges Impact Analysis
| Challenge | (~) % CAGR Friction Drag | Geographic Relevance | Mitigation Horizon |
|---|---|---|---|
| Fragmented functional food regulation | -1.4% | North America, EU, East Asia | Long term (≥ 4 years) |
| Safety-driven formulation constraints | -1.1% | North America, EU, Asia | Medium term (2-4 years) |
| Complex health-claims approval | -0.9% | Japan, EU, North America | Long term (≥ 4 years) |
| Bio-fermentation capacity tightness | -1.2% | Asia, North America corridors | Medium term (2-4 years) |
| Import oversight and GRAS reform risk | -0.8% | US, major exporting hubs | Medium term (2-4 years) |
| Quality, contamination and labelling risk | -1.0% | EU, East Asia, global online | Short term (≤ 2 years) |
Geopolitical Impact Analysis
Supply Chain Changes and National Production Efforts Are Reshaping the Global GABA Market
Geopolitical influence is playing a pivotal role in determining the flow of capital, logistics chains, and technologies within the international GABA market. Food and raw materials security have become a key strategic imperative since the World Health Organization declared the status of mental health to be an international public health emergency in 2024, with more than 40 countries actively working on legislation aimed at incentivizing domestic
The existing issues between US-China trade relations have been identified as 301 tariffs and 2026 Section 122 fees on Chinese fermented amino acid ingredients, leading to increased costs of purchasing for North American supplement makers and drug companies. The fact that China dominates L-glutamic acid substrate production, which is used in fermenting amino acids to create GABA, presents another problem associated with the dependency on Chinese-supplied material that Western GABA producers cannot avoid. As per the Natural Products Association report in 2025, more than 55% of sourcing executives from the supplement industry view geopolitical sourcing risks as their top priority. production of bioactive substances, including GABA precursors.
- Tariffs by the U.S. against Chinese fermentation substrates, effective until 2025, prompted localization initiatives for procurement from North American nutraceutical companies, whereas the Indian PLI policy, Japanese Strategic Innovation Program, and European Horizon funds contributed in excess of USD 500 million to establish alternatives to fermentation substrates of GABA and amino acids in Asia and Europe, thereby partly addressing supply concentration problems of the Chinese through 2035.
Regional Analysis
Asia Pacific Dominates the Global GABA Market Through Strong Fermentation Manufacturing Infrastructure
In 2025, Asia Pacific held a dominant position in the GABA market, accounting for 27.8% of global revenue and generating US$0.97 billion. Regional demand was supported by nutraceutical manufacturing, expanding functional food categories, and consumer interest in stress, sleep, cognitive health, and healthy ageing products. Japan remained important because its Foods with Function Claims system recognizes GABA-related functions and provides a route for product notifications. By March 2025, Japan’s database contained 9,367 notified functional food products, including 5,074 supplement-format products, highlighting the scale of its wellness sector.
Asia Pacific also contained 516 million people aged 65 years or above in 2025, equal to 10.8% of the regional population. These conditions encouraged use of GABA in beverages, capsules, gummies, dairy products, and fortified foods. Future growth is expected from fermentation-based production, cleaner-label formulations, stronger clinical support, and wider retail and online distribution across Japan, China, South Korea, Australia, and Southeast Asia.
Key Regions and Countries Covered
North America
- The US
- Canada
Europe
- Germany
- France
- The UK
- Spain
- Italy
- Russia & CIS
- Rest of Europe
APAC
- China
- Japan
- South Korea
- India
- ASEAN
- Rest of APAC
Latin America
- Brazil
- Mexico
- Rest of Latin America
Middle East & Africa
- GCC
- South Africa
- Rest of MEA
Key Players Analysis
Competitive advantage in the international GABA market for suppliers is gained through differentiation in fermentation technology, pharmaceutical-grade quality, and integration in distribution channels. Main areas of focus for the suppliers will be in developing PharmaGABA formulations, optimizing Lactobacillus strains, and engaging in research partnerships because of the increased premiums and quick adoption of evidence-based GABA formulation in controlled markets internationally.
Vertical integration in the procurement of fermentation substrates from suppliers of L-glutamic acid as well as contract manufacturing companies ensures stable procurement of the raw materials despite their fluctuating prices. Building capacity in Asia Pacific aligns with high demand from hospitals, dietary supplement manufacturers, and online distribution channels. The strategy of pursuing GMP certification and pharmacopoeia standardization of product quality enhances large-scale operations and ensures predictable revenues from pharmaceutical clients and nutraceutical retailers to 2035.
Market Key Players
- Pharma Foods International
- Kyowa Hakko Bio
- Shanghai Freemen Biotechnology
- Anhui Sinobiotek
- Zhejiang Yiwan Biotech
- Bloomage Biotech
- Tianjin Zhen-Ao Group
- Yamasa Corporation
- Evonik Industries
- Lonza Group
- ADM (Archer Daniels Midland)
- NutraScience Labs
- CSPC Pharmaceutical Group
- Daesang Corporation
- Shandong Luwei Pharmaceutical
- Other Key Players
Key Development
- In January 2026, Kyowa Hakko Bio Co. Ltd. launched Pharma GABA 3.0 with enhanced bioavailability certification targeting premium U.S. and EU nutraceutical markets. The upgraded formulation incorporates proprietary absorption enhancement technology delivering improved plasma GABA concentration levels. The launch reinforces Kyowa Hakko Bio’s leadership position in certified natural-origin GABA ingredient supply globally.
- In February 2026, Lonza Group AG expanded GMP-certified GABA fermentation production capacity at its Visp, Switzerland facility, strengthening pharmaceutical-grade API supply for European regulated market buyers. The expansion directly responds to growing demand from European pharmaceutical manufacturers seeking GMP-certified GABA sources with full EU regulatory traceability documentation.
- In March 2026, Evonik Industries AG announced a strategic partnership with a leading South Korean nutraceutical manufacturer to co-develop next-generation enzymatic GABA formulations targeting cognitive health applications. The collaboration targets commercialization of the first jointly developed product across South Korean, Japanese, and European premium supplement retail channels by Q1 2027.
Report Scope
| Report Features | Description |
|---|---|
| Market Value (2025) | USD 3.5 Bn |
| Forecast Revenue (2035) | USD 6.3 Bn |
| CAGR (2026-2035) | 6.1% |
| Base Year for Estimation | 2025 |
| Historic Period | 2020-2024 |
| Forecast Period | 2026-2035 |
| Report Coverage | Revenue Forecast, Market Dynamics, Competitive Landscape, Recent Developments |
| Segments Covered | By Product Type (Natural GABA, Synthetic GABA), By Production Method (Microbial Fermentation, Chemical Synthesis, Others), By Application (Dietary Supplements, Functional Food & Beverages, Pharmaceuticals, Animal Feed, Sports Nutrition, Cosmetics & Personal Care, Neurological Health Products, Stress & Sleep Management Products, Cognitive Health Products, Others), By Distribution Channel (Direct Sales, Pharmacies & Drug Stores, Supermarkets & Hypermarkets, Specialty Nutrition Stores, Others) |
| Regional Analysis | North America – US, Canada; Europe – Germany, France, The UK, Spain, Italy, Rest of Europe; Asia Pacific – China, Japan, South Korea, India, Australia, Singapore, Rest of APAC; Latin America – Brazil, Mexico, Rest of Latin America; Middle East & Africa – South Africa, Saudi Arabia, UAE, Rest of MEA |
| Competitive Landscape | Pharma Foods International, Kyowa Hakko Bio, Shanghai Freemen Biotechnology, Anhui Sinobiotek, Zhejiang Yiwan Biotech, Bloomage Biotech, Tianjin Zhen-Ao Group, Yamasa Corporation, Evonik Industries, Lonza Group, ADM (Archer Daniels Midland), NutraScience Labs, CSPC Pharmaceutical Group, Daesang Corporation, Shandong Luwei Pharmaceutical, Other Key Players |
| Customization Scope | Customization for segments, region/country-level will be provided. Moreover, additional customization can be done based on the requirements. |
| Purchase Options | We have three licenses to opt for: Single User License, Multi-User License (Up to 5 Users), Corporate Use License (Unlimited Users and Printable PDF) |
 Market")


