


Quick Navigation
Report Overview
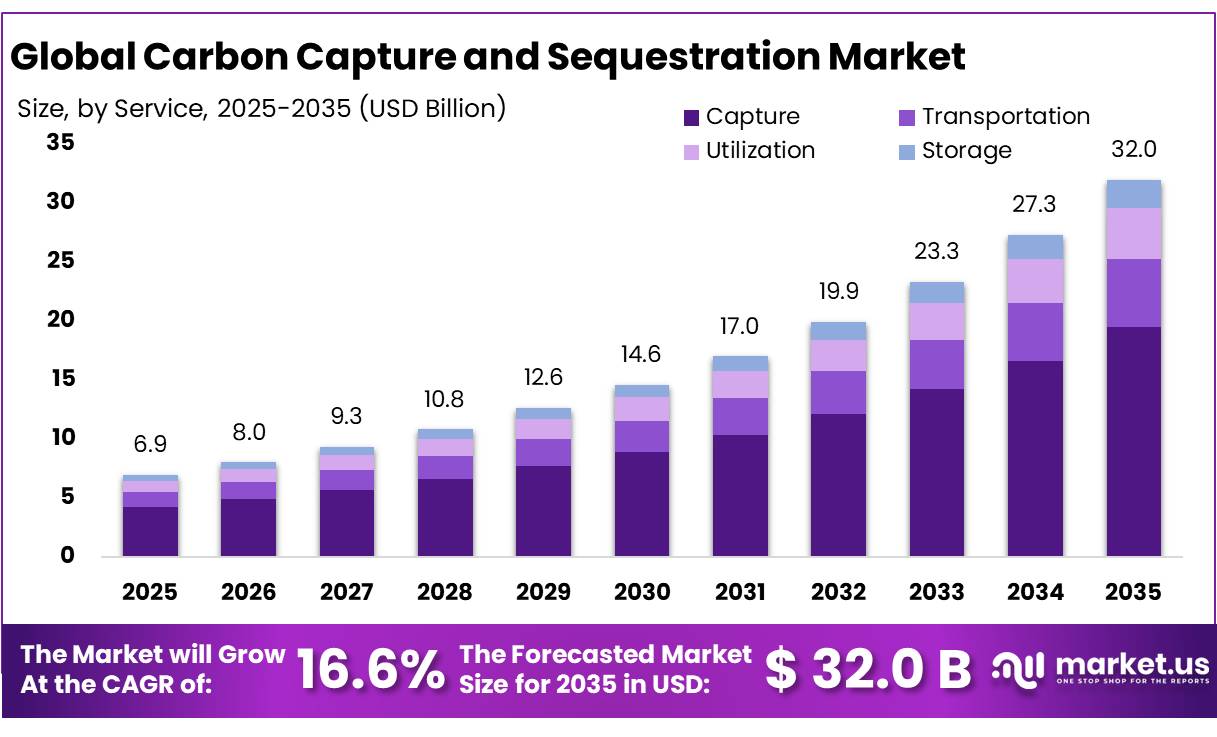
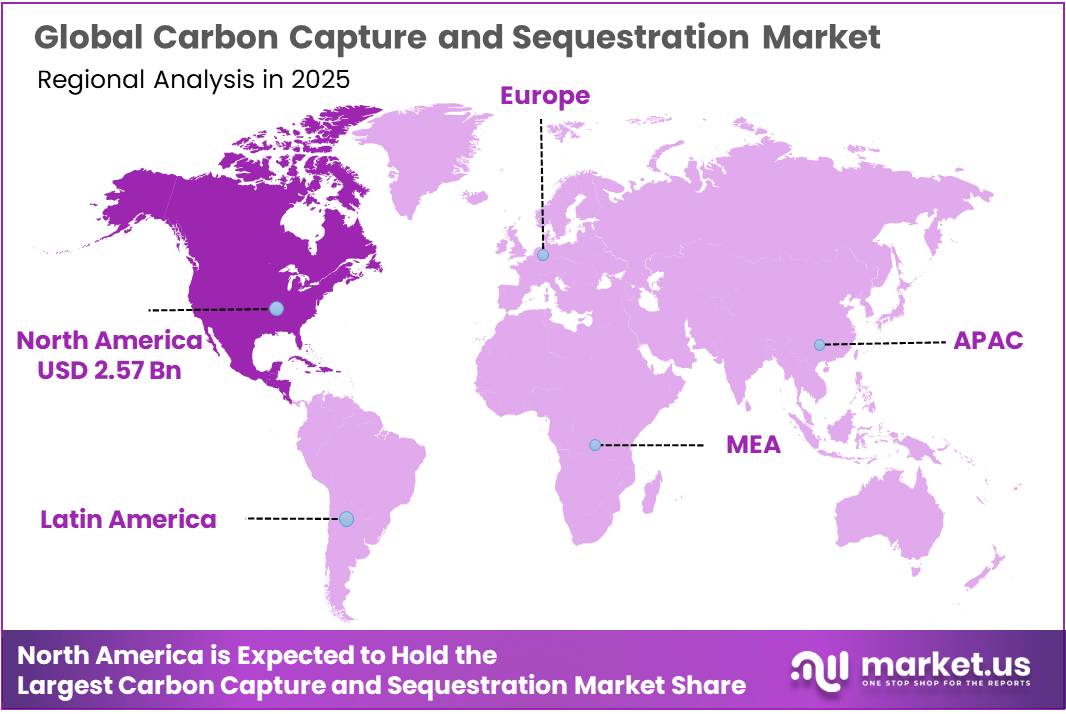
In 2025, the Global Carbon Capture and Sequestration Market was valued at USD 6.9 billion, and between 2026 and 2035, this market is estimated to register a CAGR of 16.6%, reaching about USD 32.0 billion by 2035. North America held a dominant market position, capturing more than a 37.00% share, holding USD 2.57 billion in revenue.
Carbon capture and sequestration (CCS) is becoming an important industrial decarbonization route for sectors where process emissions are difficult to remove through electrification alone. The technology captures carbon dioxide from industrial plants, transports it by pipeline or ship, and injects it into geological formations for permanent storage.
- The Global CCS Institute reported that 77 CCS projects were operating, 47 were under construction, and 610 were in development in 2025, while combined operating and development capture capacity reached 513 million tonnes per year, up 23%.
Key Takeaways
- Carbon Capture and Sequestration Market was valued at USD 6.9 billion, to register a CAGR of 16.6%, reaching about USD 32.0 billion by 2035.
- Capture held a dominant market position, capturing more than a 61.00% share.
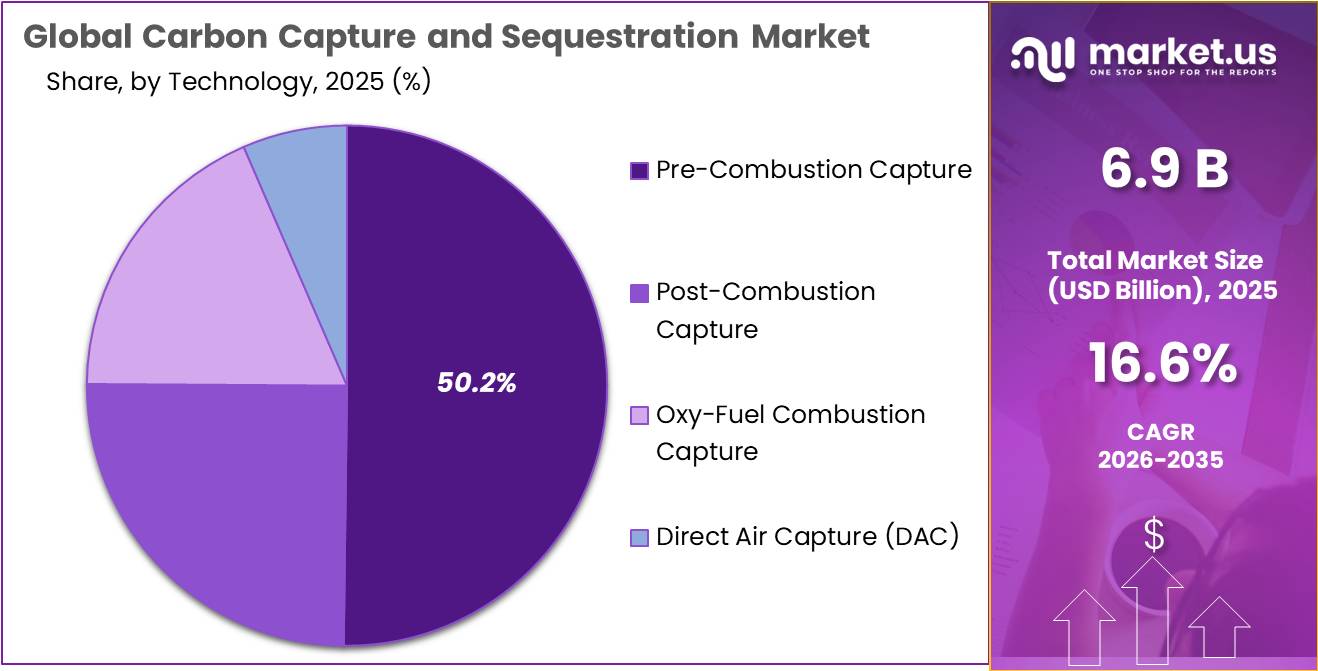
- Pre-Combustion Capture held a dominant market position, capturing more than a 50.00% share.
- Oil and Gas held a dominant market position, capturing more than a 42.00% share.
- North America held a dominant position in the Carbon Capture and Sequestration Market, accounting for more than a 37.00% share and generating about USD 2.57 billion.
Investment is becoming more commercial as projects move beyond pilot stages. The IEA reported that more than 30 final investment decisions were reached during the previous two years, while annual CCUS investment increased more than 15-fold from 2020 to over USD 5 billion in 2025. This indicates stronger financial confidence in projects combining capture facilities with shared pipelines, terminals and geological storage hubs.
- Government support remains a major driving factor. The European Union has established a target of at least 50 million tonnes of annual CO₂ injection capacity by 2030, with obligations covering 44 oil and gas producers. The UK government allocated £9.4 billion in capital budgets for CCUS, while the U.S. Department of Energy announced USD 101 million for five carbon capture, removal and conversion test-center projects in January 2025.
Air Liquide and Holcim announced a Belgian project in February 2026 targeting 1.1 million tonnes of CO₂ capture per year. Improvements in solvents, heat integration, compression, monitoring and shared infrastructure could reduce costs and support wider adoption. However, high capital requirements, energy consumption, complex permitting and long development cycles remain key barriers, making stable policy frameworks and bankable transport-and-storage contracts central to future CCS expansion.
By Service Analysis
Capture dominates with a 61.00% share as industrial facilities increase large-scale CO₂ removal
In 2025, Capture held a dominant market position, capturing more than a 61.00% share. The segment remains important because carbon must first be separated from cement, waste-to-energy, power, refining, and other industrial emission streams before transportation and permanent storage can take place.
- In September 2025, the UK Department for Energy Security and Net Zero confirmed that the Padeswood cement and Protos waste-to-energy projects are designed to remove 1.2 million tonnes of CO₂ annually. Of this capacity, Padeswood is expected to capture around 800,000 tonnes per year, while Protos is expected to capture about 400,000 tonnes per year.
Transportation is an essential part of the Carbon Capture and Sequestration Market because captured CO₂ must be moved safely from industrial facilities to suitable underground storage locations. In October 2025, the European Climate, Infrastructure and Environment Executive Agency reported that grant agreements were signed for 10 CO₂ infrastructure projects with around EUR 240 million in EU investment.
By Technology Analysis
Pre-Combustion Capture leads with a 50.00% share as high-pressure CO₂ separation supports efficient capture
In 2025, Pre-Combustion Capture held a dominant market position, capturing more than a 50.00% share. The technology remains widely suited to hydrogen production, gasification, and other industrial processes where carbon can be separated before the fuel is burned. Its advantage comes from handling a concentrated and pressurized CO₂ stream, which makes separation easier than treating dilute exhaust gases.
- In 2026, the UK Environment Agency stated that facilities using pre-combustion carbon capture must be designed to reduce overall CO₂ emissions associated with power generation by at least 90%. The same government guidance also requires operators to assess thermal integration, utility needs, plant efficiency, and the capability to operate with hydrogen-rich fuel.
Post-Combustion Capture remains a key technology in the Carbon Capture and Sequestration Market, particularly for existing power stations and industrial facilities where changing the primary production process is difficult. It removes CO₂ from flue gases after fuel combustion, generally using solvents or other separation systems before the concentrated CO₂ stream is prepared for transport and storage. In its 2025 National Policy Statement for Energy, the UK government identified post-combustion capture as one of the main CCS technology routes and highlighted its use for removing CO₂ directly from combustion exhaust gases.
By End-Use Industry Analysis
Oil and Gas dominates with a 42.00% share as producers expand CO₂ storage capabilities
In 2025, Oil and Gas held a dominant market position, capturing more than a 42.00% share. The sector remains closely connected with carbon capture and sequestration because oil and gas companies already have experience in subsurface geology, drilling, reservoirs, pipelines, and offshore infrastructure.
- In 2025, the European Commission identified 44 oil and gas producers that are required to contribute toward developing CO₂ storage capacity in Europe. These producers are collectively linked to an EU objective of at least 50 million tonnes of annual CO₂ injection capacity.
Power Generation is developing as an important end-use industry for carbon capture and sequestration as utilities look for ways to lower emissions from dispatchable fossil-fuel generation. In 2025, the Tees Valley Combined Authority reported that the Net Zero Teesside Power project is being developed to supply up to 740 megawatts of low-carbon flexible power. The facility is designed to capture up to 2 million tonnes of CO₂ per year and provide enough electricity for more than 1 million homes annually.
Key Market Segments
By Service
- Capture
- Transportation
- Utilization
- Storage
By Technology
- Pre-Combustion Capture
- Post-Combustion Capture
- Oxy-Fuel Combustion Capture
- Direct Air Capture (DAC)
By End-Use Industry
- Power Generation
- Oil and Gas
- Iron and Steel
- Chemical and Petrochemical
- Cement
- Pulp and Paper
- Others
Driver Analysis
Fiscal incentives and compliance mandates
The strongest near-term demand catalyst is the conversion of CCS from a discretionary decarbonisation expenditure into an incentive-backed compliance investment. In the United States, the enhanced Section 45Q framework provides up to $85/tCO₂ for industrial or power-source CO₂ placed in secure geological storage, $60/tCO₂ for utilisation or enhanced oil recovery, and up to $180/tCO₂ for direct-air-capture storage; for projects with relatively concentrated streams, these credits can materially cover capture, compression, transport, and storage costs and improve debt-service visibility.
In Europe, the Net-Zero Industry Act sets a binding target of at least 50 Mt/year of CO₂ injection capacity by 2030, while the Commission assigned 44 oil and gas producers obligations to contribute storage capacity by 31 December 2030.
The UK has additionally committed up to £21.7 billion over 25 years to its first two CCUS clusters, with projects in the East Coast Cluster expected to become operational from 2028. Commercially, this shifts suppliers toward long-duration, availability-linked contracts: capture-equipment providers can sell engineered systems with performance guarantees, while transport-and-storage operators secure regulated or contracted capacity revenues rather than relying solely on volatile voluntary-carbon-credit demand.
Drivers Impact Analysis
| Driver | (~) % Impact on CAGR | Geographic Relevance | Impact Timeline |
|---|---|---|---|
| Fiscal incentives and compliance mandates | +2.6 pp | North America core, EU, UK | Short term (≤2 years) |
| CO₂ hubs, pipelines and storage build-out | +2.1 pp | U.S. Gulf Coast/Midwest, North Sea, APAC corridors | Medium term (2–4 years) |
| Hard-to-abate industry decarbonisation | +1.8 pp | EU, China, India, North America, Middle East | Medium term (2–4 years) |
| Capture-cost reduction and modular technology | +1.5 pp | Global; early uptake in NA, EU, China | Medium term (2–4 years) |
| Carbon removals and DAC offtake markets | +1.1 pp | North America, Nordics, Middle East, Australia | Long term (≥4 years) |
| Trade-linked carbon exposure and CBAM | +0.9 pp | EU-linked exporters, Asia, MENA, Türkiye | Short term (≤2 years) |
Restraint Analysis
High capture cost
High capture cost remains the largest restraint because it converts decarbonisation from a compliance decision into a plant-level margin and capital-allocation problem: capture from high-purity streams such as natural-gas processing or ethanol can cost approximately $15–25/tCO₂, but dilute streams—typically 3–14% CO₂ in power-plant flue gas and 20–27% in blast-furnace gas—frequently exceed $40/tCO₂ and can surpass $100/tCO₂, with capture accounting for roughly 75% of total CCUS system cost.
Adding pipeline transport at about $2–14/tCO₂ in favourable U.S. onshore cases and storage, for which more than half of U.S. onshore potential is estimated below $10/tCO₂, does not solve the central problem: a cement, steel, refinery, or waste-to-energy operator must fund a large retrofit, absorb steam and electricity consumption, accommodate shutdown risk, and maintain capture availability over 15–25 years.
Restraint Impact Analysis
| Restraint | (~) % Impact on CAGR | Geographic Relevance | Impact Timeline |
|---|---|---|---|
| High capture cost | -2.4 pp | Global; cement, steel, power | Short term (≤2 years) |
| Storage-permit delays | -1.9 pp | U.S., EU, UK, Australia | Medium term (2–4 years) |
| CO₂ network gaps | -1.7 pp | EU, APAC, inland North America | Medium term (2–4 years) |
| Revenue-policy uncertainty | -1.5 pp | North America, EU, APAC | Short term (≤2 years) |
| FID coordination failure | -1.3 pp | Global cluster markets | Medium term (2–4 years) |
| Liability and social resistance | -0.9 pp | EU, U.S. states, APAC | Long term (≥4 years) |
Opportunity Analysis
CO₂-to-value monetization (utilization products)
Unlike the driver-side incentive economics that reward simple sequestration, converting captured CO₂ into synthetic fuels, mineralized aggregates, polymers, or concrete-curing inputs represents an untapped revenue layer because today’s project economics almost entirely monetize storage credits rather than the carbon molecule itself; concrete-curing utilization can lock roughly 200–400 kg of CO₂ per cubic meter of treated product while simultaneously cutting cement clinker content by an estimated 5–8%, creating a dual revenue and cost-avoidance stream that no current 45Q or CBAM structure captures.
This is a genuine white space rather than a driver extension because utilization pathways require entirely new customer relationships construction material buyers, synthetic aviation-fuel offtakers, chemical intermediates markets rather than regulatory compliance buyers, shifting the unit economics from a pure $/tonne storage fee toward a blended model where captured CO₂ can command $80–150/tonne in high-value polymer or fuel precursor applications versus $20–50/tonne in commodity storage tariffs.
Early movers that vertically integrate capture with a utilization off-taker can achieve 300–500 basis points of gross margin expansion relative to storage-only peers, but the opportunity remains largely uncapitalized because most current capture capacity is contractually locked into geological sequestration rather than flexible dual-pathway agreements.
Opportunity Impact Analysis
| Opportunity | (~) % Potential CAGR | Geographic Relevance | Execution Window |
|---|---|---|---|
| CO₂-to-value monetization (utilization products) | +2.2 pp | APAC, Middle East, EU, North America | Medium term (2–4 years) |
| Storage-as-a-service platform model | +1.8 pp | U.S. Gulf Coast, North Sea, Australia | Medium term (2–4 years) |
| SME/mid-market emitter aggregation via mobile capture | +1.4 pp | EU, APAC industrial clusters, Latin America | Long term (≥4 years) |
| M&A roll-up of fragmented pore-space and pipeline assets | +1.6 pp | North America core, EU | Short term (≤2 years) |
| Blue hydrogen and ammonia co-location bundling | +1.3 pp | Middle East, APAC, U.S. Gulf Coast | Medium term (2–4 years) |
| Voluntary carbon-removal certificate arbitrage | +0.9 pp | North America, Nordics, Singapore-linked trading hubs | Long term (≥4 years) |
Challenges Analysis
Cross-Chain Commissioning Mismatch
CCS projects increasingly fail to realize planned ramp-up schedules not because capture, pipeline, or storage assets are individually unavailable, but because each reaches commercial readiness on a different timetable: an industrial capture retrofit may require a 24–36-month engineering and construction cycle, pipeline and compression systems commonly require 30–48 months including rights-of-way and interconnection work, while storage appraisal, injection-well drilling, baseline monitoring, and operating approval can extend beyond 4 years; therefore, a 6–18-month timing variance can leave a completed capture train operating below 50% utilization or force CO₂ venting until the downstream chain is ready.
The risk is amplified by the industry’s rapid project expansion 77 CCS projects were operating and 47 were under construction by 2025, while another 610 remained in development—because multiple developers are simultaneously competing for the same engineering, drilling, compression, and transport interfaces. In a 2026 integrated-project risk model, a one-year underutilization period on a 1 Mtpa capture asset can defer 0.7–0.9 Mt of contracted storage throughput and impair early-project cash generation by roughly 15–25%, depending on tariff and incentive structure.
Mitigation requires integrated master schedules, take-or-pay capacity reservations, phased commissioning at 20–40% of nameplate volume, common CO₂-quality specifications, and contractual liquidated-damages provisions that allocate delay risk across capture, transport, and storage parties rather than concentrating it with the emitter.
Challenges Impact Analysis
| Challenge | (~) % CAGR Friction | Geographic Relevance | Mitigation Horizon |
|---|---|---|---|
| Cross-chain commissioning mismatch | -1.6 pp | North America, EU, APAC hubs | Medium term (2–4 years) |
| Specialist workforce scarcity | -1.3 pp | U.S., EU, Australia, Middle East | Long term (≥4 years) |
| Equipment delivery volatility | -1.1 pp | North America, EU, APAC | Medium term (2–4 years) |
| Capture performance degradation | -1.0 pp | Global industrial sites | Medium term (2–4 years) |
| Storage characterization uncertainty | -1.2 pp | U.S., North Sea, APAC, Australia | Long term (≥4 years) |
| MRV data interoperability gaps | -0.8 pp | EU, North America, cross-border APAC | Medium term (2–4 years) |
Geopolitical Impact Analysis
Russia’s ongoing war against Ukraine continues to reshape the Carbon Capture and Sequestration market by pushing energy security and industrial decarbonization closer together. Europe has reduced Russian gas exposure sharply, but the transition requires new LNG terminals, pipelines, storage assets, and alternative fuel supplies.
- In 2025, Russian gas still represented about 13% of EU gas imports and was worth more than €15 billion, showing that energy-security risks remain material. These pressures can delay some capital-intensive CCS projects when governments and companies prioritize immediate energy supply, defense spending, and fuel affordability.
At the same time, the conflict is strengthening the case for CCS around domestic gas, hydrogen, cement, refining, and industrial clusters. The EU continues to target at least 50 million tonnes of annual CO₂ injection capacity by 2030, indicating that decarbonization policy has not been abandoned despite geopolitical tension. The UK also allocated £9.4 billion in capital budgets for CCUS in its 2025 Spending Review, supporting major storage clusters.
The overall impact is therefore mixed. War-related cost inflation, shipping risks, higher financing costs, and supply-chain uncertainty can slow project execution, while stronger energy independence policies create fresh demand for CCS infrastructure linked with domestic industrial production and lower-carbon fuel systems.
Regional Insights
North America Leads with 37.00% Share and USD 2.57 Billion
In 2025, North America held a dominant position in the Carbon Capture and Sequestration Market, accounting for more than a 37.00% share and generating about USD 2.57 billion. Strong geological storage resources, established oil and gas infrastructure, and government incentives continue to support regional deployment.
- In January 2025, the U.S. Department of Energy announced USD 101 million for five projects developing carbon capture, removal, and conversion test centers. Canada also supports CCS investment through refundable tax credits covering 50% of eligible capture equipment costs and 37.5% of eligible transportation and storage equipment costs, strengthening project economics.
Europe is emerging as the fastest-growing regional market as governments develop shared CO₂ transport networks and offshore storage hubs. In 2026, the European Commission confirmed an EU objective of at least 50 million tonnes of annual CO₂ injection capacity by 2030. The region already had 3 permitted storage sites, while another 7 sites were moving through permitting, showing rapid development of commercial storage infrastructure. The UK is adding further momentum, with the government allocating £9.4 billion in capital budgets for CCUS development, particularly around the East Coast and HyNet industrial clusters.
Asia Pacific is also developing a sizeable CCS pipeline, supported by government-backed industrial decarbonization programs. Japan’s 2025 Energy White Paper confirmed continued support for 9 advanced CCS projects targeting commercial operation around 2030. These projects are designed around an aggregate storage ambition of approximately 20 million tonnes of CO₂ annually, with 5 projects focused on domestic storage and 4 involving Asia-Pacific storage locations outside Japan.
Key Regions and Countries Insights
- North America
- US
- Canada
- Europe
- Germany
- France
- The UK
- Spain
- Italy
- Rest of Europe
- Asia Pacific
- China
- Japan
- South Korea
- India
- Australia
- Rest of APAC
- Latin America
- Brazil
- Mexico
- Rest of Latin America
- Middle East & Africa
- GCC
- South Africa
- Rest of MEA
Key Players Analysis
Equinor ASA is strengthening its CCS position through Northern Lights, operated technically by Equinor with Shell and TotalEnergies. In August 2025, the project began storing CO₂ about 2,600 metres below the seabed. Phase 1 provides 1.5 million tonnes of annual capacity, while the NOK 7.5 billion Phase 2 investment will raise capacity to at least 5 million tonnes per year. Equinor also targets 30–50 million tonnes of annual CO₂ transport and storage capacity by 2035 across its portfolio globally today.
Exxon Mobil Corporation is expanding CCS as a commercial low-carbon business along the U.S. Gulf Coast. By 2026, the company had agreements covering about 9 million metric tonnes of CO₂ annually with third-party customers. Its CF Industries project began transporting and storing CO₂ in July 2025, covering up to 2.5 million tonnes per year. Other contracts include about 2.2 million tonnes annually from Linde and 1.2 million tonnes from New Generation Gas Gathering, broadening ExxonMobil’s industrial CCS customer base further.
Shell plc is advancing CCS through Northern Lights, its joint venture with Equinor and TotalEnergies. The project started CO₂ injection in August 2025 after transporting emissions roughly 450 kilometres from a cement plant. Phase 1 offers 1.5 million tonnes of annual transport and storage capacity. The planned expansion will lift capacity to at least 5 million tonnes per year by 2028, while Stockholm Exergi has contracted for up to 900,000 tonnes annually, strengthening Shell’s position in Europe’s shared CCS infrastructure.
Top Key Players Outlook
- Equinor ASA
- Exxon Mobil Corporation
- Shell plc
- Chevron Corporation
- TotalEnergies SE
- Fluor Corporation
- Mitsubishi Heavy Industries, Ltd.
- Linde plc
- Aker Solutions / Aker Carbon Capture
- SLB (Schlumberger)
- Air Liquide S.A.
- Baker Hughes Company
- Honeywell UOP
- Technip Energies N.V.
- Siemens Energy AG
Recent Developments
- In July 2026, MHI Group and Entergy signed an MOU aimed at developing an integrated power and CCS roadmap with a target of reducing overall costs by 50%.
- In March 2026, TotalEnergies reported operated Scope 1 and 2 emissions of 33.1 million tonnes in 2025, compared with 46 million tonnes in 2015, reinforcing its wider focus on lower-emission operations alongside CCS development.
- In June 2026, Linde reported that its technologies helped customers avoid approximately 98 million metric tonnes of CO₂-equivalent emissions during 2025, while company sales reached USD 34 billion.
- In July 2026, Baker Hughes completed its USD 13.6 billion acquisition of Chart Industries, adding capabilities across carbon capture and storage, gas handling, and thermal-management markets; the combination targets USD 325 million in annualized cost synergies within 3 years.
Report Scope
| Report Features | Description |
|---|---|
| Market Value (2025) | USD 6.9 Bn |
| Forecast Revenue (2035) | USD 32.0 Bn |
| CAGR (2026-2035) | 16.6% |
| Base Year for Estimation | 2025 |
| Historic Period | 2020-2024 |
| Forecast Period | 2026-2035 |
| Report Coverage | Revenue Forecast, Market Dynamics, Competitive Landscape, Recent Developments |
| Segments Covered | By Service (Capture, Transportation, Utilization, Storage), By Technology (Pre-Combustion Capture, Post-Combustion Capture, Oxy-Fuel Combustion Capture, Direct Air Capture (DAC)), By End-Use Industry (Power Generation, Oil and Gas, Iron and Steel, Chemical and Petrochemical, Cement, Pulp and Paper, Others) |
| Regional Analysis | North America – US, Canada; Europe – Germany, France, The UK, Spain, Italy, Rest of Europe; Asia Pacific – China, Japan, South Korea, India, Australia, Singapore, Rest of APAC; Latin America – Brazil, Mexico, Rest of Latin America; Middle East & Africa – GCC, South Africa, Rest of MEA |
| Competitive Landscape | Equinor ASA, Exxon Mobil Corporation, Shell plc, Chevron Corporation, TotalEnergies SE, Fluor Corporation, Mitsubishi Heavy Industries, Ltd., Linde plc, Aker Solutions / Aker Carbon Capture, SLB (Schlumberger), Air Liquide S.A., Baker Hughes Company, Honeywell UOP, Technip Energies N.V., Siemens Energy AG |
| Customization Scope | Customization for segments, region/country-level will be provided. Moreover, additional customization can be done based on the requirements. |
| Purchase Options | We have three licenses to opt for: Single User License, Multi-User License (Up to 5 Users), Corporate Use License (Unlimited User and Printable PDF) |





































