


Report Overview
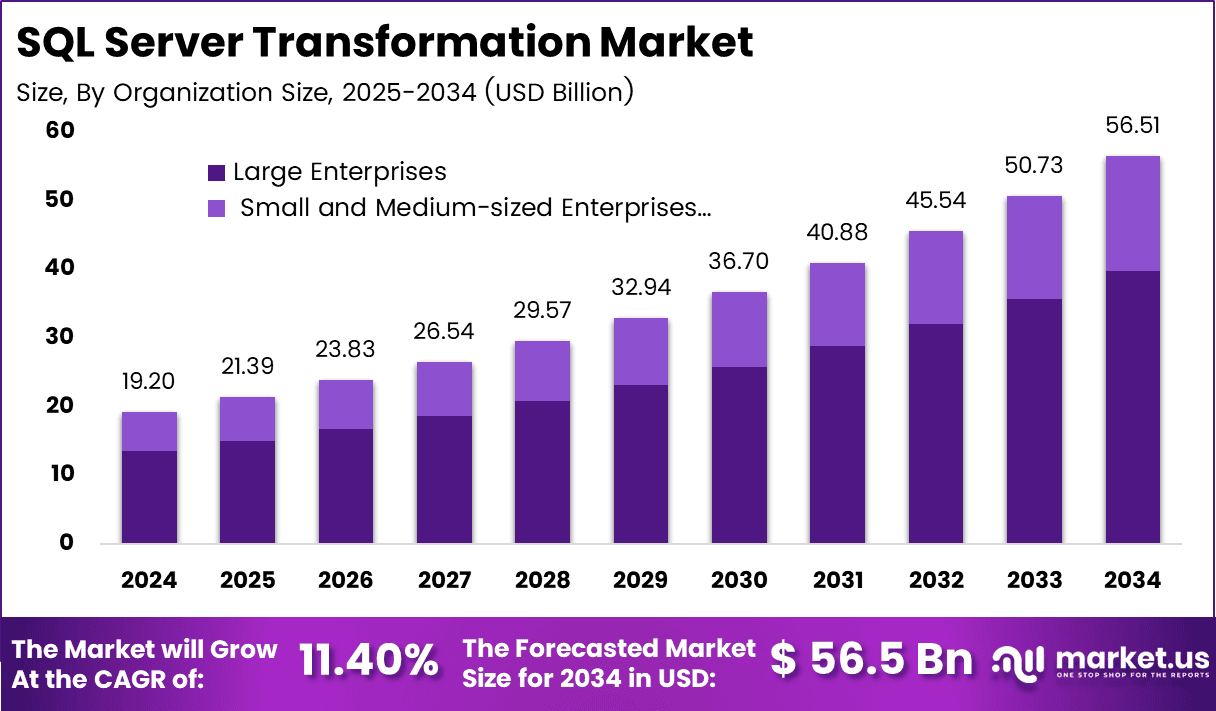
The Global SQL Server Transformation Market stood at USD 19.2 billion in 2024 and will reach USD 56.5 billion by 2034, growing at a 11.4% CAGR over the 2025 to 2034 forecast period. North America controls 45.3% of global revenue and generates USD 8.7 billion. Growth follows the shift of relational database workloads to cloud and AI platforms.
The WTO reported that trade in AI-related goods, covering semiconductors, servers and telecom equipment, rose more than 20% year on year to USD 1.92 trillion in the first half of 2025 and drove almost half of all merchandise trade growth. That hardware build-out creates software work behind it.
Microsoft’s annual report shows Azure passed USD 75 billion in revenue in fiscal 2025, up 34%, while Oracle’s fiscal 2025 results place cloud services and license support at USD 44.0 billion, up 12%. Every workload that moves forces teams to rewrite T-SQL queries, port integration scripts, and retune reporting layers, so transformation spending climbs with each migration.
The US Department of Commerce, citing the Bureau of Economic Analysis, reports the digital economy added nearly USD 2.6 trillion in value to the US economy, and BEA-based analysis places the digital economy at 10.3% of nominal GDP. ITU data shows 88% of people in the Americas use the internet, among the highest rates worldwide.
Key Takeaways
- The SQL Server Transformation Market reached USD 19.2 billion in 2024 and will hit USD 56.5 billion by 2034. Revenue will expand at a 11.4% CAGR between 2025 and 2034.
- Information Retrieval leads the type segment with a 40.3% share.
- Large Enterprises lead the organization size segment with a 70.4% share.
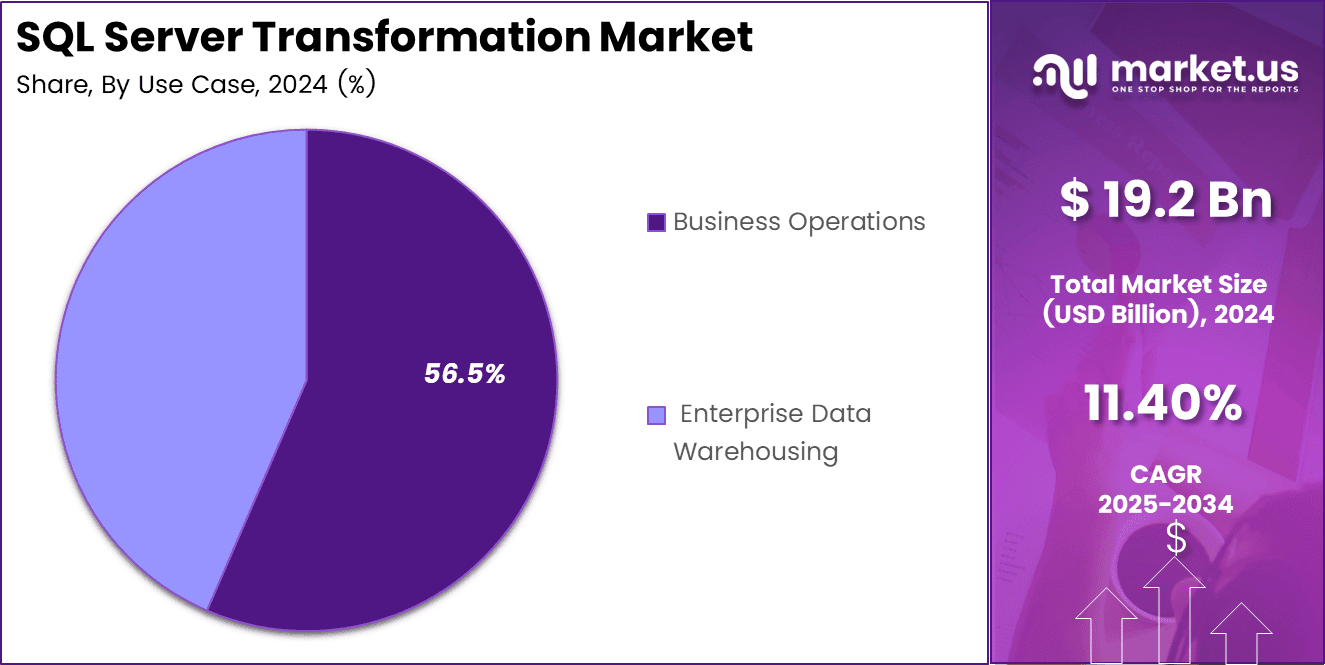
- Business Operations leads the use case segment with a 56.5% share.
- BFSI leads the vertical segment with a 25.9% share.
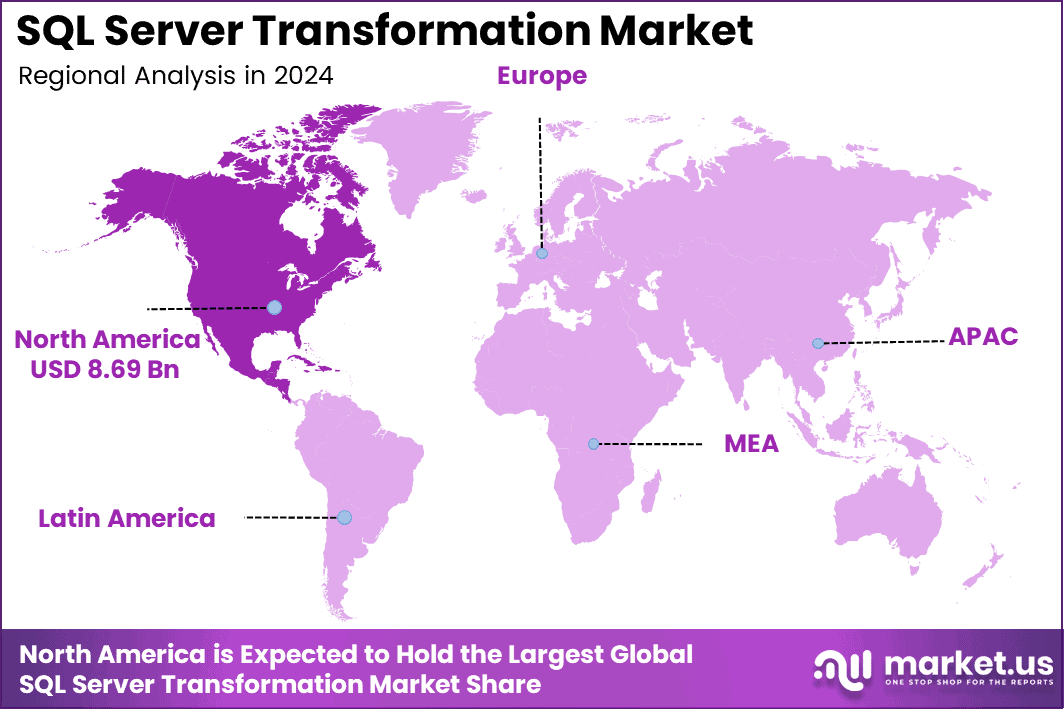
- North America leads with a 45.3% share and USD 8.7 billion in revenue.
Role of Generative AI
Generative AI plays a transformative role in the SQL Server Transformation Market by automating data modeling, query optimization, and migration processes. It enhances database performance through predictive analytics, enabling faster insights and reducing manual workload in data integration.
AI-driven tools also support intelligent error detection, anomaly resolution, and adaptive data restructuring, improving accuracy and scalability. This integration empowers enterprises to modernize legacy databases efficiently while driving innovation and operational agility across various industries.
By Type
Information Retrieval dominates with 40.3% due to constant daily read requests across departments.
Information Retrieval leads because almost every converted SQL Server workload ends in a read request. Staff pull invoices, customer records, and stock levels hundreds of times a day, so teams rewrite these queries first and test them hardest.
Eurostat shows 33% of EU enterprises performed data analytics in 2023, and 28% did that work with their own employees, which means in-house teams keep touching retrieval code long after a migration ends.
Language and machine learning tools push this further, since Eurostat counted enterprise artificial intelligence use rising to 13.5% in 2024 from 8.0% a year earlier, and every model needs clean, joined input data. Analytical Queries still matter for planning, but they run on data that integration scripts already moved.
By Organization Size
Large Enterprises dominate with 70.4% due to huge legacy database estates needing rewrites.
Large Enterprises hold the biggest share because they run the oldest and largest SQL Server estates. A single bank or carmaker may keep thousands of stored procedures written over twenty years, and only a funded internal team can rewrite them safely. Enterprise size also buys platform access.
Eurostat records 84.67% of large EU firms paying for cloud services in 2025, against 49.3% of small businesses, so big firms already own the target platforms. Vendor results show the same pull, with Microsoft reporting server products and cloud services revenue of $129.4 billion in fiscal 2026, up 31% year on year.
SMEs, though, are speeding up quickest. Cheap managed database tiers remove the need for in-house administrators, and pay-as-you-go pricing lets a 40-person firm start a conversion for the price of one licence renewal. Partner-led fixed-price projects and automated schema tools shrink timelines from months to weeks.
By Use Case
Business Operations dominates with 56.5% due to billing, orders, and payroll running nonstop.
Business Operations takes the top share since day-to-day systems cannot pause. Order entry, billing, inventory, payroll, and claims all sit on SQL Server, and a broken transaction costs money within minutes, so these workloads get budget approval first. Vendor numbers show how deep operational software runs:
Oracle closed fiscal 2026 with total revenue of $67.4 billion, up 17%, while IBM reported $67.5 billion for 2025 with software near 45% of the company total. Enterprise Data Warehousing is the quicker climber. Firms now want one place to join sales, supply, and finance history, and modern warehouses charge for storage and compute separately, which cuts the cost of holding years of records.
By Vertical
BFSI dominates with 25.9% due to strict audit trails on every transaction.
BFSI leads because regulators force banks and insurers to keep every transaction traceable. The Federal Reserve counts 3,798 domestically chartered commercial banks in the United States, holding roughly $24.9 trillion in consolidated assets, and each one must prove where a figure came from during an audit.
Money also funds the work; FDIC-insured institutions earned $80.5 billion in net income in the first quarter of 2026, which pays for careful, tested conversions rather than rushed ones. Healthcare, meanwhile, accelerates fastest.
Digital record-keeping is now standard, since 99% of US non-federal acute care hospitals and 91% of office-based physicians use a certified electronic health record, so hospitals sit on huge clinical databases that older servers struggle to serve.
Key Market Segments
By Type
- Analytical Queries
- Data Integration Scripts
- Information Retrieval
- Others
By Organization Size
- Large Enterprises
- Small and Medium-sized Enterprises (SMEs)
By Use Case
- Business Operations
- Enterprise Data Warehousing
By Vertical
- BFSI
- Healthcare
- Retail and Ecommerce
- Government
- IT and Telecom
- Others
Geopolitical Impact Analysis
Trade policy now sets the pace for database modernization budgets. The WTO cut its 2026 world merchandise trade volume growth forecast to 0.5%, down from 2.4% in 2025 and 2.8% in 2024, and linked the drop to higher tariffs and policy uncertainty that will unwind the inventory frontloading seen in early 2025.
Services trade feels the same drag, with WTO export growth slowing from 6.8% in 2024 to 4.6% in 2025 and 4.4% in 2026. Since SQL Server transformation projects are billed largely as cross-border professional and cloud services, softer services trade tightens the delivery budgets that fund query rewrites, schema conversion, and testing cycles.
Logistics adds a second cost layer for the server, storage, and networking gear these migrations sit on. UNCTAD reports that shipping moves over 80% of world merchandise trade, yet seaborne volumes will barely rise by 0.5% in 2025 as rerouting reshapes networks. Suez Canal transits ran about 70% below 2023 average tonnage levels as of May 2025.
Longer routes, skipped port calls, and volatile freight rates raise landed hardware costs for on-premises refresh cycles, which pushes more buyers toward cloud targets and lifts demand for migration tooling. Power supply adds pressure too, since ITU notes data centres already consume about 1.5% of global electricity, so capacity siting decisions increasingly follow energy politics rather than customer geography.
Regional Analysis
North America dominates the SQL Server Transformation Market, holding a 45.3% share and generating USD 8.7 billion in revenue. The region runs the largest installed base of legacy relational systems in banking, insurance, hospital networks, and federal agencies, and those estates carry decades of stored procedures that need conversion. Scale helps.
Asia Pacific ranks as the fastest-growing region in the SQL Server Transformation Market. ITU data shows internet use in Asia Pacific jumped from 50% in 2019 to 77% in 2025, the sharpest 27-point gain of any region. That surge creates transaction volumes that legacy databases cannot absorb.
Europe holds the second-largest position and grows on strict data rules and sovereign cloud demand. ITU figures show 92% of Europeans use the internet, near-universal connectivity that supports heavy digital service loads. Germany, France, and the UK anchor spending through banking, manufacturing, and public sector modernization.
US Market Size
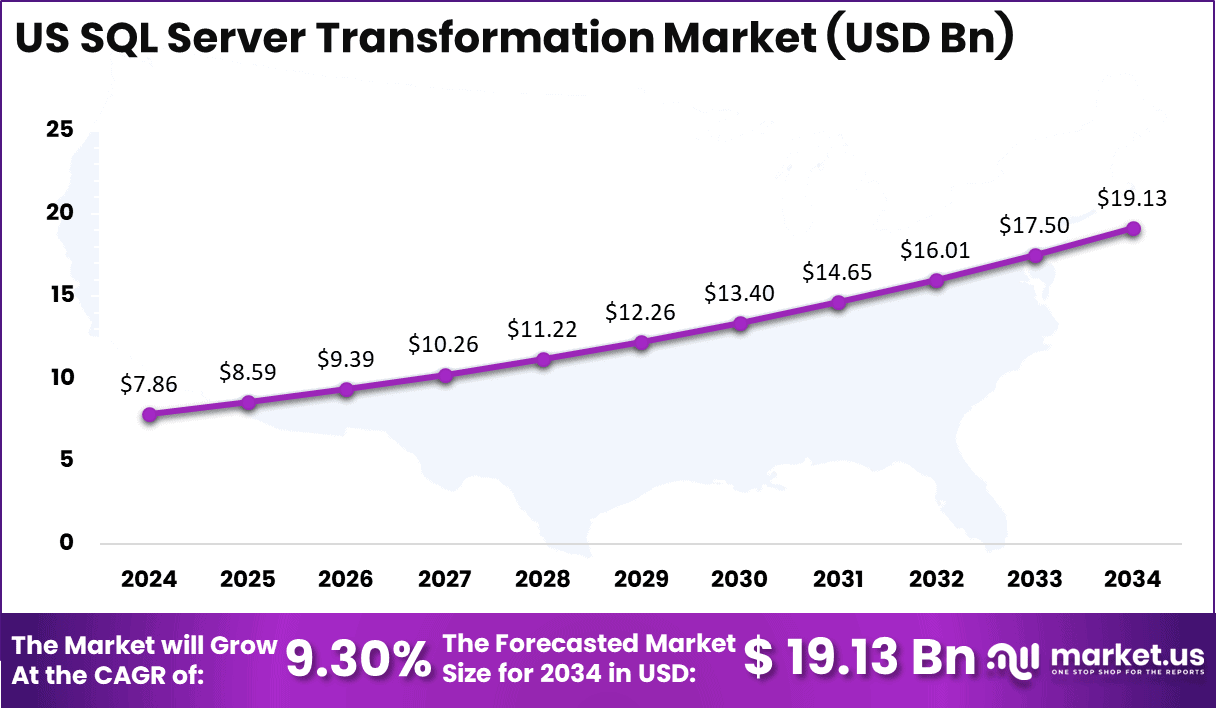
The US SQL Server Transformation Market is experiencing substantial growth, valued at USD 7.86 billion in 2024 and projected to reach USD 19.13 billion by 2034, growing at a CAGR of 9.3%.
This growth is driven by the accelerating shift toward cloud-based database management, automation, and modernization of legacy systems. Increasing enterprise focus on digital transformation, data-driven decision-making, and hybrid IT infrastructures is enhancing demand for advanced SQL Server transformation solutions.
These systems support scalability, real-time data processing, and cost-efficient operations across sectors such as BFSI, healthcare, IT, and retail. Furthermore, the integration of artificial intelligence, analytics, and automation within SQL platforms is improving performance and optimizing workload management.
Key Regions and Countries
North America
- US
- Canada
Europe
- Germany
- France
- The UK
- Spain
- Italy
- Rest of Europe
Asia Pacific
- China
- Japan
- South Korea
- India
- Australia
- Rest of APAC
Latin America
- Brazil
- Mexico
- Rest of Latin America
Middle East and Africa
- GCC
- South Africa
- Rest of MEA
Market Dynamics
Drivers
| Driver | (~) % Impact on CAGR Forecast | Geographic Relevance | Impact Timeline |
|---|---|---|---|
| SQL Server 2016 extended support expiry | +2.6% | Global | Short term (2 years or less) |
| Perpetual-to-subscription licensing shift | +1.8% | North America, Western Europe | Medium term (2 to 4 years) |
| Core-based license escalation driving consolidation | +1.4% | Global | Short term (2 years or less) |
| Co-terminal Windows Server end-of-life cycles | +1.1% | Global | Short term (2 years or less) |
| Operational resilience mandates in regulated sectors | +1.2% | European Union, United Kingdom | Medium term (2 to 4 years) |
| Hyperscaler migration incentive funding | +0.9% | Global | Short term (2 years or less) |
SQL Server 2016 Extended Support Expiry
The statutory trigger is fixed by Microsoft’s product lifecycle. SQL Server 2016 ended mainstream support and extended support, after which security updates require paid Extended Security Updates through 2029. This turns continued use of the 13.x engine into a compliance and audit concern.
Workloads previously supported by perpetual licenses amortized over 7 to 10 years must now move toward refreshed 2025-generation licenses or monthly managed-instance capacity. Standard edition support was expanded to 32 cores, while Web edition was discontinued.
This forced refresh cycle can increase demand for assessment, remediation, and migration services, shifting integrator economics from relatively low-margin 8% to 12% license resale toward transformation work carrying approximately 25% to 35% gross margins. It can also bring platform revenue forward by around 2 to 4 quarters compared with a voluntary upgrade cycle.
Restraints
| Restraint | (~) % Impact on CAGR Forecast | Geographic Relevance | Impact Timeline |
|---|---|---|---|
| Capital rationing under elevated real rates | -2.2% | Global | Short term (2 years or less) |
| Extended Security Updates as migration deferral | -1.9% | Global | Short term (2 years or less) |
| Data residency prohibitions on cloud targets | -1.3% | European Union, Middle East, Southeast Asia | Medium term (2 to 4 years) |
| Egress and parallel-run cost exposure | -1.1% | Global | Short term (2 years or less) |
| ISV certification locked to legacy versions | -1.0% | North America, Europe, Japan | Medium term (2 to 4 years) |
| Currency depreciation against USD-denominated licensing | -0.8% | Latin America, South Asia, Africa | Short term (2 years or less) |
Capital Rationing Under Elevated Real Rates
The restraint is driven by higher financing costs, as policy rates remain above pre-2022 levels and corporate borrowing costs have increased materially. As a result, CFOs increasingly require infrastructure investments to deliver payback within 18 to 24 months.
This creates a front-loaded cost profile, while savings are generally realized in later years, making projects less attractive when discount rates increase by even 200 basis points. The impact is increasingly visible in project scope and service-provider economics.
Customers may limit modernization to only 10% to 20% of database instances associated with audit or compliance risks, while broader programs are deferred. Integrator backlog conversion can consequently be delayed by 1 to 2 quarters, while services gross margins may decline by around 300 to 500 basis points because of weaker utilization and increased pricing pressure.
Challenges
| Challenge | (~) % CAGR Friction Drag | Geographic Relevance | Mitigation Horizon |
|---|---|---|---|
| Legacy T-SQL technical debt | -1.4% | Global | Long term (4 years or more) |
| Scarce migration engineering talent | -1.2% | Global | Medium term (2 to 4 years) |
| Unforecasted post-migration consumption overruns | -1.0% | North America, Europe | Medium term (2 to 4 years) |
| Narrow cutover downtime windows | -0.9% | Global | Short term (2 years or less) |
| Incomplete estate discovery coverage | -0.7% | Global | Short term (2 years or less) |
| Constrained partner delivery capacity | -0.6% | Europe, Asia Pacific | Medium term (2 to 4 years) |
Legacy T-SQL Technical Debt
The structural vulnerability comes from accumulated procedural logic built over nearly two decades, including stored procedures, SQL Agent jobs, linked-server calls, CLR assemblies, replication configurations, and outdated compatibility settings. These components cannot always be moved directly to platform-as-a-service environments, requiring object-by-object remediation.
The long-term impact is a change in migration delivery economics. Providers are increasingly required to use automated code assessment, conversion, and refactoring tools rather than relying mainly on additional technical staff. Fixed-price projects may also need a 15% to 25% rework provision to cover unexpected remediation and change requests.
Opportunities
| Opportunity | (~) % Potential CAGR Upside | Geographic Relevance | Execution Window |
|---|---|---|---|
| AI-ready data estate retrofits | +2.0% | Global | Medium term (2 to 4 years) |
| Fixed-price mid-market migration factories | +1.5% | North America, India, Southeast Asia | Short term (2 years or less) |
| Sovereign managed-database delivery models | +1.3% | European Union, Gulf states | Medium term (2 to 4 years) |
| Cross-engine conversion tooling licensing | +1.1% | Global | Medium term (2 to 4 years) |
| Roll-up of boutique modernization practices | +0.9% | Europe, North America | Long term (4 years or more) |
| FinOps-led post-migration optimization annuities | +0.8% | Global | Short term (2 years or less) |
AI-Ready Data Estate Retrofits
This opportunity remains largely untapped because most SQL Server transformation projects end at parity migration, while AI-ready retrofits begin after cutover. Native vector columns, approximate nearest-neighbour indexing, and in-engine embedding functions are available in the 2025 generation, introduced within the previous 12 months.
Commercially, AI-ready retrofits can extend migration projects into recurring services covering embedding refresh, index maintenance, and model governance. These services could improve blended engagement margins by an estimated 600 to 900 basis points compared with parity migration work and extend average customer relationships by approximately 24 to 36 months.
Key Players Analysis
Tier 1 leaders control the platforms that migrations start from and land on. Microsoft sits at the center, reporting total revenue of USD 281.7 billion in fiscal 2025 with operating income up 17% to USD 128.5 billion, and it spent USD 32.5 billion on research and development that year against USD 29.5 billion in fiscal 2024.
Momentum continued into fiscal 2026, when quarterly Intelligent Cloud revenue reached USD 32.9 billion, up 29%. Oracle competes as both source and destination, posting fiscal 2025 total revenue of USD 57.4 billion, up 8%, with quarterly research and development at USD 2.65 billion, or 17% of quarterly revenue. Fiscal 2026 cloud revenues then rose 39% to USD 34.0 billion.
Amazon Web Services and Alphabet expand the target infrastructure. Amazon committed USD 48 billion to India through 2030, adding data centre capacity that absorbs migrated database workloads. IBM buys capability instead of building it, closing its DataStax purchase on 1 November 2025 and folding Astra DB into watsonx.
Data Multicloud and DataStax Enterprise into watsonx. Data Premium. SAP strengthens the application layer around converted data, completing its SmartRecruiters acquisition in September 2025 and inheriting a base of more than 4,000 enterprise customers.
Tier 2 challengers hold focused positions. Teradata, Qlik, Actian, NuoDB, and MemSQL compete on analytics performance, data integration, and distributed SQL, targeting buyers who want migration paths that avoid single vendor lock-in across hybrid estates.
Top Key Players in the Market
- Oracle
- Microsoft
- SAP SE
- IBM
- Alphabet
- Amazon Web Services Inc.
- Teradata
- NuoDB Inc.
- MemSQL Inc.
- Actian Corporation
- Qlik
Recent Developments
- In February 2025, IBM completed its acquisition of HashiCorp at USD 35 per share in cash, an enterprise value of USD 6.4 billion, adding multi-cloud infrastructure automation to its data platform stack.
- In June 2025, Amazon announced plans to invest AU USD 20 billion to expand, operate and maintain data centre infrastructure in Australia for cloud and AI workloads. Amazon announced a USD 35 billion India investment covering cloud infrastructure, AI services and a 473 MW data centre campus near Navi Mumbai.
- In June 2025, Oracle reported fiscal 2025 capital expenditures of USD 21.2 billion on revenue-generating data centre equipment and guided fiscal 2026 capex above USD 25 billion to meet backlog commitments.
- In March 2026, Alphabet completed its USD 32 billion all-cash acquisition of Wiz, folding the cloud security platform into Google Cloud after US and EU clearances.
Report Scope
| Report Features | Description |
|---|---|
| Market Value (2024) | USD 19.2 billion |
| Forecast Revenue (2034) | USD 56.5 billion |
| CAGR (2025-2034) | 11.4% |
| Base Year for Estimation | 2024 |
| Historic Period | 2020-2023 |
| Forecast Period | 2025-2034 |
| Report Coverage | Revenue Forecast, Market Dynamics, Competitive Landscape, Recent Developments |
| Segments Covered | By Type (Analytical Queries, Data Integration Scripts, Information Retrieval, Others); By Organization Size (Large Enterprises, Small and Medium-sized Enterprises (SMEs)); By Use Case (Business Operations, Enterprise Data Warehousing); By Vertical (BFSI, Healthcare, Retail and Ecommerce, Government, IT and Telecom, Others) |
| Regional Analysis | North America – US, Canada; Europe – Germany, France, The UK, Spain, Italy, Rest of Europe; Asia Pacific – China, Japan, South Korea, India, Australia, Singapore, Rest of APAC; Latin America – Brazil, Mexico, Rest of Latin America; Middle East & Africa – GCC, South Africa, Rest of MEA |
| Competitive Landscape | Oracle, Microsoft, SAP SE, IBM, Alphabet, Amazon Web Services Inc., Teradata, NuoDB Inc., MemSQL Inc., Actian Corporation, Qlik |
| Customization Scope | Customization for segments, region/country-level will be provided. Additional customization can be done based on requirements. |
| Purchase Options | We have three licenses to opt for: Single User License, Multi-User License (Up to 5 Users), Corporate Use License (Unlimited Users and Printable PDF) |





























