


Report Overview
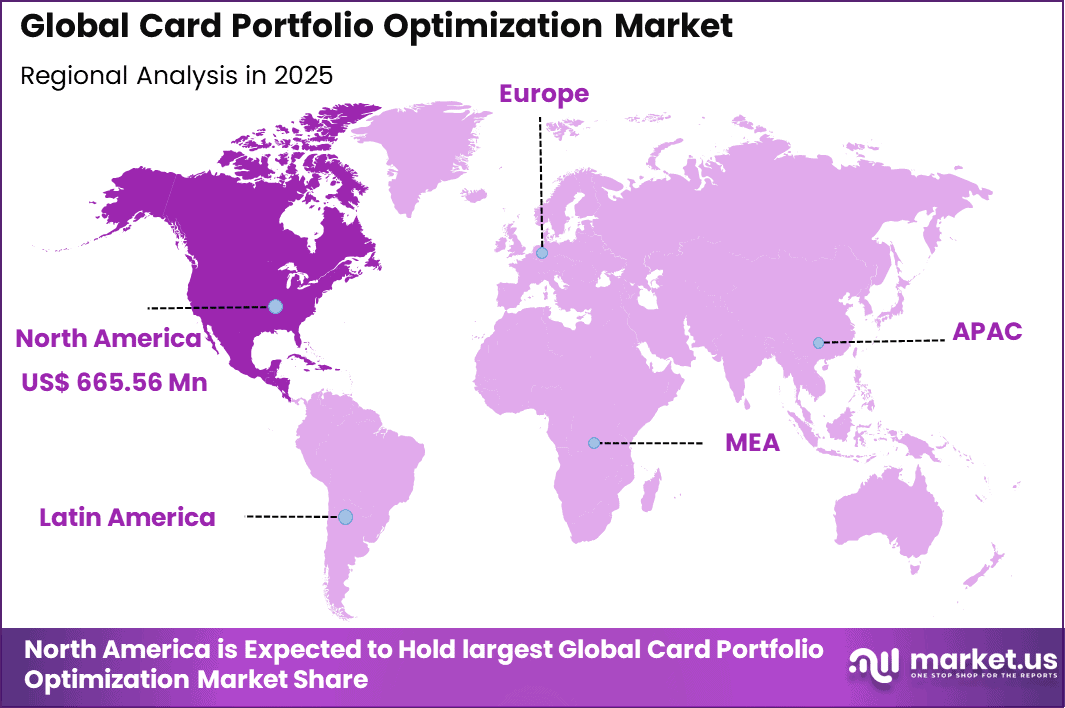
The Global Card Portfolio Optimization Market generated USD 679.2 million in 2025 and is predicted to register growth from USD 780.4 million in 2026 to about USD 2,723.9 million by 2035, recording a CAGR of 14.9% throughout the forecast span. In 2025, North America held a dominant market position, capturing more than a 39.1% share, with USD 665.56 million in revenue.
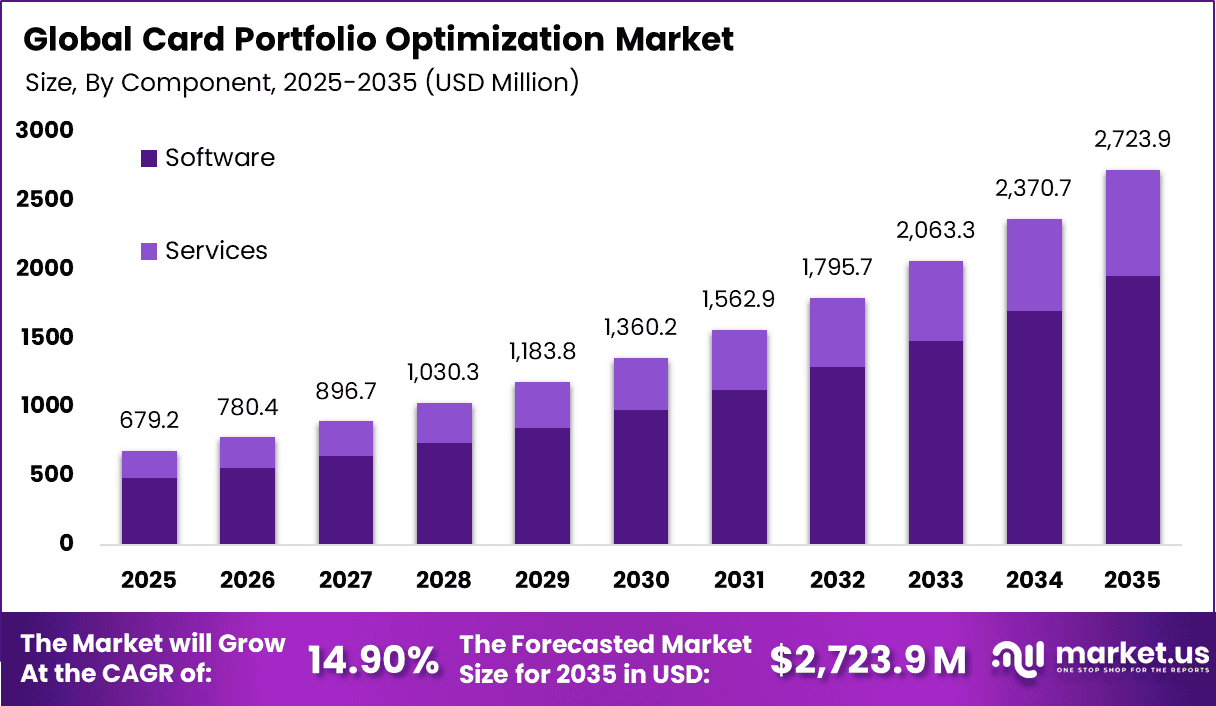
The card portfolio optimization market focuses on improving the performance and profitability of credit and debit card portfolios through data-driven decision frameworks. These solutions help financial institutions analyze customer behavior, spending patterns, and risk exposure to refine pricing, rewards, limits, and lifecycle strategies. Portfolio optimization supports better alignment between customer value and risk management objectives. The market is shaped by issuers seeking sustainable growth while maintaining portfolio quality.
One of the main drivers is the rising competition in the card-issuing space, which is putting pressure on margins and customer retention. Issuers must balance attractive rewards and credit access with disciplined risk controls. Traditional portfolio management approaches often rely on periodic reviews, which limits responsiveness to changing customer behavior. Optimization tools enable more frequent adjustments based on real-time insights, improving overall portfolio efficiency.
Growth in the card portfolio optimization market is supported by the increasing use of advanced analytics in consumer finance. Institutions are adopting more granular segmentation to tailor offers and credit strategies across different customer groups. Improved data integration across channels is also enhancing visibility into spending and repayment behavior.
Top Market Takeaways
- By component, software/solutions account for 71.8% of the market, providing analytics engines for portfolio modeling, customer segmentation, and profitability simulations.
- By deployment mode, cloud-based platforms represent 65.2%, offering agility, big data processing, and real-time decisioning for dynamic card ecosystems.
- By card type, credit cards dominate with a 76.5% share, focusing on revolving balances, delinquency prediction, and personalized limit adjustments.
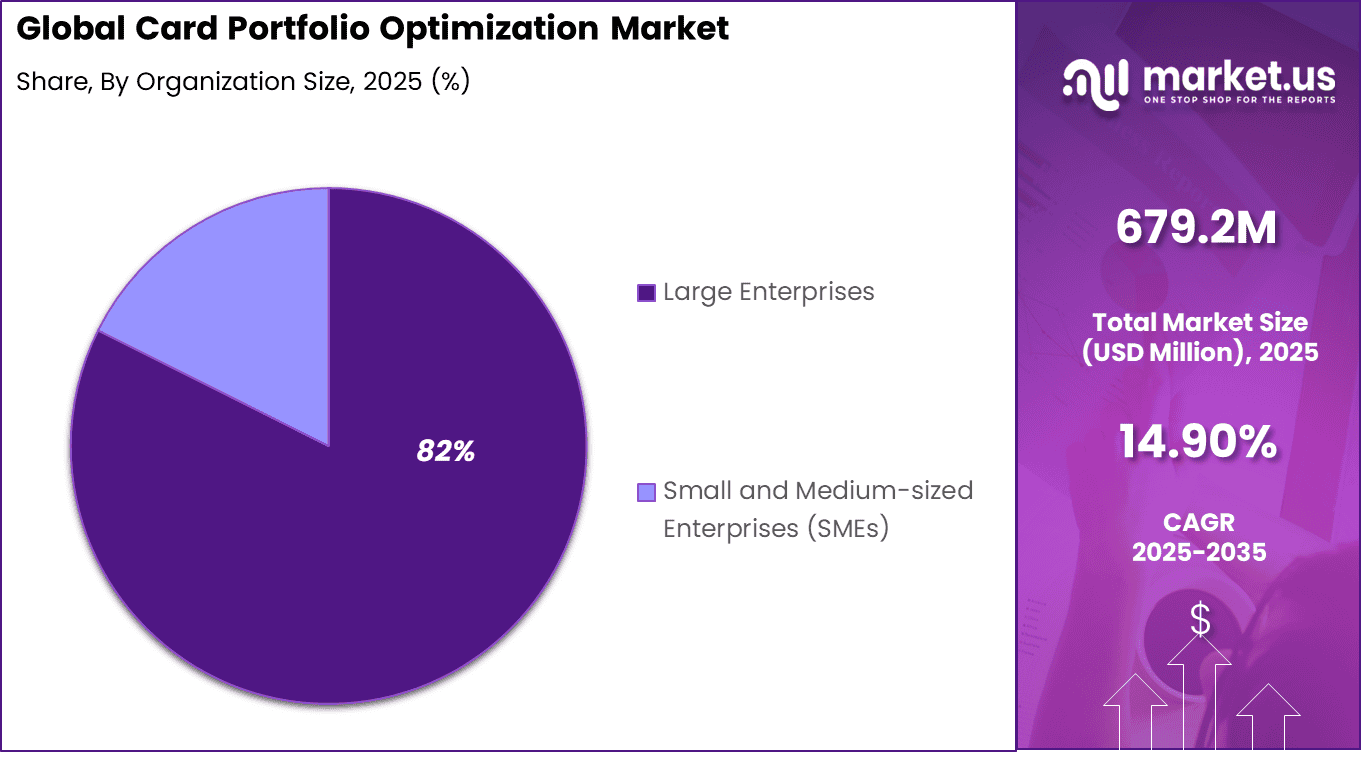
- By organization size, large enterprises hold 82.4%, managing massive portfolios with advanced optimization to balance growth, risk, and regulatory capital.
- By application, risk & credit line optimization captures 32.9%, using machine learning to dynamically adjust limits, detect early defaults, and maximize returns.
- By end-user, banks & credit unions command 73.8%, driven by competitive pressures to enhance card profitability amid economic shifts and fraud challenges.
Key Challenges
- Difficulty in integrating optimization tools with existing card processing systems
- Data quality and fragmentation issues across transaction and customer datasets
- Regulatory constraints affecting credit, pricing, and limit optimization decisions
- High dependence on advanced analytics skills for effective portfolio management
- Resistance to change from traditional card risk and operations teams
By Component
Software and solution-based offerings account for 71.8% of adoption in the card portfolio optimization market, as financial institutions rely on advanced analytics to manage card performance. These solutions consolidate customer behavior analysis, portfolio monitoring, and decision rules into a single operating layer. This helps institutions respond faster to changing credit and spending patterns.
From an operational perspective, software-driven platforms reduce dependence on manual portfolio reviews. Automated insights support consistent policy execution across large card bases. This functionality continues to support a strong preference for software-led optimization tools.
By Deployment Mode
Cloud-based deployment holds 65.2%, driven by the need for scalable processing and real-time portfolio insights. Card portfolios generate large volumes of transaction data that require continuous analysis. Cloud environments provide the flexibility to scale analytics without infrastructure constraints.
Cloud deployment also supports faster model updates and integration with digital banking systems. Institutions benefit from improved agility and lower maintenance overhead. These factors continue to reinforce cloud adoption in portfolio optimization.
By Card Type
Credit cards represent 76.5% of optimization focus, reflecting their high transaction frequency and credit exposure. Managing credit card portfolios requires constant balancing of risk, profitability, and customer experience. Optimization tools help adjust limits and policies based on real usage behavior.
Rising digital payments have increased reliance on credit cards across regions. This has expanded portfolio complexity and risk sensitivity. As a result, credit card-focused optimization remains the primary application area.
By Organization Size
Large enterprises account for 82% of adoption due to their extensive cardholder bases. These organizations manage millions of active accounts across multiple customer segments. Advanced optimization platforms are necessary to maintain portfolio health at scale.
Large institutions also face higher regulatory and reputational risk. Centralized optimization tools improve governance and oversight. This sustains strong adoption among large-scale card issuers.
By Application
Risk and credit line optimization represents 32.9% of application usage, as institutions focus on balancing growth with loss control. These tools assess customer risk profiles to adjust credit limits dynamically. This helps prevent overexposure while supporting responsible spending.
Improved credit line management also reduces default risk. Data-driven adjustments improve portfolio stability during economic shifts. This keeps risk-focused optimization as a core use case.
By End User
Banks and credit unions hold 73.8% of end-user adoption, as card portfolios are central to their consumer lending strategies. These institutions rely on optimization tools to improve profitability while maintaining credit quality. Portfolio insights support better decision-making across lifecycle stages.
Credit unions also use optimization to manage member risk responsibly. Consistent analytics improve transparency and trust. This drives sustained adoption across traditional financial institutions.
Key Market Segments
By Component
- Software
- Services
By Deployment Mode
- Cloud-based
- On-premises
By Card Type
- Credit Cards
- Debit Cards
- Prepaid Cards
- Commercial Cards
By Organization Size
- Large Enterprises
- Small and Medium-sized Enterprises (SMEs)
By Application
- Customer Segmentation & Targeting
- Risk & Credit Line Optimization
- Pricing & Fee Strategy
- Retention & Loyalty Program Management
- Others
By End-User
- Banks & Credit Unions
- Payment Processors & Networks
- Retailers & Private Label Issuers
Regional Analysis
North America holds a 39.1% share of the card portfolio optimization market, supported by high credit and debit card penetration and advanced analytics adoption among financial institutions. Banks and card issuers in the region are focusing on portfolio optimization to improve spend performance, manage credit risk, and enhance customer profitability. Demand is driven by competitive card markets, rising transaction volumes, and the need to balance risk controls with personalized offers and pricing strategies.
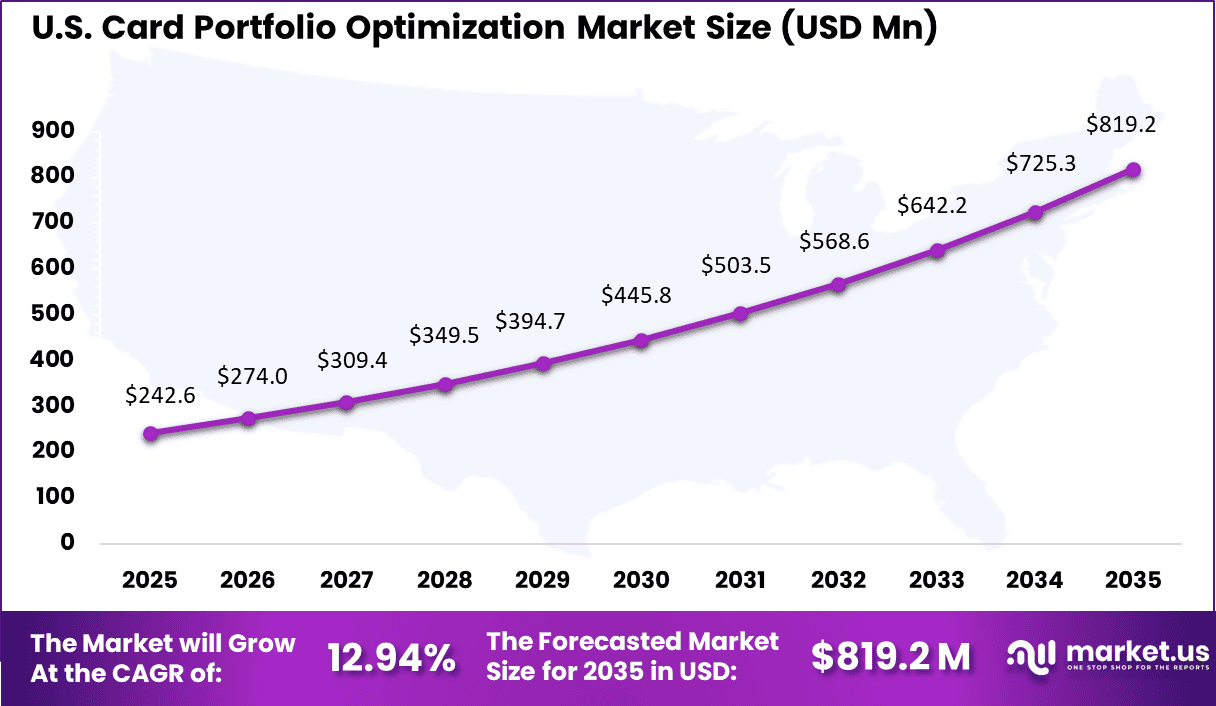
The United States market is valued at USD 242.6 Mn and is growing at a CAGR of 12.94%, reflecting increased use of data-driven decision models in card management. Adoption is influenced by the need to optimize credit limits, reduce delinquency, and improve customer retention across diverse cardholder segments. Growth is further supported by integration of real-time transaction data and advanced analytics to support proactive portfolio monitoring and performance improvement.
Key Regions and Countries
- North America
- US
- Canada
- Europe
- Germany
- France
- The UK
- Spain
- Italy
- Russia
- Netherlands
- Rest of Europe
- Asia Pacific
- China
- Japan
- South Korea
- India
- Australia
- Singapore
- Thailand
- Vietnam
- Rest of APAC
- Latin America
- Brazil
- Mexico
- Rest of Latin America
- Middle East & Africa
- South Africa
- Saudi Arabia
- UAE
- Rest of MEA
Drivers Impact Analysis
| Key Driver | Impact on CAGR Forecast (~%) | Geographic Relevance | Impact Timeline |
|---|---|---|---|
| Rising competition among card issuers to improve profitability | +4.1% | North America, Europe | Short to medium term |
| Growing focus on data-driven card lifecycle and spend optimization | +3.5% | Global | Medium term |
| Expansion of credit, debit, and co-branded card programs | +3.0% | North America, Asia Pacific | Medium term |
| Increasing use of analytics to reduce churn and improve retention | +2.6% | Global | Medium term |
| Regulatory pressure to improve transparency and risk controls | +1.7% | North America, Europe | Medium to long term |
Restraints Impact Analysis
| Key Restraint | Impact on CAGR Forecast (~%) | Geographic Relevance | Impact Timeline |
|---|---|---|---|
| High integration complexity with core banking and card systems | −3.0% | Global | Short to medium term |
| Limited analytics maturity among mid-sized financial institutions | −2.5% | Asia Pacific, Latin America | Medium term |
| Data quality and fragmentation across card portfolios | −2.1% | Global | Medium term |
| Regulatory constraints on pricing and fee optimization | −1.8% | Europe, North America | Medium term |
| Longer sales and procurement cycles in large banks | −1.5% | North America, Europe | Medium to long term |
Emerging Trends
In the Card Portfolio Optimization market, a significant trend is the use of behaviour-driven scoring to tailor credit and rewards strategies more precisely at the customer level. Institutions are moving beyond broad segmentation toward dynamic models that adjust risk tolerances, credit limits, and reward rates based on real-time interaction patterns and payment histories.
This trend improves portfolio performance by aligning product incentives with demonstrated customer habits, rather than static criteria established at account opening. Another emerging shift is the integration of optimisation insights directly into customer engagement channels, so personalised offers and risk notifications can be delivered seamlessly through mobile and online platforms, improving both relevance and response.
Growth Factors
A central growth driver is the imperative to balance credit risk with customer value creation, especially as consumer expectations for personalised products rise. Advanced optimisation tools help institutions monitor delinquency signals and reward utilisation, enabling more nuanced interventions that support repayment behaviour while maintaining portfolio quality.
Another key driver is the competitive pressure to retain high-value cardholders in a crowded market. Enhanced optimisation supports refined decisioning that can identify opportunities to deepen relationships through tailored products, mitigating attrition and strengthening lifetime value. Together, these factors are elevating the importance of data-driven portfolio strategies that deliver both risk control and customer satisfaction.
Investor Type Impact Matrix
| Investor Type | Growth Sensitivity | Risk Exposure | Geographic Focus | Investment Outlook |
|---|---|---|---|---|
| Card analytics and optimization software providers | Very High | Medium | North America, Europe | Strong recurring SaaS revenue |
| Banks and card-issuing financial institutions | High | Low to Medium | Global | Strategic profitability investment |
| Payment processors and card networks | Medium | Medium | Global | Value-added analytics expansion |
| Private equity firms | Medium | Medium | North America, Europe | Consolidation of analytics platforms |
| Venture capital investors | High | High | North America | Innovation in AI-driven optimization |
Technology Enablement Analysis
| Technology Enabler | Impact on CAGR Forecast (~%) | Primary Function | Geographic Relevance | Adoption Timeline |
|---|---|---|---|---|
| Advanced analytics and machine learning models | +4.3% | Portfolio performance optimization | Global | Short to medium term |
| AI-driven customer segmentation and spend analysis | +3.6% | Personalized offers and pricing | North America, Europe | Medium term |
| Real-time data integration from transaction systems | +3.0% | Faster decisioning | Global | Medium term |
| Cloud-based optimization platforms | +2.4% | Scalability and flexibility | Global | Medium to long term |
| Automated reporting and regulatory compliance tools | +1.6% | Risk and audit readiness | Europe, North America | Long term |
Competitive Analysis
The Card Portfolio Optimization market is led by established analytics, credit bureau, and payment network providers such as FICO, Experian, Equifax, TransUnion, SAS Institute, Mastercard, Visa, and Verisk Analytics. These players compete on data scale, advanced modeling, and proven risk and profitability frameworks used by banks and card issuers. Their solutions are widely used for credit line management, pricing optimization, fraud control, and customer lifecycle analysis, especially in large and mature card portfolios.
Consulting firms and specialized service providers, including McKinsey & Company, Oliver Wyman, Bain & Company, Accenture, PwC, and Alliance Data Systems, compete through strategic advisory and implementation expertise. Competition in this segment is driven by the ability to translate analytics into business decisions, improve portfolio returns, and reduce risk exposure.
Top Key Players in the Market
- FICO (Fair Isaac Corporation)
- Experian plc
- Equifax, Inc.
- TransUnion
- SAS Institute, Inc.
- Mastercard, Inc.
- Visa, Inc.
- Verisk Analytics, Inc.
- McKinsey & Company
- Oliver Wyman Group (Marsh McLennan)
- Bain & Company
- Accenture plc
- PwC (PricewaterhouseCoopers)
- Alliance Data Systems Corporation
- Others
Future Outlook
The future outlook for the Card Portfolio Optimization Market is positive as banks and payment providers look to improve card performance and profitability. Demand for optimization solutions is expected to grow because these tools help analyze customer behavior, adjust rewards and pricing, and reduce risk. Adoption of advanced analytics, artificial intelligence, and real-time insights will support more effective decision-making.
Growth can be attributed to increasing card usage, competitive pressure to retain customers, and stronger focus on financial efficiency. Overall, the market is expected to expand as institutions prioritize data-driven portfolio management.
Recent Developments
- In January 2026, Experian plc released the 2026 State of Credit Cards report on originations up seventeen percent. Fintechs grew seventy-one percent with subprime expansions. Warns of delinquency rises masking quality issues.
- In February 2026, Equifax Inc.’s Q4 slides showed Vitality Index at record fifteen percent from new AI products. Expanded TWN Indicator to card in Q4 after mortgage auto launches. Drives portfolio growth with predictive lifts.
Report Scope
| Report Features | Description |
|---|---|
| Market Value (2025) | USD 679.2 Million |
| Forecast Revenue (2035) | USD 2,723.9 Million |
| CAGR(2025-2035) | 14.9% |
| Base Year for Estimation | 2024 |
| Historic Period | 2020-2024 |
| Forecast Period | 2025-2035 |
| Report Coverage | Revenue forecast, AI impact on Market trends, Share Insights, Company ranking, competitive landscape, Recent Developments, Market Dynamics and Emerging Trends |
| Segments Covered | By Component (Software, Services), By Deployment Mode (Cloud-based, On-premises), By Card Type (Credit Cards, Debit Cards, Prepaid Cards, Commercial Cards), By Organization Size (Large Enterprises, Small and Medium-sized Enterprises (SMEs)), By Application (Customer Segmentation & Targeting, Risk & Credit Line Optimization, Others) |
| Regional Analysis | North America – US, Canada; Europe – Germany, France, The UK, Spain, Italy, Russia, Netherlands, Rest of Europe; Asia Pacific – China, Japan, South Korea, India, New Zealand, Singapore, Thailand, Vietnam, Rest of Latin America; Latin America – Brazil, Mexico, Rest of Latin America; Middle East & Africa – South Africa, Saudi Arabia, UAE, Rest of MEA |
| Competitive Landscape | FICO (Fair Isaac Corporation), Experian plc, Equifax, Inc., TransUnion, SAS Institute, Inc., Mastercard, Inc., Visa, Inc., Verisk Analytics, Inc., McKinsey & Company, Oliver Wyman Group (Marsh McLennan), Bain & Company, Accenture plc, PwC (PricewaterhouseCoopers), Alliance Data Systems Corporation, Others |
| Customization Scope | Customization for segments, region/country-level will be provided. Moreover, additional customization can be done based on the requirements. |
| Purchase Options | We have three licenses to opt for: Single User License, Multi-User License (Up to 5 Users), Corporate Use License (Unlimited Users and Printable PDF) |





































