


Report Overview
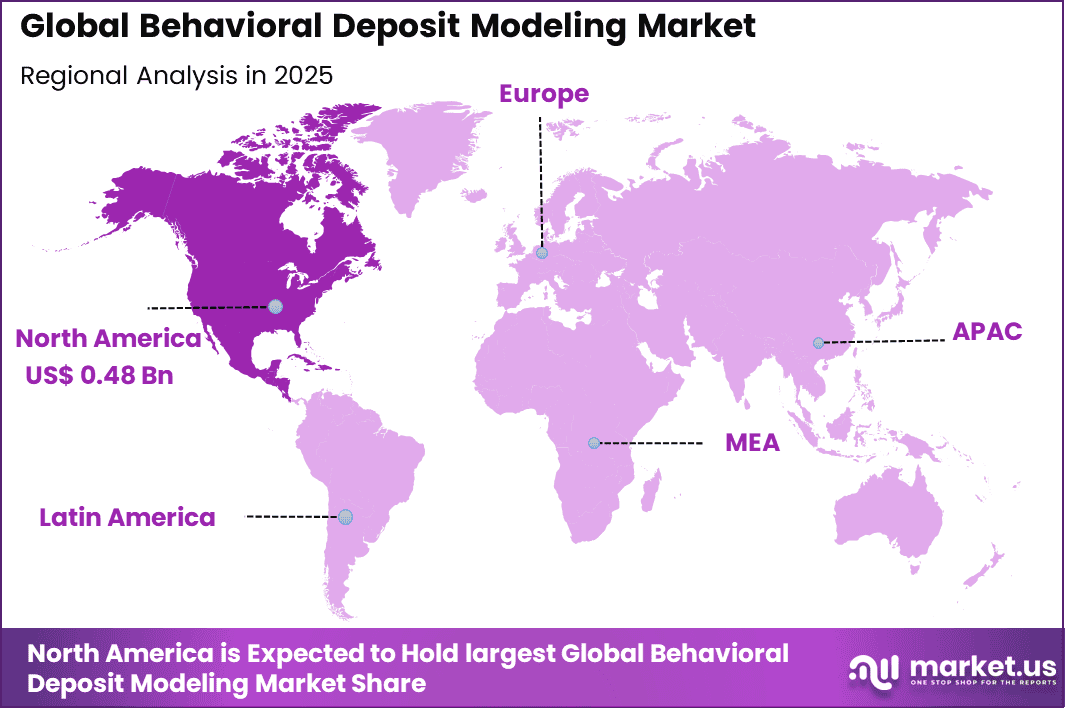
The Global Behavioral Deposit Modeling Market generated USD 1.3 billion in 2025 and is predicted to grow from USD 1.4 billion in 2026 to about USD 4.0 billion by 2035, recording a CAGR of 12.4% throughout the forecast period. In 2025, North America held a dominant market position, capturing more than a 38.4% share, with USD 0.48 billion in revenue.
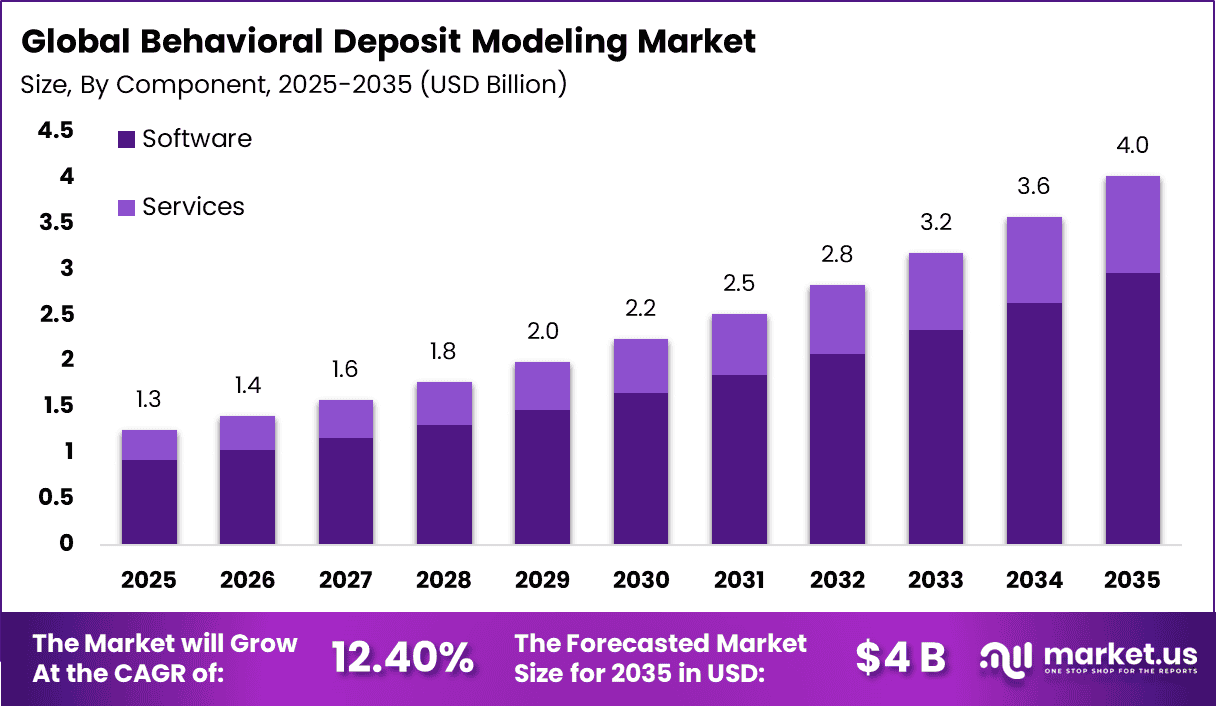
The behavioral deposit modeling market analyzes how customers use and retain deposit accounts over time. These models assess balance stability, withdrawal patterns, and sensitivity to interest rate changes rather than relying only on contractual terms.
Market growth is driven by changing economic conditions and wider digital banking access. Customers can transfer funds quickly, making traditional static assumptions less effective for liquidity planning, pricing, and balance sheet management.
Regulatory requirements and stronger internal risk controls are also supporting adoption. Improved transaction data and analytical tools allow digital banking to model non-maturity deposits more accurately and integrate the results into stress testing, asset-liability management, and liquidity assessment.
Top Market Takeaways
- By component, software/solutions account for 73.6% of the market, powering predictive analytics on customer deposit behaviors, balance runoff, and retention patterns.
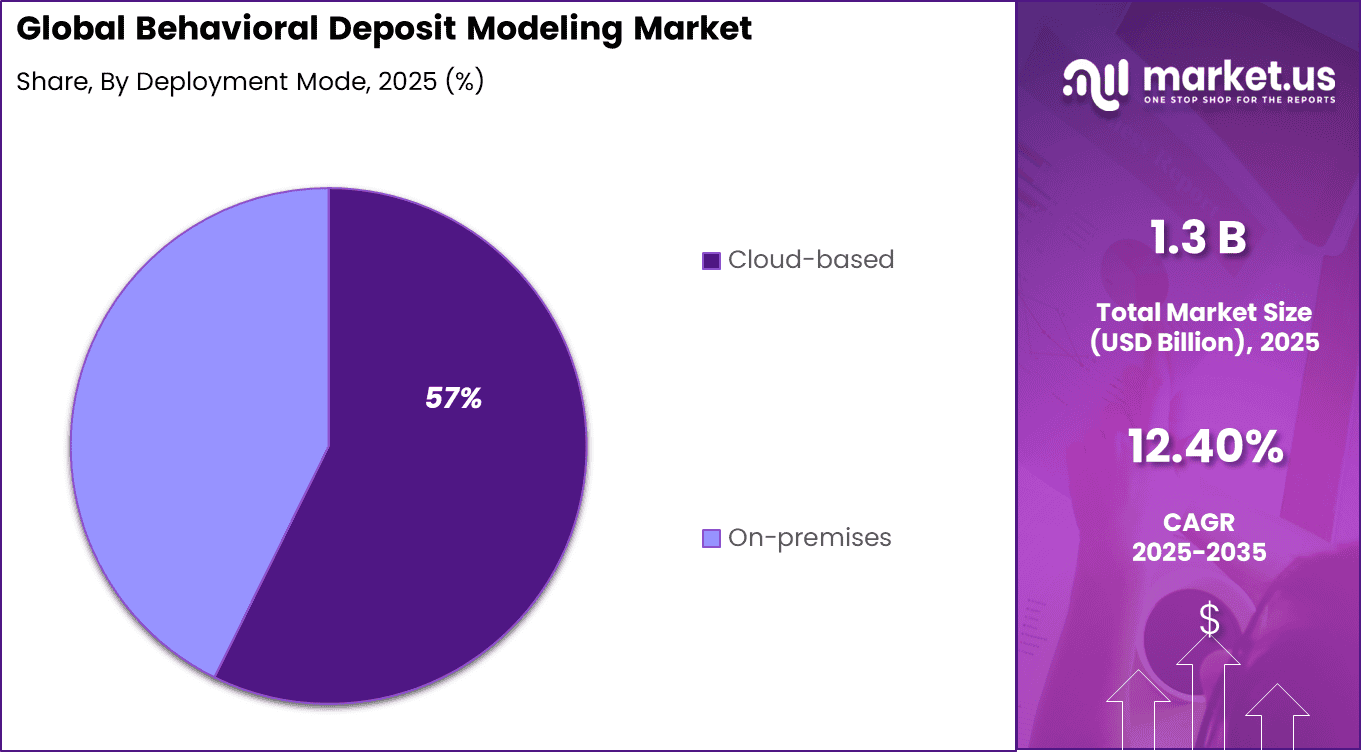
- By deployment mode, cloud-based platforms represent 57.3%, enabling scalable processing of vast transactional data for real-time modeling.
- By organization size, large enterprises hold an 86.7% share, requiring sophisticated tools for enterprise-wide deposit portfolio stress testing and forecasting.
- By application, interest rate risk management (IRRBB) captures 41.8%, simulating deposit beta shifts and early withdrawal risks under varying rate scenarios.
- By end-user, retail banks command 71.5%, using these models for liquidity planning, funding cost optimization, and regulatory compliance.
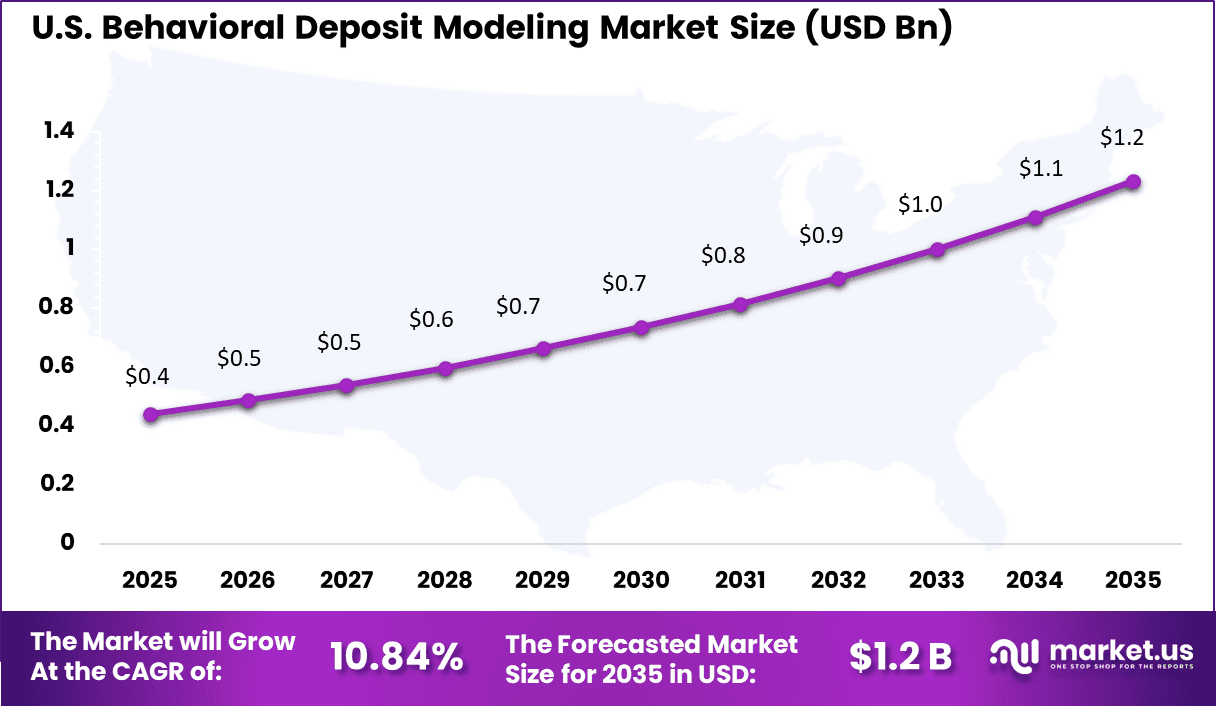
- By region, North America leads with 38.4% of the global market, where the U.S. is valued at USD 0.44 billion with a projected CAGR of 10.84%, driven by volatile rates and advanced analytics adoption.
By Component
Software and solution-based offerings account for 73.6% of adoption in the behavioral deposit modeling market, as banks require advanced analytical engines to understand deposit behavior. These solutions model customer sensitivity to interest rate changes and liquidity conditions using historical and behavioral data. This capability supports more accurate balance sheet planning and risk assessment.
Institutions prefer software-led approaches because they provide consistent modeling frameworks across products and regions. Automated recalibration improves reliability compared to manual methods. This continues to position software solutions as the core component of behavioral deposit modeling.
By Deployment Mode
Cloud-based deployment holds 57%, driven by the need for scalable computation and flexible model updates. Behavioral modeling requires processing large data sets and running multiple scenarios. Cloud environments support these requirements with lower infrastructure complexity.
Cloud deployment also enables faster integration with treasury and risk systems. Institutions benefit from improved collaboration between risk and finance teams. These operational advantages support steady cloud adoption.
By Organization Size
Large enterprises represent 86.7% of market adoption due to their complex deposit structures. These institutions manage diverse customer segments with varying behavioral patterns. Advanced modeling tools are essential to capture this complexity accurately.
Regulatory scrutiny is also higher for large banks. Behavioral deposit models support stress testing and regulatory reporting. This reinforces strong adoption among large-scale financial institutions.
By Application
Interest rate risk management accounts for 41.8% of application usage, reflecting its central role in deposit modeling. Behavioral assumptions directly influence interest rate sensitivity and repricing profiles. Accurate modeling is critical for managing margin volatility.
Changing rate environments increase the importance of realistic deposit behavior assumptions. Behavioral models improve scenario analysis and forecasting accuracy. This makes IRRBB a primary use case for these platforms.
By End User
Retail banks hold 71.5% of end-user adoption, as deposits are a core funding source in retail banking. Understanding customer withdrawal and repricing behavior is essential for liquidity and margin management.
Behavioral deposit modeling supports these objectives. Retail banks also face detailed supervisory expectations around deposit stability. Advanced modeling tools improve transparency and governance. This continues to drive adoption across the retail banking sector.
Key Market Segments
By Component
- Software
- Services
By Deployment Mode
- Cloud-based
- On-premises
By Organization Size
- Large Enterprises
- Small and Medium-sized Enterprises (SMEs)
By Application
- Balance Forecasting & Volatility Modeling
- Interest Rate Risk Management (IRRBB)
- Deposit Pricing & Strategy
- Liquidity Stress Testing & Reporting
- Others
By End-User
- Retail Banks
- Commercial Banks
- Credit Unions
Regional Analysis
North America accounts for 38.4% of the behavioral deposit modeling market, supported by advanced risk management practices and strong regulatory focus on liquidity and interest rate risk. Banks in the region use behavioral models to better understand deposit stability, customer withdrawal behavior, and rate sensitivity across different account types. Demand is driven by volatile rate environments and the need for more accurate assumptions in balance sheet planning and stress testing.
The United States market is valued at USD 0.44 Bn and is growing at a CAGR of 10.84%, reflecting increased reliance on data-driven deposit behavior analysis. Adoption is influenced by tighter liquidity management requirements and the need to improve asset-liability decision-making. Growth is further supported by higher use of granular customer data and scenario-based modeling to strengthen funding stability and long-term balance sheet resilience.
Key Regions and Countries
- North America
- US
- Canada
- Europe
- Germany
- France
- The UK
- Spain
- Italy
- Russia
- Netherlands
- Rest of Europe
- Asia Pacific
- China
- Japan
- South Korea
- India
- Australia
- Singapore
- Thailand
- Vietnam
- Rest of APAC
- Latin America
- Brazil
- Mexico
- Rest of Latin America
- Middle East & Africa
- South Africa
- Saudi Arabia
- UAE
- Rest of MEA
Driver Impact Analysis
| Key Driver | Impact on CAGR Forecast (~%) | Geographic Relevance | Impact Timeline |
|---|---|---|---|
| Rising interest rate volatility affecting deposit behavior | +3.4% | North America, Europe | Short to medium term |
| Increasing regulatory focus on liquidity risk and stress testing | +2.9% | North America, Europe | Medium term |
| Growing adoption of advanced ALM and treasury analytics | +2.5% | Global | Medium term |
| Expansion of digital banking and changing customer deposit patterns | +2.1% | Global | Medium term |
| Need for accurate modeling of non-maturity deposits | +1.5% | North America, Asia Pacific | Medium to long term |
Restraints Impact Analysis
| Key Restraint | Impact on CAGR Forecast (~%) | Geographic Relevance | Impact Timeline |
|---|---|---|---|
| Complexity of behavioral assumptions and model calibration | −2.8% | Global | Medium term |
| Limited historical data for changing deposit behaviors | −2.3% | Global | Medium term |
| High implementation and customization costs | −1.9% | Emerging Markets | Short to medium term |
| Integration challenges with core banking and ALM systems | −1.6% | Global | Medium term |
| Shortage of quantitative risk modeling expertise | −1.3% | Asia Pacific, Latin America | Medium to long term |
Investor Type Impact Matrix
| Investor Type | Growth Sensitivity | Risk Exposure | Geographic Focus | Investment Outlook |
|---|---|---|---|---|
| Treasury and risk analytics software providers | Very High | Medium | North America, Europe | Strong recurring software demand |
| Banks and financial institutions | High | Low to Medium | Global | Strategic regulatory compliance investment |
| Core banking and ALM platform vendors | Medium | Medium | Global | Cross-sell and platform enhancement |
| Private equity firms | Medium | Medium | North America, Europe | Consolidation of risk analytics platforms |
| Venture capital investors | Medium | High | North America | Selective interest in AI-driven modeling |
Technology Enablement Analysis
| Technology Enabler | Impact on CAGR Forecast (~%) | Primary Function | Geographic Relevance | Adoption Timeline |
|---|---|---|---|---|
| Advanced statistical and econometric modeling engines | +3.5% | Deposit behavior forecasting | Global | Short to medium term |
| AI and machine learning for pattern recognition | +3.0% | Improved behavioral accuracy | North America, Europe | Medium term |
| Scenario analysis and stress testing tools | +2.4% | Liquidity risk management | Global | Medium term |
| Cloud-based treasury and modeling platforms | +2.0% | Scalability and flexibility | Global | Medium to long term |
| Integration with ALM, FTP, and liquidity systems | +1.5% | End-to-end risk visibility | North America, Europe | Long term |
Key Challenges
- Limited availability of clean and consistent historical deposit behavior data
- High model complexity making results difficult to interpret for business teams
- Sensitivity of models to sudden changes in customer behavior during market stress
- Regulatory scrutiny around model assumptions and validation processes
- Integration challenges with existing asset-liability management and treasury systems
Emerging Trends
In the Behavioral Deposit Modeling market, a clear trend is the adoption of real-time behaviour analysis to predict deposit flows and customer liquidity preferences. Financial institutions are increasingly using models that look at detailed patterns such as transaction frequency, seasonal income shifts, and response to interest changes to understand how and when deposits move.
This trend shifts focus from static historical snapshots to continuous learning, where models adjust with each customer interaction. Another emerging pattern is the linking of behavioural insights to product offers and retention strategies, enabling personalised communication that resonates with individual customer needs rather than broad population assumptions.
Growth Factors
A key growth factor behind this market is the rising emphasis on deposit stability and funding predictability as banks seek to manage liquidity more effectively amid changing economic conditions. Behavioural models help treasury and risk teams anticipate when customers may withdraw or shift funds, allowing more informed planning and reduced reliance on costly short-term funding.
Another important driver is the need to strengthen customer relationships through tailored engagement. By understanding customer deposit behaviour at a granular level, institutions can design savings incentives, retention actions, and personalised advice that help customers meet their financial goals, which in turn supports deeper loyalty and more stable deposit portfolios.
Competitive Analysis
The Behavioral Deposit Modeling market is led by established risk analytics and regulatory technology providers such as Moody’s Analytics, QRM, SAS Institute, Kamakura Corporation, Wolters Kluwer, IBM (Algorithmics), Oracle, S&P Global, FIS, and Fiserv.
These players compete on advanced behavioral models, regulatory credibility, and the ability to support interest rate risk and liquidity risk management. Their solutions are widely used by large banks that require accurate deposit behavior forecasting and strong alignment with supervisory expectations.
Specialized and advisory-focused providers including RiskSpan, AxiomSL, Promontory Financial Group, Novantas, and others compete through niche expertise and flexible implementation. Competition in this segment is driven by model transparency, scenario testing capability, and support for evolving regulatory guidance.
Top Key Players in the Market
- Moody’s Analytics, Inc.
- QRM (Quantitative Risk Management)
- SAS Institute, Inc.
- Kamakura Corporation
- Wolters Kluwer N.V.
- IBM Corporation (Algorithmics)
- Oracle Corporation
- Fiserv, Inc.
- FIS (Fidelity National Information Services, Inc.)
- RiskSpan, Inc.
- AxiomSL
- Promontory Financial Group (an IBM company)
- S&P Global, Inc.
- Novantas, Inc.
- Others
Future Outlook
The future outlook for the Behavioral Deposit Modeling Market is positive as banks and financial institutions seek a deeper understanding of customer savings and withdrawal patterns. Demand for behavioral deposit modeling solutions is expected to grow because these tools help predict deposit flows, improve liquidity planning, and support strategic decision-making.
Adoption of advanced analytics and data science techniques will enhance accuracy and forecasting capabilities. Growth can be attributed to the need for better risk management, regulatory compliance, and efficient balance sheet management. Overall, the market is expected to expand as institutions prioritize refined deposit behavior insights.
Recent Developments
- In December 2025, Kamakura Corporation’s one-month T-bill forwards hit six point two five percent in sims. Inverted yield probability peaks at twenty-five point four percent by 2040. Supports ERM with dynamic balance sheet projections.
- In March 2025, Kamakura Corporation SAS Weekly Treasury sim showed long-run one-month forwards up amid yield curve risks. Max recession signal at twenty-four point two percent probability. Updates default probabilities for credit portfolios weekly.
Report Scope
| Report Features | Description |
|---|---|
| Market Value (2025) | USD 1.3 Billion |
| Forecast Revenue (2035) | USD 4.0 Billion |
| CAGR(2025-2035) | 12.4% |
| Base Year for Estimation | 2024 |
| Historic Period | 2020-2024 |
| Forecast Period | 2025-2035 |
| Report Coverage | Revenue forecast, AI impact on Market trends, Share Insights, Company ranking, competitive landscape, Recent Developments, Market Dynamics and Emerging Trends |
| Segments Covered | By Component (Software, Services), By Deployment Mode (Cloud-based, On-premises), By Organization Size (Large Enterprises, Small and Medium-sized Enterprises (SMEs)), By Application (Balance Forecasting & Volatility Modeling, Interest Rate Risk Management (IRRBB), Others), By End-User (Retail Banks, Commercial Banks, Credit Unions) |
| Regional Analysis | North America – US, Canada; Europe – Germany, France, The UK, Spain, Italy, Russia, Netherlands, Rest of Europe; Asia Pacific – China, Japan, South Korea, India, New Zealand, Singapore, Thailand, Vietnam, Rest of Latin America; Latin America – Brazil, Mexico, Rest of Latin America; Middle East & Africa – South Africa, Saudi Arabia, UAE, Rest of MEA |
| Competitive Landscape | Moody’s Analytics, Inc., QRM (Quantitative Risk Management), SAS Institute, Inc., Kamakura Corporation, Wolters Kluwer N.V., IBM Corporation (Algorithmics), Oracle Corporation, Fiserv, Inc., FIS (Fidelity National Information Services, Inc.), RiskSpan, Inc., AxiomSL, Promontory Financial Group (an IBM company), S&P Global, Inc., Novantas, Inc., Others |
| Customization Scope | Customization for segments, region/country-level will be provided. Moreover, additional customization can be done based on the requirements. |
| Purchase Options | We have three licenses to opt for: Single User License, Multi-User License (Up to 5 Users), Corporate Use License (Unlimited Users and Printable PDF) |





























