Report Overview
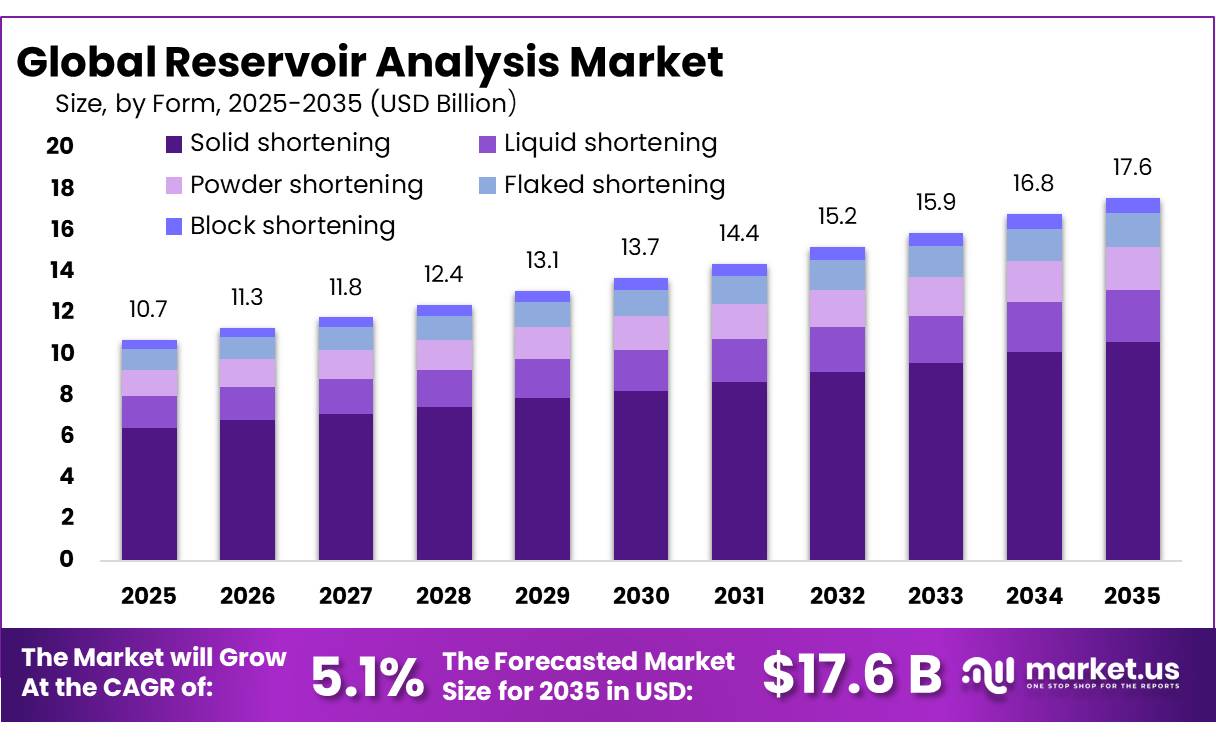
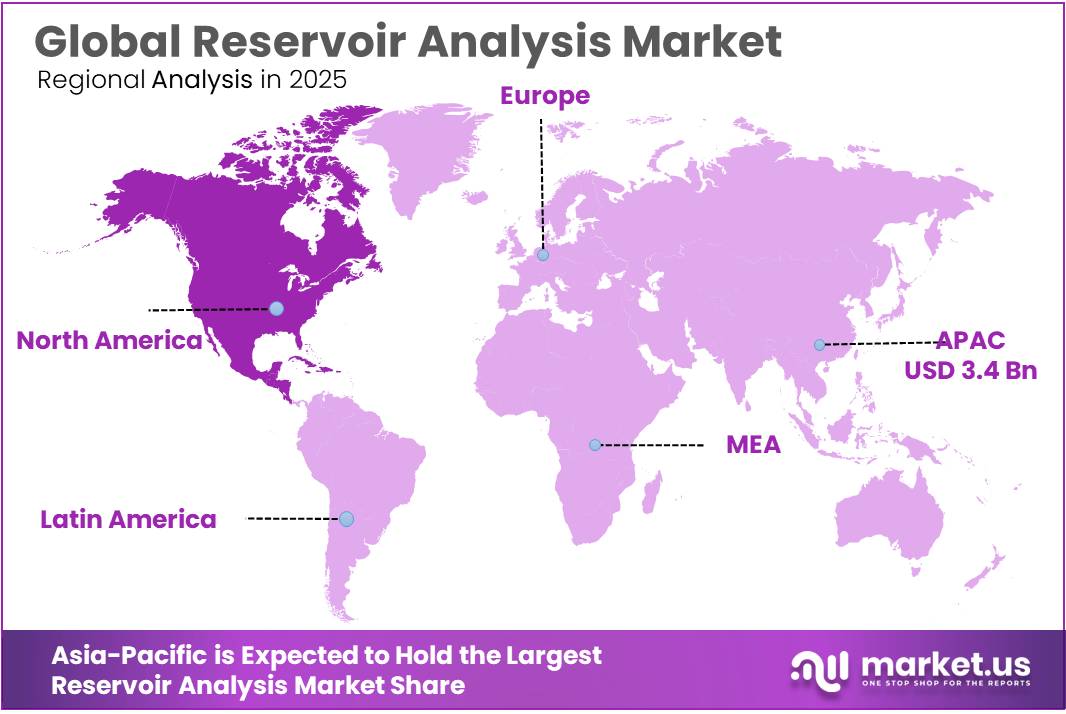
The Global Reservoir Analysis Market size is expected to be worth around USD 17.6 Billion by 2035, from USD 10.7 Billion in 2025, growing at a CAGR of 5.1% during the forecast period from 2026 to 2035. In 2025, Asia-Pacific held a dominant market position, capturing more than a 32.40% share, holding USD 3.4 Billion revenue.
Reservoir analysis is an important part of the global oil and gas industry, as it helps operators understand underground rock formations, fluid movement and hydrocarbon recovery potential. It involves the study of reservoir rocks, pressure, temperature, porosity, permeability, fluid composition and saturation levels. These evaluations help companies identify commercially productive reserves, estimate recoverable resources and improve field development decisions.
- The industrial scenario is closely linked to upstream oil and gas investment, exploration activity and the need to improve production from existing fields. Reservoir analysis is used across conventional oilfields, shale formations, deepwater projects, tight reservoirs and mature production assets. According to the International Energy Agency (IEA), global upstream oil and gas investment was expected to decline by approximately 4% in 2025, reaching just below USD 570 billion.
This investment environment has increased the importance of accurate reservoir evaluation, as operators seek to control development costs and improve returns from existing assets. The IEA also forecast global oil production capacity to increase by 5.1 million barrels per day, reaching 114.7 million barrels per day by 2030, creating continued requirements for reservoir assessment and production planning.
For example, SLB reports that its digital rock analysis technology can perform certain tests up to 100 times faster than conventional physical laboratory testing. The integration of physical core measurements with digital models also helps operators evaluate permeability, capillary pressure and fluid movement more efficiently.
Government initiatives related to carbon capture and storage (CCS) are creating additional opportunities for reservoir analysis companies. The US Department of Energy supports research into geological formations suitable for long-term carbon dioxide storage, including deep saline formations and depleted oil and gas reservoirs. The US Environmental Protection Agency’s Class VI well programme requires detailed geological site characterization, computational modelling, injection monitoring and long-term storage assessment.
The combination of artificial intelligence, real-time well data and advanced simulation can help operators improve production forecasting and reduce operational risks. Furthermore, the IEA projects global oil demand to increase by 2.5 million barrels per day between 2024 and 2030, reaching approximately 105.5 million barrels per day by the end of the decade.
Key Takeaways
- Reservoir Analysis Market size is expected to be worth around USD 17.6 Billion by 2035, from USD 10.7 Billion in 2025, growing at a CAGR of 5.1%.
- Vegetable-based held a dominant market position, capturing more than a 72.40% share.
- Solid shortening held a dominant market position, capturing more than a 60.00% share.
- Fractionation held a dominant market position, capturing more than a 28.00% share.
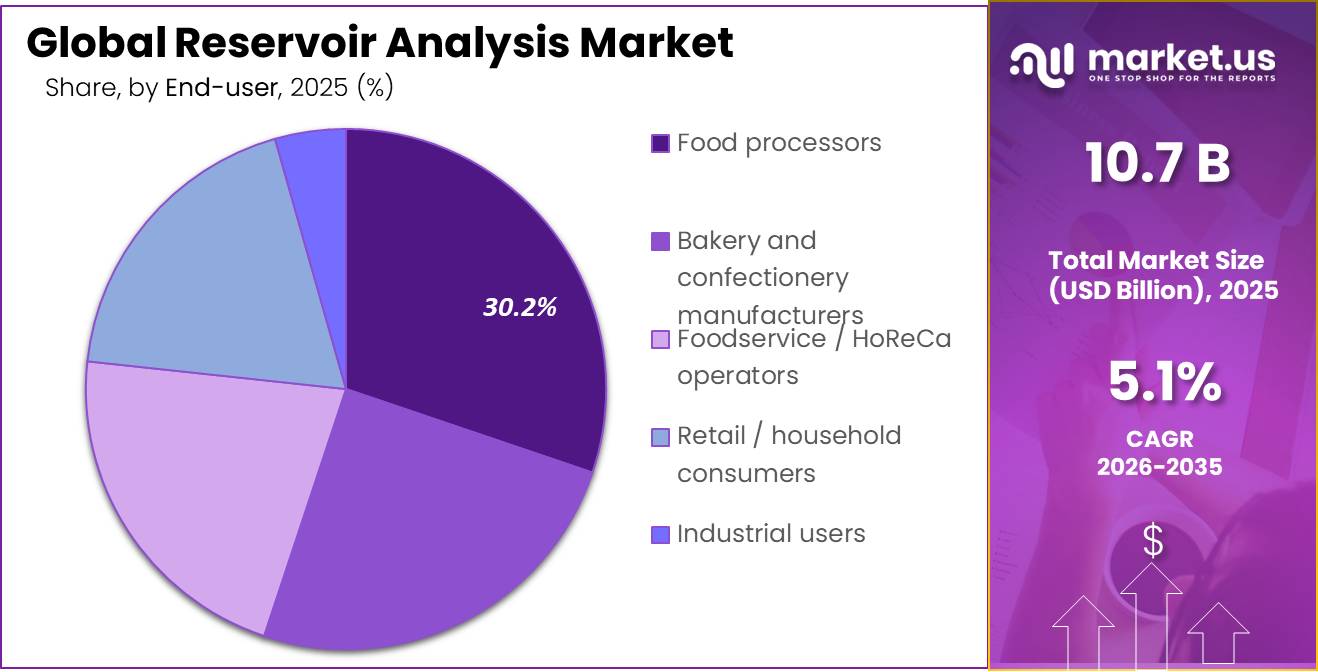
- Food processors held a dominant market position, capturing more than a 30.00% share.
- Direct sales / B2B held a dominant market position, capturing more than a 32.00% share.
- Asia-Pacific held a dominant position in the Reservoir Analysis Market, accounting for 32.40% of the market, with a value of USD 3.4 billion.
By Source Analysis
Vegetable-based – Dominant segment supported by growing global crop production
In 2025, “Vegetable-based” held a dominant market position, capturing more than a 72.40% share. However, this share is the supplied market figure and cannot be independently verified through government agricultural statistics. Vegetable-based ingredients benefit from the availability of plant-derived raw materials, wider applications in food processing and growing interest in plant protein products.
- According to the Food and Agriculture Organization (FAO), global oil crop production reached 1.2 billion tonnes in 2024, representing a 50% increase compared with 2010. Soybean production increased by 50% over the same period, supporting the availability of plant-based raw materials for food ingredient manufacturers. These developments support the wider supply chain for vegetable-derived protein ingredients and processing applications.
Animal-based ingredients remain important because of their established use in food processing, nutritional products and specialised protein applications. Their availability is supported by global meat, milk and poultry production, while their functional properties make them suitable for several industrial food applications.
According to FAO agricultural production statistics released in December 2025, global meat production reached 374 million tonnes in 2024, increasing by 7 million tonnes compared with 2023. Global milk production reached 985 million tonnes, of which cattle milk accounted for 797 million tonnes, representing 81% of total milk production.
By Form Analysis
Solid Shortening – Dominates due to its wide use in bakery and frying applications
In 2025, “Solid shortening” held a dominant market position, capturing more than a 60.00% share. Solid shortening is widely used in commercial bakeries, confectionery production and food preparation because it provides good texture, consistency, tenderness and structure. It helps manufacturers produce biscuits, cookies, cakes, pastries and other baked products with consistent quality. Its solid form also makes it suitable for applications that require controlled fat content and specific melting properties.
Liquid shortening is increasingly used in commercial food manufacturing because it can be pumped, stored and measured more easily than traditional solid shortening. It is suitable for industrial baking, frying, bread, cakes, rolls and other processed food applications. Its liquid consistency helps large food manufacturers simplify ingredient handling and maintain consistent production operations.
According to the Canadian Food Inspection Agency, liquid shortening is recognised as a separate food ingredient category for products that perform the function of shortening while remaining in liquid form. The USDA’s commercial shortening specification also identifies liquid shortening as a distinct product type for deep-frying applications. These official classifications demonstrate its established role in commercial food processing. Its ease of handling and suitability for automated production systems support further adoption among industrial bakeries and food-service operators.
By Processing Method Analysis
Fractionation – Dominates through improved fat separation and product consistency
In 2025, “Fractionation” held a dominant market position, capturing more than a 28.00% share. Fractionation is widely used in edible oil processing because it separates fats into different fractions based on their melting properties. This allows manufacturers to obtain specific fat characteristics for bakery shortening, confectionery, frying oils and other processed food applications. The process helps improve product texture, stability and consistency without requiring chemical modification of the oil.
Palm oil is an important raw material for this process because its liquid and solid fractions serve different food manufacturing requirements. According to the Malaysian Palm Oil Board, Malaysia produced approximately 19.3 million tonnes of crude palm oil in 2025, supporting the availability of raw materials for downstream oil processing and fractionation. The wide use of fractionated fats in food manufacturing continues to support this processing method.
Hydrogenation is an established processing method used to modify the physical properties of vegetable oils by adding hydrogen to unsaturated fatty acids. It helps manufacturers improve melting behaviour, consistency and stability for selected food applications. The process is particularly relevant to shortening production, where specific texture and functional characteristics are required for baking and food preparation.
In 2025, the World Health Organization continued to support the global elimination of industrially produced trans fats, with a recommended limit of 2 grams of industrial trans fat per 100 grams of total fat in all foods. This regulatory and public-health focus is encouraging manufacturers to consider alternatives such as full hydrogenation, fractionation and interesterification when developing shortening products.
By End User Analysis
Food Processors – Dominates through large-scale ingredient consumption and diversified food production
In 2025, “Food processors” held a dominant market position, capturing more than a 30.00% share. Food processors represent an important end-user segment because they use shortening and speciality fats across packaged foods, ready-to-eat meals, bakery products, snacks and processed food applications. These manufacturers prefer functional ingredients that provide consistent texture, stability, shelf life and processing performance.
According to the US Bureau of Labor Statistics and Federal Reserve data, the US food manufacturing sector recorded an annual output of approximately USD 854.89 billion in 2025, compared with USD 838.50 billion in 2024, reflecting an increase in industrial production value. This large manufacturing base supports demand for speciality fats and shortening used in commercial food processing. The continued development of packaged and convenience foods is also encouraging processors to adopt ingredients that improve production efficiency and finished product quality.
Bakery and confectionery manufacturers use shortening in cakes, biscuits, cookies, pastries, chocolates and other products because it improves softness, texture, structure and mouthfeel. Solid shortening is particularly useful in bakery applications that require controlled dough consistency and stable product quality.
According to the US Census Bureau’s 2024 Annual Integrated Economic Survey, the bakeries and tortilla manufacturing industry recorded approximately USD 90.33 billion in sales and employed around 318,282 people. The same official data reported approximately USD 47.08 billion in sales for the sugar and confectionery manufacturing industry. These figures demonstrate the significant scale of commercial bakery and confectionery production and its importance as an end-user market for speciality fats.
By Distribution Channel Analysis
Direct Sales / B2B: Direct customer relationships support technical sales and customised reservoir analysis services
In 2025, “Direct sales / B2B” held a dominant market position, capturing more than a 32.00% share of the Reservoir Analysis Market. This channel benefits from direct engagement between reservoir analysis providers and oil and gas operators, which often require specialised services such as reservoir modelling, fluid characterisation, core analysis and production forecasting. Direct contracts allow service providers to understand project requirements, share technical findings with customer teams and provide ongoing support during exploration and production activities.
This approach is particularly relevant for complex projects where data security, technical accuracy and customised analysis are important. Government statistics provide a useful picture of the industry’s scale: the U.S. Census Bureau reported USD 370.58 billion in 2024 revenue for the oil and gas extraction industry, with annual payroll of USD 15.08 billion. These figures indicate the scale of the customer industry, although they do not measure direct B2B sales specifically.
Distributors and wholesalers play a supporting role in the Reservoir Analysis Market by connecting technology suppliers, equipment manufacturers and oil and gas companies. They help provide access to laboratory instruments, testing equipment, sensors, data collection systems and related technical products. This channel can support customers that prefer to purchase through established regional suppliers or require local product availability and after-sales assistance.
In 2025, the U.S. Bureau of Labor Statistics recorded 30,324 private industry establishments across the broader mining, quarrying and oil and gas extraction sector in the fourth quarter. The figure indicates a wide industrial customer base that may create opportunities for equipment distributors and specialist suppliers. However, it does not represent the number of reservoir analysis distributors or wholesalers, and no verified government statistic was found that separately measures this distribution channel.
Key Market Segments
By Source
- Vegetable-based
- Animal-based
- Blended / mixed-source
By Form
- Solid shortening
- Liquid shortening
- Powder shortening
- Flaked shortening
- Block shortening
By Processing Method
- Fractionation
- Hydrogenation
- Interesterification
- Edible-oil blending / processing
By End User
- Food processors
- Bakery and confectionery manufacturers
- Foodservice / HoReCa operators
- Retail / household consumers
- Industrial users
By Distribution Channel
- Direct sales / B2B
- Distributors and wholesalers
- Supermarkets and hypermarkets
- Convenience stores
- Speciality stores
- Online retail
- Other retail channels
Driver Analysis
Mature-Field Recovery Optimization
Declining output from existing fields sustains demand for updated reservoir models, fluid characterization, pressure analysis and recovery studies because operators must decide where additional wells, water injection or workovers will preserve commercially recoverable production.
The IEA’s September 2025 decline-rate assessment, based on approximately 15,000 fields, finds observed annual post-peak declines averaging 5.6% for conventional oil and 6.8% for conventional gas; it estimates that nearly 90% of annual upstream investment since 2019 has offset declining supply rather than met demand growth. Those statistics describe upstream activity, not reservoir-analysis spending, and observed decline rates must not be confused with the steeper decline that would occur without investment.
In an illustrative field initially producing 100,000 barrels/day, reducing an assumed first-year decline from 6% to 5% preserves 1,000 barrels/day of year-end production; assuming the difference develops approximately linearly, average first-year incremental output is about 500 barrels/day, or 182,500 barrels. At an assumed $25/barrel contribution before incremental intervention costs, that represents approximately $4.56 million—not a benefit attributable to analysis alone.
Reservoir-analysis suppliers capture value through repeated surveillance, history matching and intervention ranking rather than one-off static models, while operators must validate outcomes against actual pressure and production responses. The +1.1 pp contribution assumes 22% revenue exposure grows 5 percentage points faster through additional conventional-field optimization work, excluding offshore development packages and incremental software adoption allocated separately.
Drivers Impact Analysis
| Driver | (~) % Impact on CAGR Forecast | Geographic Relevance | Impact Timeline |
|---|---|---|---|
| Mature-field recovery optimization | +1.1 pp | Gulf, North Sea, China, Southeast Asia | Short term (≤ 2 years) |
| Offshore development complexity | +0.9 pp | Norway, Brazil, Guyana, West Africa | Medium term (2–4 years) |
| Unconventional well optimization | +0.7 pp | US, Canada, Argentina | Short term (≤ 2 years) |
| Recurring digital reservoir workflows | +0.6 pp | US, Gulf, EU, Brazil | Short term (≤ 2 years) |
| Geological CO₂ storage appraisal | +0.5 pp | Norway, US, UK, Saudi Arabia | Medium term (2–4 years) |
Restraint Analysis
Discretionary Study-Budget Cuts
Reservoir-analysis spending is constrained when operators protect near-term production expenditure while reducing optional reinterpretation, appraisal or development-alternative studies, even though the underlying need to manage decline remains. SLB’s 2025 results provide a broader service-sector indicator: excluding ChampionX, full-year company revenue declined 6%, while Digital revenue increased 7%, demonstrating that software and field-service demand can diverge.
Its second-quarter 2025 Reservoir Performance revenue fell 7% year on year to $1.691 billion, principally reflecting lower activity in Saudi Arabia, Namibia and Mexico, partially offset by stronger Argentine stimulation activity. That segment includes stimulation and intervention and must not be treated as the size or growth rate of the narrowly defined reservoir-analysis market.
In an illustrative annual customer program containing $20 million of essential surveillance and $10 million of discretionary studies, cutting discretionary scope by 30% reduces external procurement by $3 million, or 10% of the combined budget. If suppliers initially carry a 35% contribution margin on that work, $1.05 million of contribution disappears before overhead adjustments; this is a scenario, not a reported supplier margin.
Vendors should distinguish approved work orders from unsanctioned study requests and avoid maintaining specialist capacity against uncommitted opportunities. The −0.6 pp contribution assumes 20% revenue exposure grows 3 percentage points more slowly through customer scope reductions, excluding data-access interruptions and insourcing. A strong mature-field driver therefore does not imply that every proposed reservoir study receives funding.
Restraint Impact Analysis
| Restraint | (~) % Impact on CAGR Forecast | Geographic Relevance | Impact Timeline |
|---|---|---|---|
| Discretionary study-budget cuts | −0.6 pp | US, Mexico, Saudi Arabia, Namibia | Short term (≤ 2 years) |
| Disrupted field-data acquisition | −0.4 pp | Middle East operating corridors | Short term (≤ 2 years) |
| Open-source licence substitution | −0.3 pp | Norway, EU, US | Medium term (2–4 years) |
| Internalized reservoir workflows | −0.3 pp | Norway, EU, Gulf operators | Medium term (2–4 years) |
| Deferred CO₂-storage commitments | −0.3 pp | US, EU, UK | Medium term (2–4 years) |
Opportunity Analysis
Geothermal Reservoir Engineering
Next-generation geothermal development provides an adjacent market for coupled thermal-flow modeling, fracture characterization, injectivity assessment and thermal-breakthrough forecasting, allowing subsurface specialists to monetize capabilities outside hydrocarbon production.
The IEA’s December 2024 geothermal assessment estimates that up to 80% of geothermal-project investment involves skills and capacity transferable from oil and gas; under substantial technology improvements and cost reductions, it identifies potential deployment of up to 800 GW by 2050 and cumulative geothermal investment approaching $1 trillion by 2035. These are conditional sector-wide scenarios—not reservoir-analysis TAM, a 2031 deployment forecast or evidence that conventional oil-reservoir models can be used without modification.
The untapped opportunity is qualification for additional geothermal projects and specialist thermal workflows, rather than ordinary hydrocarbon digitalization. In an illustrative service portfolio of 30 funded projects purchasing $750,000 of eligible reservoir work each, potential orders total $22.5 million. If developing a reusable thermal-geomechanical platform and application team costs an assumed $3 million, a 35% contribution margin requires approximately 12 comparable project wins to recover that investment before ongoing overhead and financing.
Actual recovery depends on project timing and reuse of qualified methods. Suppliers should partner with geothermal developers and distinguish enhanced geothermal systems from closed-loop designs that may require different reservoir-analysis intensity. The +0.40 pp contribution assumes adjacent revenue equivalent to 8% of the starting market grows 5 percentage points faster than baseline; it is included only under the explicitly broadened scope.
Opportunity Impact Analysis
| Opportunity | (~) % Potential CAGR Upside | Geographic Relevance | Execution Window |
|---|---|---|---|
| Geothermal reservoir engineering | +0.40 pp | US, Germany, Türkiye, Indonesia | Medium term (2–4 years) |
| Porous hydrogen-storage appraisal | +0.25 pp | Germany, Austria, Netherlands, UK | Long term (≥ 4 years) |
| Managed open-source analysis | +0.30 pp | US independents, Latin America, Southeast Asia | Short term (≤ 2 years) |
| Independent model assurance | +0.25 pp | Norway, UK, US, Gulf | Short term (≤ 2 years) |
| Outcome-linked optimization contracts | +0.20 pp | Gulf, North Sea, Southeast Asia | Medium term (2–4 years) |
Challenges Analysis
Fragmented Subsurface Data Lineage
Reservoir studies must reconcile production allocations, pressure surveys, well identifiers, completion histories, core measurements and geological interpretations created under different conventions and ownership arrangements, making data preparation a recurring delivery burden rather than a one-time migration exercise.
SLB’s October 2026 Lumi documentation identifies siloed, duplicated and inaccessible subsurface data and describes validation, duplicate detection, mastering, lineage and OSDU-aligned interoperability as responses; its Petrel reservoir-engineering guidance separately emphasizes keeping production, well and completion data current. These are supplier descriptions of the problem and available capabilities—not an independently measured industry-wide productivity loss.
In an illustrative 200-well asset with 15 years of monthly production history, the basic dataset contains 36,000 well-month records before separating oil, gas, water and injection streams. If 3% require reconciliation and each takes 20 minutes, the work consumes 360 analyst-hours, costing $54,000 at an assumed fully burdened $150/hour before geological-data review. Automated loading does not resolve whether units, reference depths or allocation methods are physically comparable.
Suppliers and operators need authoritative identifiers, unit dictionaries, source provenance and explicit ownership of corrections rather than repeatedly repairing spreadsheets inside individual studies. The −0.30 pp contribution assumes 15% revenue exposure grows 2 percentage points more slowly through repeated preparation and acceptance work; it excludes field measurements unavailable because of physical operating disruption and counts interoperability work only where directly attributable to reservoir analysis.
Challenges Impact Analysis
| Challenge | (~) % CAGR Friction Drag | Geographic Relevance | Mitigation Horizon |
|---|---|---|---|
| Fragmented subsurface data lineage | −0.30 pp | US, Gulf, North Sea, Brazil | Medium term (2–4 years) |
| Non-unique history matching | −0.30 pp | Gulf, North Sea, China, Southeast Asia | Long term (≥ 4 years) |
| Simulation convergence and scaling | −0.25 pp | US, Brazil, Gulf, Norway | Medium term (2–4 years) |
| Fluid-model calibration consistency | −0.25 pp | Gulf, US, Norway, CO₂-storage hubs | Medium term (2–4 years) |
| Model-version validation discipline | −0.20 pp | EU, US, Gulf, Latin America | Long term (≥ 4 years) |
Geopolitical Impact Analysis
Impact of the Middle East War on the Reservoir Analysis Market
The ongoing Middle East war in 2026 has increased uncertainty across the Reservoir Analysis Market by disrupting oil and gas production, shipping routes and investment decisions. Damage to energy infrastructure and interruptions around the Strait of Hormuz have created operational challenges for exploration and production companies. These conditions are increasing the need for reservoir analysis to assess field performance, estimate recoverable reserves and plan production restarts safely.
Reservoir modelling and pressure analysis are also becoming important for operators managing mature fields that depend on water or gas injection. According to the International Energy Agency (IEA), global upstream oil and gas investment is expected to reach USD 546 billion in 2026, although spending decisions remain affected by regional risks and supply disruptions. The IEA also reported that the conflict has caused major interruptions to energy trade flows.
Higher energy, transport and equipment costs may delay some exploration projects and increase operating expenses for service providers. However, the need to evaluate damaged assets, optimise existing wells and improve production efficiency may support demand for advanced reservoir analysis services.
Regional Insights
Dominating Region: Asia-Pacific
In 2025, Asia-Pacific held a dominant position in the Reservoir Analysis Market, accounting for 32.40% of the market, with a value of USD 3.4 billion. The region benefits from active oil and gas exploration, expanding offshore production and continued investment in existing oilfields. China, Malaysia, Indonesia and Australia remain important markets for exploration and production activities.
Reservoir analysis supports operators in evaluating underground formations, estimating recoverable reserves and improving well productivity. According to the International Energy Agency (IEA), Southeast Asia’s energy demand increased by more than 35% over the decade to 2025, while electricity demand grew by more than 60%. The region’s growing energy requirements and upstream development activities support the need for reliable reservoir evaluation and production planning.
The Middle East is expected to remain one of the fastest-growing regional markets as national oil companies continue investing in field development, production optimisation and advanced subsurface technologies. Saudi Arabia, the United Arab Emirates, Qatar and Iraq are increasing their focus on improving recovery from existing reservoirs while developing new oil and gas resources. Reservoir analysis is important for understanding complex formations, monitoring pressure changes and improving recovery rates.
The IEA estimated that the Middle East would invest approximately USD 130 billion in oil and gas supply in 2025, representing around 15% of global investment. Saudi Arabia alone was expected to invest approximately USD 40 billion in upstream oil and gas activities. These investments create opportunities for reservoir modelling, simulation and laboratory analysis providers.
Key Regions and Countries Insights
- North America
- US
- Canada
- Europe
- Germany
- France
- The UK
- Spain
- Italy
- Rest of Europe
- Asia Pacific
- China
- Japan
- South Korea
- India
- Australia
- Rest of APAC
- Latin America
- Brazil
- Mexico
- Rest of Latin America
- Middle East & Africa
- GCC
- South Africa
- Rest of MEA
Key Players Analysis
Cargill, Incorporated is a privately held global agribusiness company involved in agricultural commodities, food ingredients, animal nutrition and industrial products. The company operates in 70 countries, serves 125 markets and has approximately 155,000 employees worldwide. Its network includes around 1,000 locations, supported by more than 1,200 scientists and innovators and 200 research and development locations.
Archer Daniels Midland Company (ADM) is a major agricultural processing and nutrition company supplying products for food, animal feed, fuel and industrial applications. In 2025, ADM generated revenue of approximately USD 80.27 billion and reported 41,496 employees across its global operations. Its business is organised into 3 major segments, namely Ag Services and Oilseeds, Carbohydrate Solutions and Nutrition. The Ag Services and Oilseeds segment generated approximately USD 61.57 billion in revenue.
Bunge Limited is a global agribusiness company focused on oilseed processing, grain trading, vegetable oils and food ingredients. According to its 2025 annual report, the company employed approximately 34,000 people as of December 31, 2025. Its workforce was distributed across South America (43%), Europe, the Middle East and Africa (24%), North America (20%) and Asia-Pacific (13%). Bunge operates an international agricultural supply chain and processing network, supporting food manufacturers and industrial customers.
Top Key Players Outlook
- Cargill, Incorporated
- Archer Daniels Midland Company (ADM)
- Bunge Limited
- Wilmar International Limited
- AAK AB
- IFFCO Group
- Fuji Oil Holdings Inc.
- Olenex Sàrl
- Manildra Group
- Ventura Foods, LLC
- Associated British Foods plc (ABF)
- Conagra Brands, Inc. / Conagra Foodservice
- COFCO Group Co., Ltd.
- Namchow Holdings Co., Ltd.
- Palsgaard A/S
Recent Developments
- In June 2026, Wilmar announced a strategic 50:50 joint venture with TGI Group to combine their agricultural and food businesses in Nigeria and the Republic of Benin. The proposed venture covers oil palm plantations, edible oils, rice, food manufacturing and distribution, with an estimated addressable market of more than USD 12 billion across the targeted product categories.
- In 2025, IFFCO reported a standalone turnover of INR 41,244 crore, while the wider IFFCO Group recorded a turnover of INR 53,561 crore. During 2025–2026, IFFCO reported group turnover of INR 59,245.33 crore, representing growth from the previous financial year.
Report Scope
| Report Features | Description |
|---|---|
| Market Value (2025) | USD 10.7 Bn |
| Forecast Revenue (2035) | USD 17.6 Bn |
| CAGR (2026-2035) | 5.1% |
| Base Year for Estimation | 2025 |
| Historic Period | 2020-2024 |
| Forecast Period | 2026-2035 |
| Report Coverage | Revenue Forecast, Market Dynamics, Competitive Landscape, Recent Developments |
| Segments Covered | By Source (Vegetable-based, Animal-based, Blended / mixed-source), By Form (Solid shortening, Liquid shortening, Powder shortening, Flaked shortening, Block shortening), By Processing Method (Fractionation, Hydrogenation, Interesterification, Edible-oil blending / processing), By End User (Food processors, Bakery and confectionery manufacturers, Foodservice / HoReCa operators, Retail / household consumers, Industrial users), By Distribution Channel (Direct sales / B2B, Distributors and wholesalers, Supermarkets and hypermarkets, Convenience stores, Speciality stores, Online retail, Other retail channels) |
| Regional Analysis | North America – US, Canada; Europe – Germany, France, The UK, Spain, Italy, Rest of Europe; Asia Pacific – China, Japan, South Korea, India, Australia, Singapore, Rest of APAC; Latin America – Brazil, Mexico, Rest of Latin America; Middle East & Africa – GCC, South Africa, Rest of MEA |
| Competitive Landscape | Cargill, Incorporated, Archer Daniels Midland Company (ADM), Bunge Limited, Wilmar International Limited, AAK AB, IFFCO Group, Fuji Oil Holdings Inc., Olenex Sàrl, Manildra Group, Ventura Foods, LLC, Associated British Foods plc (ABF), Conagra Brands, Inc. / Conagra Foodservice, COFCO Group Co., Ltd., Namchow Holdings Co., Ltd., Palsgaard A/S |
| Customization Scope | Customization for segments, region/country-level will be provided. Moreover, additional customization can be done based on the requirements. |
| Purchase Options | We have three licenses to opt for: Single User License, Multi-User License (Up to 5 Users), Corporate Use License (Unlimited User and Printable PDF) |