


Report Overview
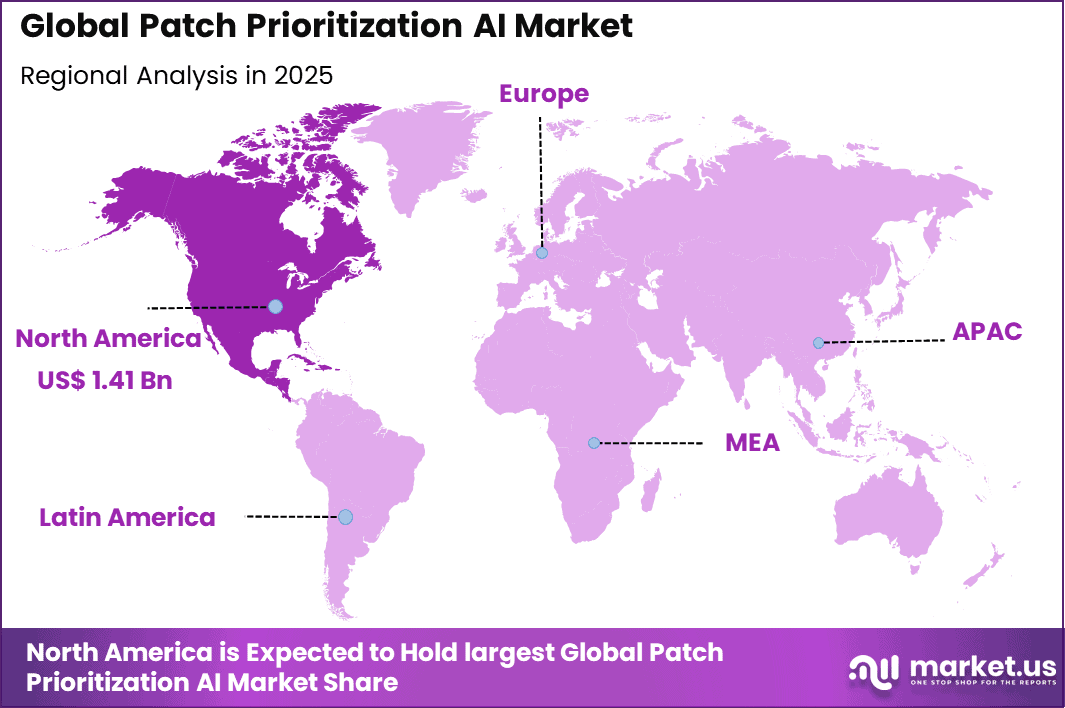
The Global Patch Prioritization AI Market generated USD 3.6 billion in 2025 and is predicted to register growth from USD 4.6 billion in 2026 to about USD 35.9 billion by 2035, recording a CAGR of 25.8% throughout the forecast span. In 2025, North America held a dominant market position, capturing more than a 39.2% share, with USD 1.41 billion in revenue.
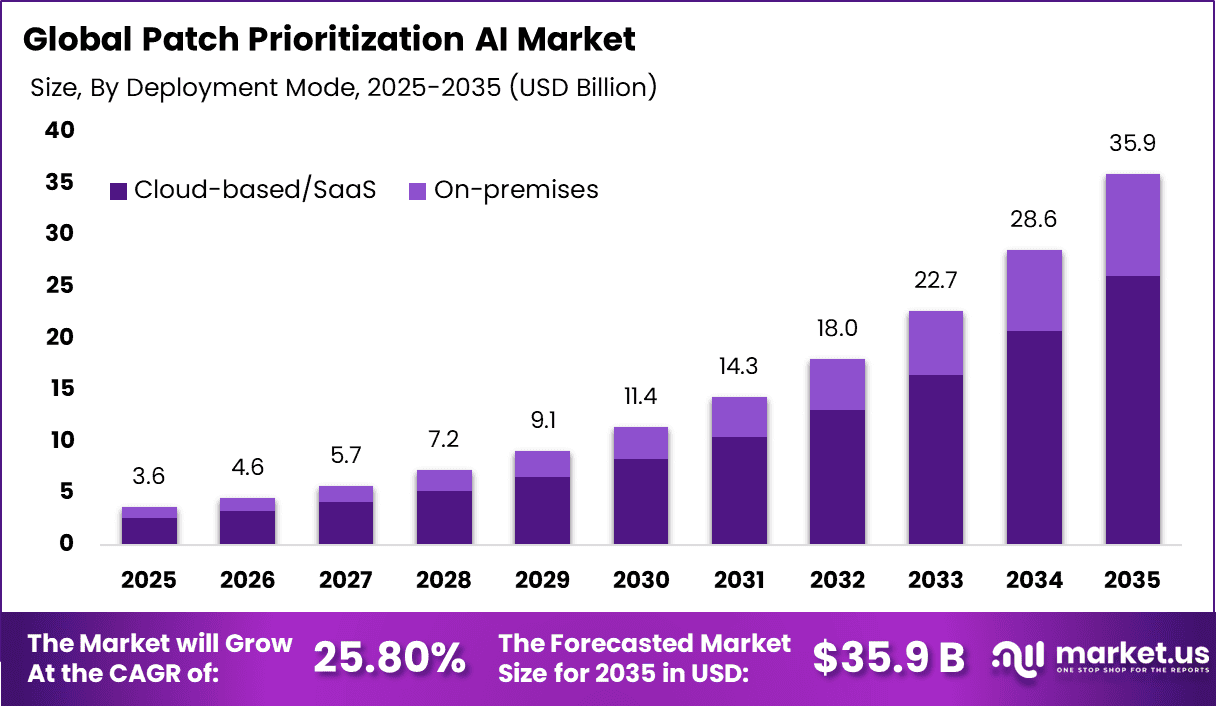
The patch prioritization AI market focuses on intelligent systems that analyze software vulnerabilities and rank them based on risk, exploit likelihood, and business impact. Traditional patch management often treats vulnerabilities with equal urgency, which can overwhelm security teams and delay response to critical threats.
AI-driven prioritization tools assess contextual factors such as asset value, exposure level, and threat intelligence signals. The market is shaped by organizations seeking structured and risk-based vulnerability management practices.
Growth in the patch prioritization AI market is supported by the broader adoption of automation in cybersecurity operations. Organizations are integrating risk scoring systems into security workflows to improve response speed and accuracy. Increasing regulatory scrutiny and board-level oversight on cyber resilience are also influencing adoption.
Top Market Takeaways
- By component, software/solutions account for 78.4% of the market, leveraging machine learning to score patches by exploitability, business impact, and asset criticality.
- By deployment mode, cloud-based/SaaS represents 72.6%, offering automated scanning, risk-based queuing, and seamless integration with ITSM workflows.
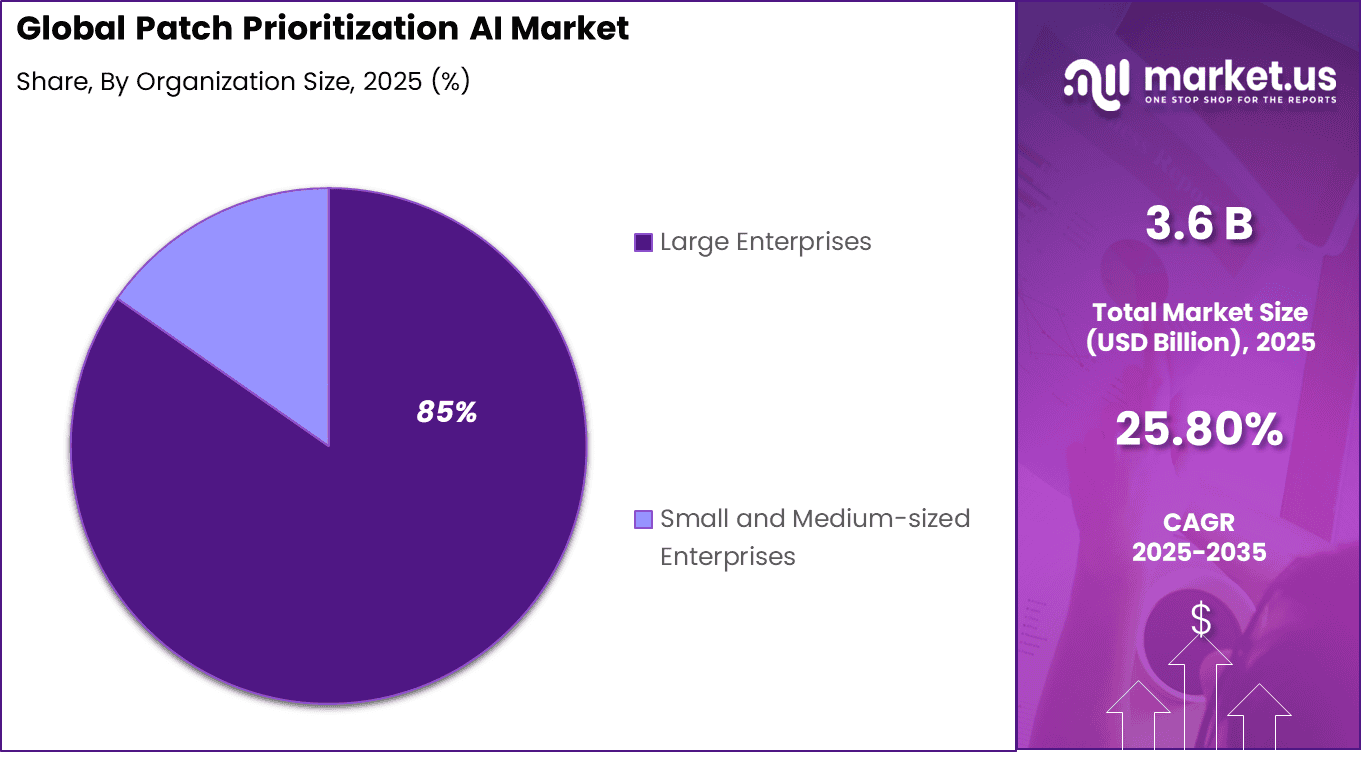
- By organization size, large enterprises hold an 84.7% share, managing thousands of vulnerabilities across hybrid environments with limited security teams.
- By end-user industry, IT & telecommunications capture 41.8%, prioritizing patches for network infrastructure, 5G core systems, and customer-facing platforms.
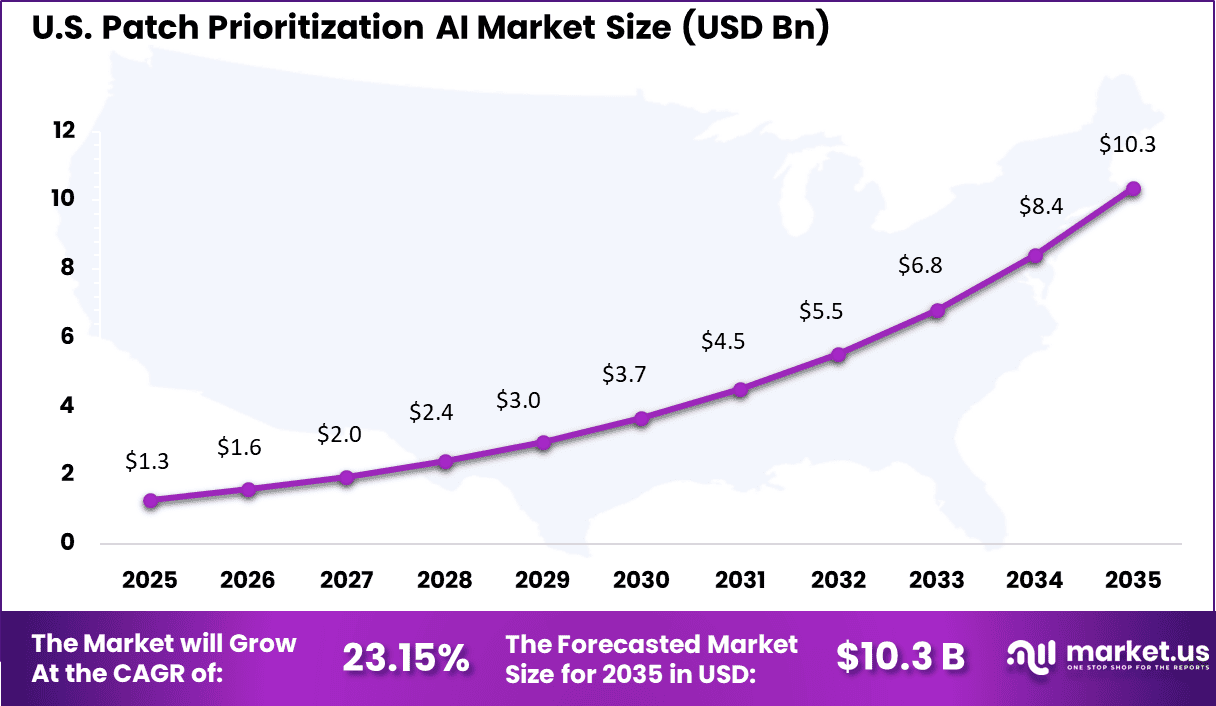
- North America leads with 39.2% of the global market, where the U.S. is valued at USD 1.29 billion with a projected CAGR of 23.15%, fueled by regulatory pressures and cyber insurance requirements.
By Component
Software and solution-based offerings account for 78.4% of adoption in the patch prioritization AI market, as organizations require intelligent platforms to assess and rank vulnerabilities. These systems analyze threat intelligence, asset criticality, and exploit likelihood to determine which patches should be applied first. This structured prioritization helps security teams focus on high-risk exposures.
Automated platforms also reduce reliance on manual vulnerability review processes. By integrating with existing security tools, AI-driven solutions provide continuous risk scoring. This functionality continues to position software solutions as the dominant component.
By Deployment Mode
Cloud-based and SaaS deployment holds 72.6%, reflecting the need for rapid scalability and frequent updates. Threat landscapes evolve quickly, and cloud platforms enable continuous model refinement without infrastructure constraints. This ensures that prioritization logic remains aligned with emerging risks.
SaaS models also simplify integration with distributed IT environments. Security teams benefit from centralized dashboards and remote accessibility. These operational advantages reinforce cloud preference.
By Organization Size
Large enterprises represent 85% of adoption due to their extensive and complex IT infrastructures. These organizations manage thousands of assets across networks and cloud environments. AI-driven prioritization helps reduce patch backlog and operational strain.
Large firms also face strict compliance and audit requirements related to vulnerability management. Automated prioritization improves documentation and accountability. This sustains strong demand among enterprise-scale organizations.
By End User Industry
The IT and Telecommunications sector holds 41.8% of end user adoption, as network reliability and data security are critical operational priorities. Service providers manage large-scale infrastructure that must remain continuously available. Patch prioritization AI helps minimize downtime while addressing security risks.
Telecommunications environments also face frequent exposure to external threats. Intelligent patch management improves resilience and response speed. This continues to anchor the sector as a leading adopter of patch prioritization AI solutions.
Key Market Segments
By Component
- Software/Solutions
- Vulnerability Correlation & Scoring Engines
- Threat Intelligence Integration
- Business Context & Asset Criticality Analysis
- Remediation Workflow Automation
- Others
- Services
- Professional Services
- Managed Services
- Others
By Deployment Mode
- Cloud-based/SaaS
- On-premises
By Organization Size
- Large Enterprises
- Small and Medium-sized Enterprises (SMEs)
By End-User Industry
- IT & Telecommunications
- Banking, Financial Services, and Insurance (BFSI)
- Healthcare
- Government & Defense
- Retail & E-commerce
- Others
Regional Analysis
North America holds a 39.2% share of the patch prioritization AI market, supported by high cybersecurity spending and strong enterprise focus on vulnerability management. Organizations in the region are adopting AI-driven prioritization tools to assess exploit likelihood, business impact, and remediation urgency across complex IT environments. Demand is driven by rising cyber threats, expanding attack surfaces, and the need to reduce remediation backlogs without disrupting critical operations.
The United States market is valued at USD 1.29 Bn and is expanding at a CAGR of 23.15%, reflecting rapid integration of AI within security operations workflows. Adoption is influenced by increasing vulnerability disclosures, limited cybersecurity staffing, and pressure to improve response times. Growth is further supported by stronger alignment between risk scoring models and business impact analysis, enabling organizations to focus remediation efforts on the most critical exposures.
Key Regions and Countries
- North America
- US
- Canada
- Europe
- Germany
- France
- The UK
- Spain
- Italy
- Russia
- Netherlands
- Rest of Europe
- Asia Pacific
- China
- Japan
- South Korea
- India
- Australia
- Singapore
- Thailand
- Vietnam
- Rest of APAC
- Latin America
- Brazil
- Mexico
- Rest of Latin America
- Middle East & Africa
- South Africa
- Saudi Arabia
- UAE
- Rest of MEA
Drivers Impact Analysis
| Key Driver | Impact on CAGR Forecast (~%) | Geographic Relevance | Impact Timeline |
|---|---|---|---|
| Rising volume of software vulnerabilities and CVE disclosures | +6.5% | North America, Europe | Short to medium term |
| Increasing complexity of enterprise IT and cloud environments | +5.8% | Global | Medium term |
| Growing adoption of AI-driven cybersecurity automation | +5.1% | North America, Asia Pacific | Medium term |
| Regulatory pressure for timely vulnerability remediation | +4.4% | Europe, North America | Medium term |
| Expansion of DevSecOps and continuous security practices | +3.7% | Global | Medium to long term |
Restraints Impact Analysis
| Key Restraint | Impact on CAGR Forecast (~%) | Geographic Relevance | Impact Timeline |
|---|---|---|---|
| Integration challenges with legacy IT and security tools | −4.3% | Global | Short to medium term |
| High implementation and subscription costs | −3.6% | Emerging Markets | Medium term |
| False positives and model accuracy concerns | −3.1% | Global | Medium term |
| Limited AI trust and explainability in security decisions | −2.7% | Europe, North America | Medium term |
| Shortage of skilled cybersecurity and AI professionals | −2.2% | Global | Medium to long term |
Investor Type Impact Matrix
| Investor Type | Growth Sensitivity | Risk Exposure | Geographic Focus | Investment Outlook |
|---|---|---|---|---|
| AI-driven cybersecurity platform providers | Very High | Medium | North America, Europe | Strong SaaS-based scalability |
| Cloud security vendors | High | Medium | Global | Integrated vulnerability management |
| Private equity firms | Medium | Medium | North America, Europe | Consolidation of security automation firms |
| Venture capital investors | Very High | High | North America | Innovation in AI-powered remediation |
| Strategic enterprise IT investors | Medium | Low to Medium | Global | Security infrastructure modernization |
Technology Enablement Analysis
| Technology Enabler | Impact on CAGR Forecast (~%) | Primary Function | Geographic Relevance | Adoption Timeline |
|---|---|---|---|---|
| Machine learning-based vulnerability risk scoring | +6.9% | Intelligent prioritization | Global | Short to medium term |
| Integration with CI/CD and DevSecOps pipelines | +5.8% | Continuous remediation | North America, Europe | Medium term |
| Real-time threat intelligence correlation engines | +5.0% | Contextual risk analysis | Global | Medium term |
| Automated patch deployment orchestration tools | +4.3% | Operational efficiency | Global | Medium to long term |
| Explainable AI and compliance reporting modules | +3.6% | Regulatory transparency | Europe, North America | Long term |
Key Challenges
- Difficulty in collecting accurate vulnerability and asset data for analysis
- High false positives reducing trust in AI-based recommendations
- Integration challenges with existing security and IT management tools
- Limited transparency in AI decision-making affecting compliance approval
- Resistance from IT teams relying on traditional patch management processes
Emerging Trends
In the Patch Prioritization AI market, a clear trend is the shift toward intelligent, risk-based ranking of software vulnerabilities, enabling security teams to decide what to fix first. Rather than treating all patches the same, systems are being designed to consider context such as system criticality, exploit likelihood, and past incident history when scoring vulnerabilities.
This trend reflects a deeper understanding that limited time and resources require teams to focus on the issues that matter most for safety and continuity. Another emerging pattern is the addition of human-readable explanations alongside risk scores, helping engineers and administrators understand why a patch is elevated in priority and what effects applying it may have on system stability.
Growth Factors
A key growth driver in this market is the increasing volume of vulnerabilities discovered each year, which can overwhelm internal teams if there is no systematic way to decide patch order. As software stacks grow more complex, with multiple vendors and interdependent components, organisations need tools that highlight where the greatest risk lies so they can act with clarity and confidence.
Another important driver is the demand for better coordination between security, operations, and development teams. When prioritization reflects a shared understanding of risk rather than isolated lists, teams can plan patches in a way that balances safety with uptime and user experience. These needs are encouraging adoption of AI-enabled approaches that reduce manual effort and strengthen organisational trust in patch decisions.
Competitive Analysis
The Patch Prioritization AI market is led by established cybersecurity and vulnerability management providers such as Tenable Holdings, Qualys, Rapid7, Kenna Security, Brinqa, NopSec, Risk Based Security, Skybox Security, Balbix, Vulcan Cyber, Microsoft, IBM, Fortra, Ivanti, and ServiceNow.
These companies compete on risk-based scoring models, integration with existing security tools, and the ability to analyze large volumes of vulnerability data. Their platforms are widely used by enterprises that require structured patch management processes and clear visibility into high-risk exposures.
Competition in this market is driven by accuracy in risk ranking, reduction of false priorities, and faster remediation workflows. Leading players focus on combining threat intelligence, asset criticality, and business context to guide security teams on which vulnerabilities to address first.
Top Key Players in the Market
- Tenable Holdings, Inc.
- Qualys, Inc.
- Rapid7, Inc.
- Kenna Security
- Brinqa, Inc.
- NopSec, Inc.
- Risk Based Security, Inc.
- Skybox Security, Ltd.
- Balbix, Inc.
- Vulcan Cyber, Ltd.
- Microsoft Corporation
- IBM Corporation
- Fortra, LLC
- Ivanti, Inc.
- ServiceNow, Inc.
- Others
Future Outlook
The future outlook for the Patch Prioritization AI Market is positive as organizations increasingly focus on improving cybersecurity and reducing risk. Demand for AI-based patch prioritization solutions is expected to grow because these tools help identify the most critical software vulnerabilities and speed up remediation.
Adoption of machine learning, automation, and real-time risk scoring will support more accurate and efficient patch management. Growth can be attributed to rising cyber threats, larger IT environments, and stronger regulatory requirements for security. Overall, the market is expected to expand as businesses prioritize intelligent and scalable vulnerability management.
Recent Developments
- In November 2025, Brinqa Inc. launched BrinqaIQ AI in Q3 with record bookings doubling the 2024 pace. Governed AI applies rule hierarchies for exposure analysis. Accelerates triage with confidence thresholds and traceability.
- In July 2025, Tenable Holdings Inc. launched AI-powered Vulnerability Priority Rating VPR isolating top 1.6 percent risks. Delivers explainability threat summaries and remediation guidance. Twice the precision over CVSS with industry context.
Report Scope
| Report Features | Description |
|---|---|
| Market Value (2025) | USD 3.6 Billion |
| Forecast Revenue (2035) | USD 35.9 Billion |
| CAGR(2025-2035) | 25.8% |
| Base Year for Estimation | 2024 |
| Historic Period | 2020-2024 |
| Forecast Period | 2025-2035 |
| Report Coverage | Revenue forecast, AI impact on Market trends, Share Insights, Company ranking, competitive landscape, Recent Developments, Market Dynamics and Emerging Trends |
| Segments Covered | By Component (Software/Solutions (Vulnerability Correlation & Scoring Engines, Threat Intelligence Integration, Others), Services (Professional Services, Managed Services, Others)), By Deployment Mode (Cloud-based/SaaS, On-premises), By Organization Size (Large Enterprises, Small and Medium-sized Enterprises), By End-User Industry (IT & Telecommunications, Banking, Financial Services, and Insurance, Others) |
| Regional Analysis | North America – US, Canada; Europe – Germany, France, The UK, Spain, Italy, Russia, Netherlands, Rest of Europe; Asia Pacific – China, Japan, South Korea, India, New Zealand, Singapore, Thailand, Vietnam, Rest of Latin America; Latin America – Brazil, Mexico, Rest of Latin America; Middle East & Africa – South Africa, Saudi Arabia, UAE, Rest of MEA |
| Competitive Landscape | Tenable Holdings, Inc., Qualys, Inc., Rapid7, Inc., Kenna Security, Brinqa, Inc., NopSec, Inc., Risk Based Security, Inc., Skybox Security, Ltd., Balbix, Inc., Vulcan Cyber, Ltd., Microsoft Corporation, IBM Corporation, Fortra, LLC, Ivanti, Inc., ServiceNow, Inc., Others |
| Customization Scope | Customization for segments, region/country-level will be provided. Moreover, additional customization can be done based on the requirements. |
| Purchase Options | We have three licenses to opt for: Single User License, Multi-User License (Up to 5 Users), Corporate Use License (Unlimited Users and Printable PDF) |





























