


Report Overview
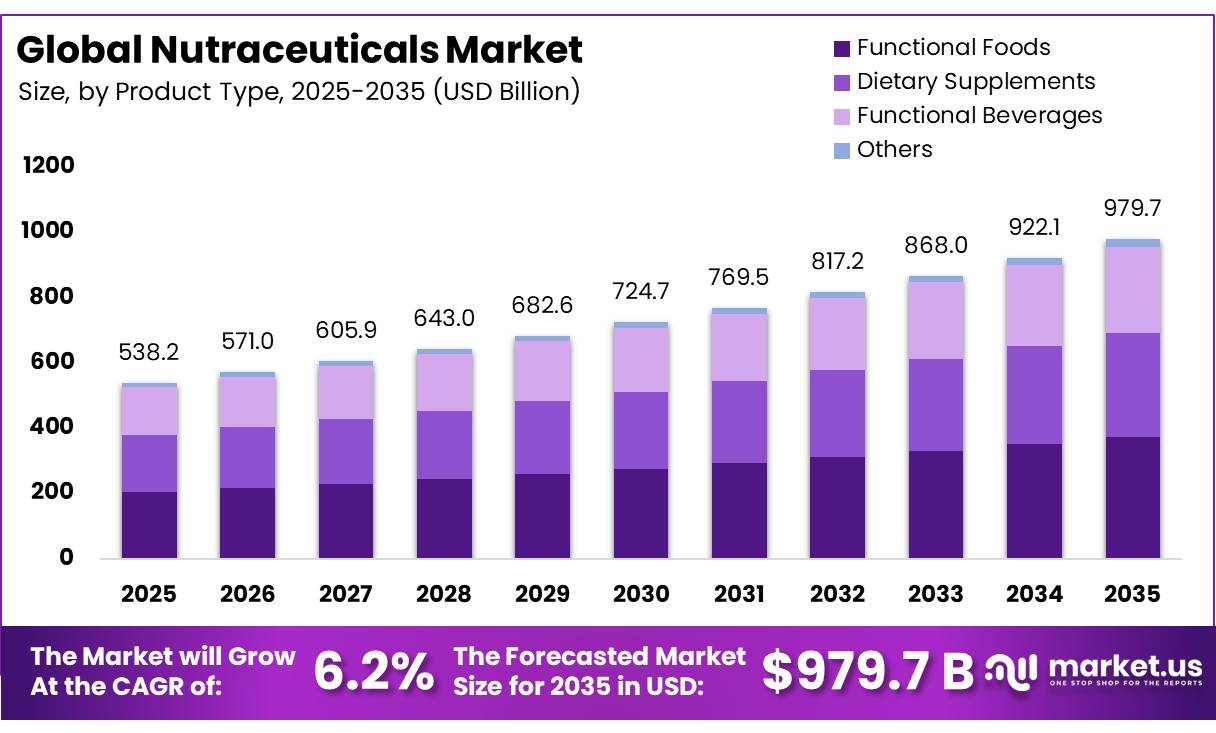
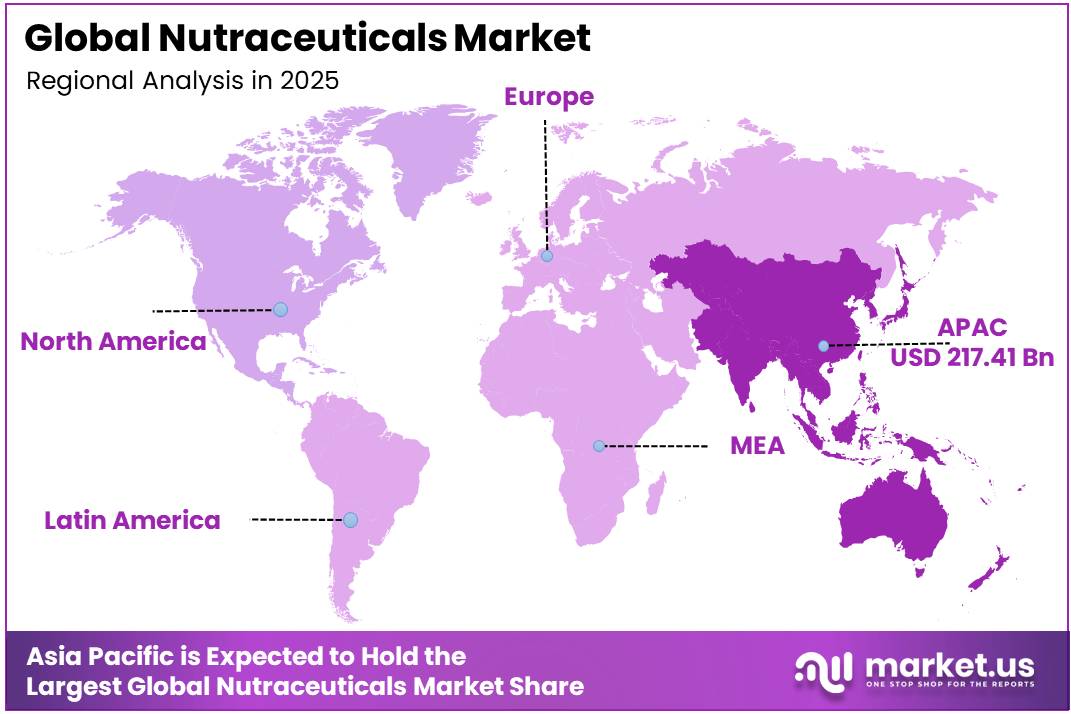
In 2025, the Global Nutraceuticals Market was valued at US$538.2 billion, and between 2026 and 2035, this market is estimated to register a CAGR of 6.2%, reaching about US$979.7 billion by 2035. Asia Pacific held a dominant market position, capturing more than a 40.4% share, holding USD 217.41 billion in revenue.
The nutraceuticals industry sits between conventional food and preventive health, covering dietary supplements, fortified foods, probiotics, botanicals, and functional ingredients. Demand is supported by consumers seeking convenient nutrition, ageing, immunity support, digestive wellness, and improved nutrient intake.
- In May 2026, the United States Centers for Disease Control and Prevention reported that 2% of adults and 35.7% of people aged 0 to 19 used a dietary supplement during August 2021 to August 2023.
Key Takeaways
- The global nutraceuticals market was valued at US$538.2 billion in 2025.
- The global nutraceuticals market is projected to grow at a CAGR of 6.2% and is estimated to reach US$979.7 billion by 2035.
- On the basis of product type, functional foods dominated the nutraceuticals market, constituting 38.0% of the total market share.
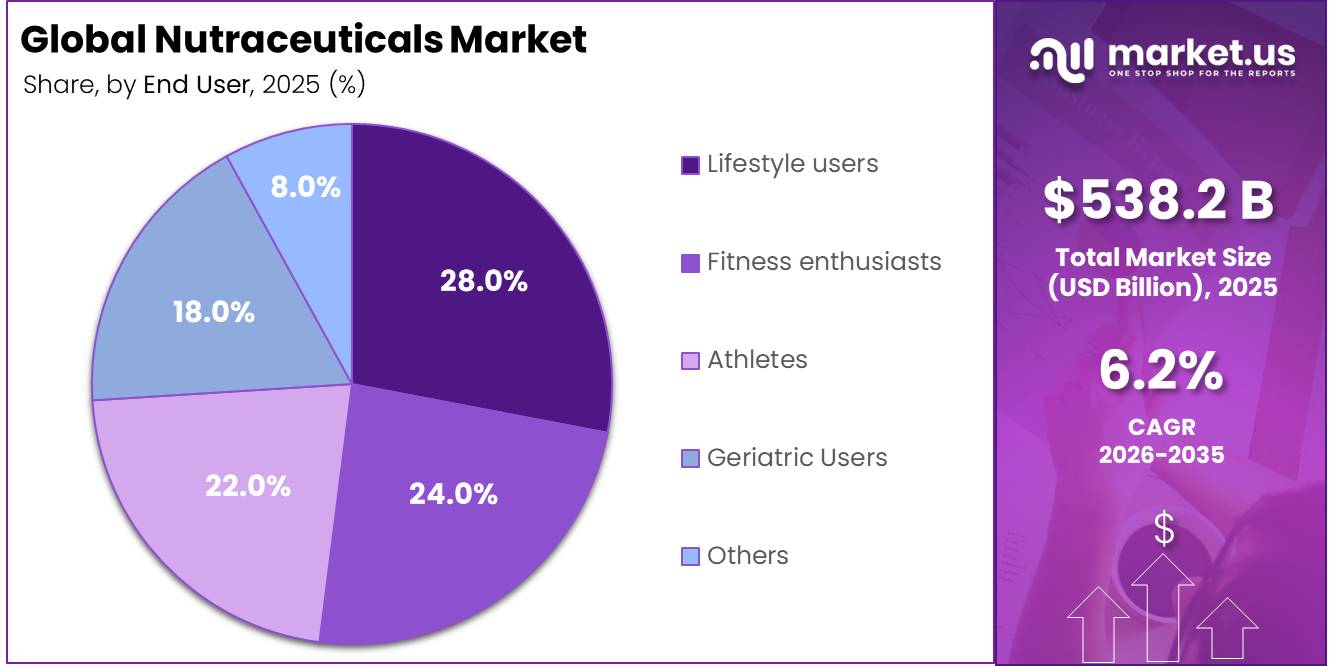
- Based on end user, lifestyle users dominated the nutraceuticals market, accounting for 28.0% of the total market share.
- Based on functional claim, high/added fiber led the market, comprising 26.8% of the total market share.
- Among the distribution channels, supermarkets/hypermarkets held a major share in the nutraceuticals market, accounting for 43.0% of the market share.
- In 2025, Asia Pacific was the most dominant region in the nutraceuticals market, accounting for 40.4% of the total market share and generating revenue of US$217.41 billion.
The industrial landscape includes ingredient processors, contract manufacturers, food companies, pharmacies, retailers and digital platforms. Product development increasingly focuses on traceable ingredients, clinically supported formulations, personalized nutrition, clean labels, and convenient formats such as gummies, powders, drinks, and capsules. In March 2024, the United States Food and Drug Administration stated that the domestic dietary supplement sector exceeded US$60 billion, offered as many as 100,000 products, and served approximately 75% of Americans.
Growth is reinforced by widespread nutrition challenges and rising concern over chronic disease. In March 2024, the World Health Organization reported that 2.5 billion adults were overweight in 2022, including 890 million living with obesity, while 390 million were underweight. These conditions encourage demand for scientifically formulated products supporting weight management, micronutrient adequacy, metabolic health, and healthy ageing. Opportunities are expanding in probiotics, plant proteins, omega fatty acids, sports nutrition, women’s health, and condition-specific formulations.
Government initiatives are simultaneously raising safety standards and improving innovation pathways. The European Food Safety Authority reports that more than 200 novel foods are approved for sale in the European Union, creating a regulated route for new functional ingredients. Updated European Food Safety Authority guidance began applying to novel-food applications submitted from February 2025. In February 2026, the United States Food and Drug Administration identified dietary-supplement oversight modernization as a Human Foods Program priority, supporting stronger enforcement, compliance, and responsible industry development.
Product Type Analysis
Functional Foods Lead Through Everyday Nutrition and Convenience
In 2025, Functional Foods held a dominant market position, capturing more than a 38.0% share. The segment remained strong because consumers increasingly preferred foods that offered added nutritional value without changing their daily eating habits. Dairy products, breakfast cereals, snacks, baby food, and other fortified items benefited from regular household use and broad retail availability. In December 2025, manufacturers continued to improve taste, ingredient quality, clean-label positioning, and convenient formats to attract health-conscious buyers.
Dietary Supplements emerged as the growing product segment as consumers sought targeted nutrition in simple and portable formats. In January 2026, demand increased across vitamins, minerals, enzymes, fatty acids, and proteins. The segment gained support from preventive health awareness, active lifestyles, ageing populations, and greater interest in personalised nutrition. Easy access through pharmacies, supermarkets, specialist stores, and online channels further helped consumers compare products more easily and select supplements suited to specific wellness goals.
End User Analysis
Lifestyle Users Lead Through Everyday Wellness Choices
In 2025, Lifestyle users held a dominant market position, capturing more than a 28.0% share. The segment benefited from rising interest in wellness, balanced nutrition, immunity support, and healthy ageing. Consumers increasingly included vitamins, minerals, proteins, functional foods, and fortified beverages in their regular routines rather than using them only for specific health concerns. In December 2025, demand remained strong among working adults and households seeking products that fit busy schedules.
Fitness enthusiasts emerged as the growing end-user segment as more consumers focused on strength, recovery, endurance, and active living. In January 2026, demand increased for protein-rich products, amino acid blends, hydration products, and performance-focused supplements. The segment also gained from gym participation, home workouts, wearable fitness tracking, and social media influence. Products offering convenient nutrition before or after exercise became more popular, supporting growth across occasional and regular fitness users.
Functional Claim Analysis
High/Added Fiber Leads as Digestive Wellness Shapes Everyday Nutrition
In 2025, High/Added Fiber held a dominant market position, capturing more than a 26.8% share. The segment benefited from stronger consumer attention to digestive health, satiety, weight control, and balanced eating. Fiber-enriched cereals, bakery products, snacks, beverages, dairy products, and nutrition bars became more common in daily diets because they offered familiar formats with added health value. In December 2025, manufacturers continued to improve taste, texture, and ingredient quality while using clear labels to explain fiber content and digestive benefits.
Vitamin/Mineral Fortified products emerged as the growing functional claim segment as consumers looked for simple ways to improve nutrient intake. In January 2026, fortified beverages, cereals, dairy products, snacks, and supplements gained wider interest across different age groups. The segment benefited from rising awareness of nutrient gaps, immunity, bone health, energy support, and healthy ageing. Product innovation, convenient formats, and wider retail availability helped strengthen consumer acceptance and supported continued expansion across everyday food and wellness categories.
Distribution Channel Analysis
Supermarkets and Hypermarkets Lead Through Broad Choice and Easy Access
In 2025, Supermarkets/Hypermarkets held a dominant market position, capturing more than a 43.0% share. The segment remained strong because consumers could compare dietary supplements, functional foods, fortified beverages, and wellness products in one location. In December 2025, large retail stores continued to attract buyers through broad product ranges, visible shelf placement, promotional offers, and trusted brands. Their established supply networks also supported regular product availability across urban and suburban areas.
Online Retail emerged as the growing distribution channel as consumers increasingly preferred home delivery, wider product selection, and easy price comparison. In January 2026, digital platforms gained attention for offering detailed product information, customer reviews, subscription services, and access to specialized wellness brands. Mobile shopping, secure payments, personalized recommendations, and frequent discounts supported adoption. The channel also helped manufacturers reach consumers beyond major retail locations and serve buyers seeking specific nutritional products.
Key Market Segments
By Product Type
- Dietary Supplements
- Functional Foods
- Functional Beverages
- Fortified and functional energy drinks
By End User
- Lifestyle users
- Fitness enthusiasts
- Athletes
- Geriatric Users
- Others
By Functional Claim
- High/Added Fiber
- Vitamin/Mineral Fortified
- Bone Health/Added Calcium
- Brain Health
- Weight Management
- Cardiovascular Health
- Skin/Hair/Nails
- Added Protein
- Others
By Distribution Channel
- Supermarkets/Hypermarkets
- Online Retail
- Convenience Stores
- Others
Drivers
Healthy ageing demand for bone, cognition, immunity and mobility support
The ageing curve is one of the cleanest structural demand drivers for nutraceuticals because it expands the addressable population for daily-use, low-ticket preventive products rather than one-time therapeutic interventions. The WHO states that the number of people aged 60 and over rose from 1 billion in 2020 to a projected 1.4 billion by 2030 and 2.1 billion by 2050, with 1 in 6 people globally expected to be aged 60 or above by 2030, which directly enlarges the core user base for vitamin D, calcium, omega-3, protein, joint-health, eye-health, and cognition-support products.
This matters commercially because older consumers typically purchase multi-product regimens, lifting annual revenue per user through repeat categories rather than a single SKU, and they tend to tolerate premium pricing when products are linked to maintenance of mobility, immunity, and healthy ageing outcomes.
Drivers Impact Analysis
| Driver | (~) % Impact on CAGR | Geographic Relevance | Impact Timeline |
|---|---|---|---|
| Healthy ageing demand for bone, cognition, immunity and mobility support | +1.9% | North America core, EU core, Japan-South Korea, urban China | Medium term (2-4 years) |
| Regulatory formalization improving category legitimacy and shelf survival | +1.4% | U.S., EU, India, GCC spill-over | Short term (≤ 2 years) |
| Personalized and condition-led formulations raising basket value | +1.6% | U.S. premium channels, EU, India metros, APAC digital corridors | Medium term (2-4 years) |
| E-commerce, practitioner channels and subscription models lowering CAC friction | +1.3% | North America, India, Southeast Asia, U.K.-DACH | Short term (≤ 2 years) |
| Clinical substantiation and higher-bioavailability formats supporting premiumization | +1.5% | U.S., EU, Japan, Australia | Medium term (2-4 years) |
| Asia-based ingredient scale and innovation in probiotics, botanicals and functional inputs | +1.7% | China, India, Southeast Asia, export into U.S.-EU | Long term (≥ 4 years) |
Restraints
Quality, testing and compliance cost inflation
Intensifying focus on quality control, contamination risk, and traceability is structurally positive for category credibility but acts as a near-term restraint on growth by raising fixed and variable costs across the nutraceutical supply chain. Manufacturers now confront stricter expectations on raw-material identity testing, heavy metal and contaminant screening, allergen control, and GMP documentation, with practical responses including adding more in-house or third-party tests per batch, upgrading to validated methods, extending vendor qualification programs, and enhancing data integrity infrastructure all of which can take total quality-related spend from mid-single to high-single-digit percentages of cost of goods for complex, multi-ingredient products.
At a portfolio level, this adds up to margin compression in price-sensitive channels, forces exit from low-margin or small-batch segments where added compliance spend cannot be recovered, and shaves roughly 1–1.5 percentage points from otherwise achievable CAGR as cash and management attention are diverted from growth initiatives into defensive compliance and remediation work.
Restraint Impact Analysis
| Restraint | (~) % Impact on CAGR Forecast | Geographic Relevance | Impact Timeline |
|---|---|---|---|
| Fragmented regulations and claims risk | -1.7% | U.S., EU, India, China, GCC | Medium term (2-4 years) |
| Quality, testing and compliance cost inflation | -1.5% | North America, EU, India CDMO hubs | Short term (≤ 2 years) |
| Volatile botanical and specialty ingredient supply | -1.6% | APAC corridors, EU importers, U.S. brands | Medium term (2-4 years) |
| Retail and digital channel overcrowding | -1.3% | North America core, EU, India online | Short term (≤ 2 years) |
| Clinical evidence gaps vs. marketing claims | -1.4% | U.S., EU, advanced APAC | Long term (≥ 4 years) |
| Talent, CDMO and capacity constraints | -1.2% | India, Southeast Asia, Latin America | Medium term (2-4 years) |
Opportunity
Food-as-medicine integration with healthcare and insurers
Food-as-medicine integration stands out as a future white space rather than a current driver because, despite rising preventive-health narratives, nutraceuticals are still largely purchased out of pocket and sit outside formal care pathways and reimbursement in most markets, leaving a large portion of clinically relevant TAM structurally untapped. By 2035, global health expenditure is expected to remain in the 9–10% of GDP range in many OECD markets, and even shifting 1–2% of chronic-care spend for conditions like pre-diabetes, mild hyperlipidemia, or osteopenia into structured nutraceutical-supported programs could unlock tens of billions of dollars in reimbursed or co-pay-supported supplement protocols rather than ad hoc consumer purchases.
The opportunity is to move from single-SKU retail sales at gross margins of roughly 40–55% toward multi-month bundled interventions prescribed or recommended by clinicians, with adherence supported by digital monitoring and partial insurer coverage, thereby lifting lifetime revenue per patient by perhaps 2–3 times versus today’s typical individual-product retail pattern even at lower per-unit margin. Realization of this upside depends on building evidence-backed product lines, integrating them into disease-management guidelines or hospital discharge plans, and negotiating outcome-linked or risk-sharing agreements with payers, which can reduce payer medical-loss ratios if nutraceutical regimens demonstrably lower hospitalizations, drug dosages, or re-admission rates over 12–36 months.
Opportunity Impact Analysis
| Opportunity | (~) % Potential CAGR Upside | Geographic Relevance | Execution Window |
|---|---|---|---|
| Food-as-medicine integration with healthcare and insurers | +2.2% | North America core, EU, Japan, urban GCC | Medium term (2-4 years) |
| Chronic disease and metabolic health protocols | +2.0% | U.S., India, China, Latin America | Medium term (2-4 years) |
| Precision nutrition data platforms and SaaS | +1.8% | North America, EU, APAC digital corridors | Long term (≥ 4 years) |
| Functional foods and beverages white spaces | +1.9% | North America, EU, India, ASEAN | Short term (≤ 2 years) |
| Emerging market mass-affordability and sachetization | +1.7% | India tier-2/3, Africa, Southeast Asia | Medium term (2-4 years) |
| M&A roll-ups and CDMO platform consolidation | +1.5% | U.S., EU, India manufacturing hubs | Long term (≥ 4 years) |
Trends
Fragmented multi-node supply chains
Fragmented multi-node supply chains are an enduring challenge because nutraceutical value chains typically run from smallholder farms or fragmented commodity suppliers through regional processors, extractors, intermediaries, contract manufacturers, and finally brand-owners, with three to six physical hand-offs and multiple cross-border movements per SKU, so every disruption compounds into measurable friction rather than an outright halt. Typical lead times of 60–120 days from farm or primary processor to finished goods in key corridors, combined with ocean transit variability of plus/minus 7–15 days on major APAC–EU–US lanes, create a planning environment where safety stock buffers of 1–2 months are common for critical botanicals or specialty actives, tying up working capital that might otherwise fund innovation or market entry.
These multi-stop chains mean that a quality failure or documentation error at any node forces rework, re-testing, or even destruction of batches, introducing both direct costs and indirect ones, often seen as 2–4 percentage point swings in COGS on affected SKUs over a year rather than permanent margin resets. Strategically, companies mitigate by dual-sourcing critical ingredients, consolidating distributors, regionalizing secondary processing to shorten routes, and investing in better planning tools and collaborative forecasting with suppliers, but these programs usually roll out over multi-year horizons and demand both IT and organizational change, which is why the drag manifests as a 1–1.5 percentage point CAGR friction rather than a one-time shock.
Challenges Impact Analysis
| Challenge | (~) % CAGR Friction Drag | Geographic Relevance | Mitigation Horizon |
|---|---|---|---|
| Fragmented multi-node supply chains | -1.2% | APAC–EU–US trade lanes | Medium term (2-4 years) |
| Chronic QA, traceability and data gaps | -1.0% | Global, export-focused hubs | Long term (≥ 4 years) |
| Regulatory interpretation and change risk | -1.1% | U.S., EU regulatory hubs, India | Medium term (2-4 years) |
| Senior talent and formulation scarcity | -0.9% | India, SE Asia, LatAm growth hubs | Long term (≥ 4 years) |
| Packaging, freight and energy cost volatility | -1.0% | North America core, EU, APAC corridors | Short term (≤ 2 years) |
| Digital congestion and performance marketing dependence | -0.8% | North America, EU, India online | Medium term (2-4 years) |
Geopolitical Impact Analysis
Trade Tensions and Ingredient Concentration Reshape Nutraceutical Production
Geopolitical tensions are reshaping the nutraceuticals market through tariff uncertainty, concentrated ingredient production, currency movements, and stronger regional sourcing strategies. Manufacturers depend on international supplies of omega-3 oils, botanical extracts, amino acids, vitamins, minerals, and specialty proteins, making production costs sensitive to changes in trade policy. In April 2025, the World Trade Organization estimated that global merchandise trade could contract by 0.2% during the year under prevailing tariff conditions, compared with 2.7% growth expected under a low-tariff environment. This gap highlighted the pressure that policy uncertainty could place on globally sourced health ingredients.
Marine-based nutraceuticals face an additional concentration risk because fish-oil availability depends heavily on a limited number of producing countries and regulated fishing seasons. In October 2025, the Food and Agriculture Organization reported that Peru exported 66,700 tonnes of fish oil during the first quarter of 2025, compared with 7,800 tonnes in the same period of 2024. China received 27% of these exports, while Norway imported 38,400 tonnes globally during the quarter.
These conditions are encouraging nutraceutical companies to qualify alternative suppliers, secure longer purchasing contracts, reformulate products, and expand regional processing capacity. However, limited substitute ingredients and lengthy quality testing can slow supplier changes, leaving manufacturers exposed to sudden tariffs, export disruptions, and raw-material price movements.
Regional Analysis
Asia Pacific Held the Largest Share of the Global Nutraceuticals Market.
In 2025, Asia Pacific held a dominant position in the nutraceuticals market, accounting for 40.4% of global revenue, equivalent to US$217.41 billion. The region benefited from a large consumer base, rising health awareness, wider retail access, and growing demand for functional foods, supplements, and fortified beverages. In November 2025, the United Nations Economic and Social Commission for Asia and the Pacific reported that the region had 516 million people aged 65 years or above, representing Asia Pacific Leads Through Expanding Nutrition Demand of its population.
This ageing base supported demand for products linked with bone health, immunity, digestion, and healthy ageing. In December 2025, the Food and Agriculture Organization reported that a healthy diet in Asia and the Pacific cost an average of US$4.77 per person per day in 2024, showing continued nutrition affordability pressure. These conditions encouraged manufacturers to expand value-focused products, regional production, online distribution, and localized formulations across diverse consumer groups and regional markets.
Key Regions and Countries Covered
- North America
- The US
- Canada
- Europe
- Germany
- France
- The UK
- Spain
- Italy
- Russia & CIS
- Rest of Europe
- APAC
- China
- Japan
- South Korea
- India
- ASEAN
- Rest of APAC
- Latin America
- Brazil
- Mexico
- Rest of Latin America
- Middle East & Africa
- GCC
- South Africa
- Rest of MEA
Key Players Analysis
Nutraceutical companies focus on product credibility, formulation quality, brand trust, and distribution reach to strengthen their competitive position. A key priority is continuous product innovation across functional foods, dietary supplements, fortified beverages, probiotics, proteins, and personalized nutrition solutions. Companies increasingly invest in clinically supported ingredients, cleaner labels, improved taste, and convenient formats such as gummies, powders, capsules, bars, and ready-to-drink products. Strong relationships with ingredient suppliers help maintain consistent quality and reduce exposure to shortages in vitamins, botanical extracts, minerals, and specialty nutrients.
Leading players also expand through acquisitions, partnerships, contract manufacturing, and regional production facilities to enter new markets and broaden their product portfolios. Wider access through supermarkets, pharmacies, specialist stores, and digital platforms supports stronger consumer reach. In addition, companies emphasize regulatory compliance, traceability, quality testing, and targeted marketing to differentiate their brands, retain customers, and build a stronger position across high-growth wellness categories.
Market Key Players
- Nestlé S.A.
- Abbott Laboratories
- Danone S.A.
- Herbalife Nutrition Ltd.
- Amway Corporation
- The Natures Bounty Co. (NBTY)
- Bayer AG
- Royal DSM NV
- General Mills Inc.
- PepsiCo
- Glanbia plc
- Otsuka Holdings Co., Ltd.
- Blackmores Limited
- Swisse Wellness Pty Ltd
- Dabur India Limited
- Others
Key Development
- In June 2026, Danone S.A. entered into definitive agreements to acquire MADE Group, an Australia-based company with a health-focused portfolio, strengthening its position in the fast-growing healthy nutrition market across Asia Pacific.
- In August 2025, Glanbia plc completed the acquisition of Sweetmix, a Brazil-based nutritional premix and ingredient solutions company, for an initial consideration of US$41 million, expanding its Health and Nutrition capabilities.
- In May 2025, PepsiCo completed the acquisition of Poppi, a prebiotic soda brand, strengthening its functional beverage portfolio and expanding its presence in the growing better-for-you drinks category.
Report Scope
| Report Features | Description |
|---|---|
| Market Value (2025) | USD 538.2 Bn |
| Forecast Revenue (2035) | USD 979.7 Bn |
| CAGR (2026-2035) | 6.2% |
| Base Year for Estimation | 2025 |
| Historic Period | 2020-2024 |
| Forecast Period | 2026-2035 |
| Report Coverage | Revenue Forecast, Market Dynamics, Competitive Landscape, Recent Developments |
| Segments Covered | By Product Type (Dietary Supplements, Functional Foods, Functional Beverages, and Others), By End User (Lifestyle Users, Fitness Enthusiasts, Athletes, Geriatric Users, and Others), By Functional Claim (High/Added Fiber, Vitamin/Mineral Fortified, Bone Health/Added Calcium, Brain Health, Weight Management, Cardiovascular Health, Skin/Hair/Nails, Added Protein, and Others), By Distribution Channel (Supermarkets/Hypermarkets, Online Retail, Convenience Stores, and Others) |
| Regional Analysis | North America – The US & Canada; Europe – Germany, France, The UK, Spain, Italy, Russia & CIS, Rest of Europe; APAC– China, Japan, South Korea, India, ASEAN & Rest of APAC; Latin America– Brazil, Mexico & Rest of Latin America; Middle East & Africa– GCC, South Africa, & Rest of MEA |
| Competitive Landscape | Nestlé S.A., Abbott Laboratories, Danone S.A., Herbalife Nutrition Ltd., Amway Corporation, The Natures Bounty Co. (NBTY), Bayer AG, Royal DSM NV, General Mills Inc., PepsiCo, Glanbia plc, Otsuka Holdings Co., Ltd., Blackmores Limited, Swisse Wellness Pty Ltd, Dabur India Limited, and others. |
| Customization Scope | Customization for segments, region/country-level will be provided. Moreover, additional customization can be done based on the requirements. |
| Purchase Options | We have three licenses to opt for: Single User License, Multi-User License (Up to 5 Users), Corporate Use License (Unlimited Users and Printable PDF) |





































