


Report Overview
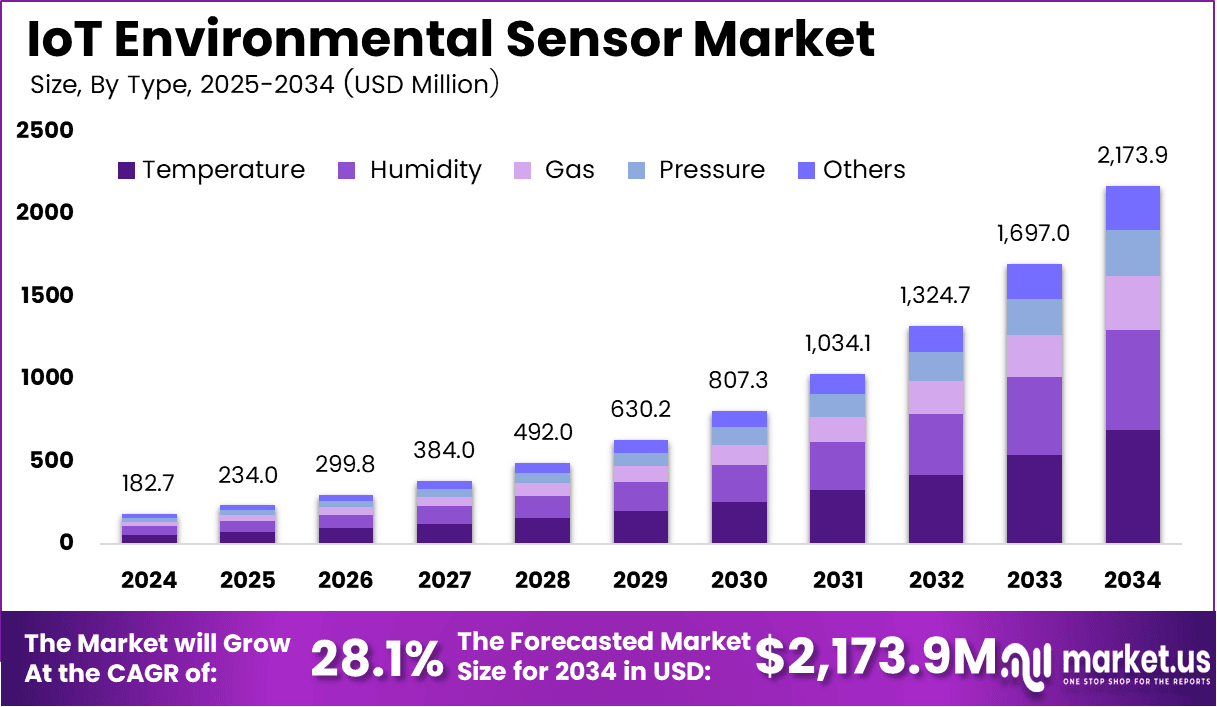
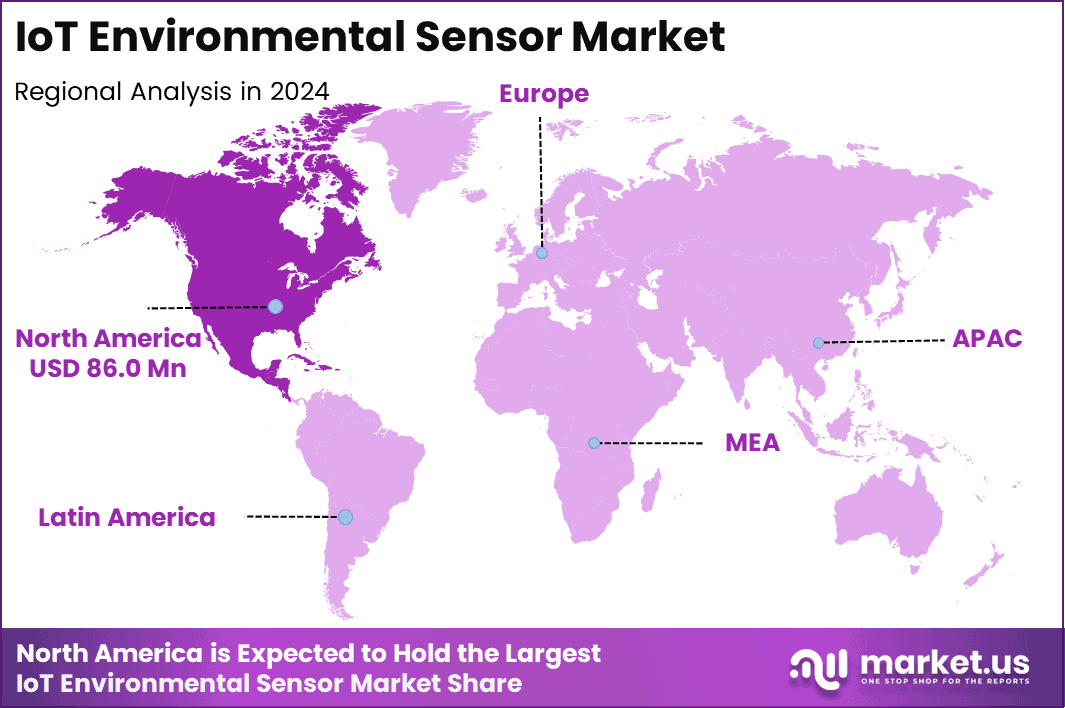
In 2024, the Global IoT Environmental Sensor Market was valued at USD 182.7 million. The market is projected to grow at a CAGR of 28.1% during 2024–2034, reaching approximately USD 2,173.9 million by 2034. North America dominated the global market in 2024, accounting for 47.1% of the total market share and generating approximately USD 86.0 million in revenue.
Demand is rising because public agencies, cities, utilities, factories, and building owners need continuous, location-specific environmental data rather than periodic manual checks. The U.S. Environmental Protection Agency states that the national PM2.5 network already includes almost 1,000 monitoring stations, while its 2024 funding program allocated nearly USD 83 million to expand air-quality monitoring.
Networked IoT sensors support this expansion by measuring particulate matter, gases, temperature, humidity, water conditions, and other variables in real time, then sending readings to central software. This enables faster action on pollution events, worker safety issues, and equipment faults. Climate risk also raises the value of early warnings.
The U.S. National Oceanic and Atmospheric Administration recorded 27 weather and climate disasters costing over USD 1 billion each in 2024, with total losses of USD 182.7 billion. These events increase demand for sensor networks used for flood, wildfire, heat, air-quality, and weather monitoring.
North America’s leading position is supported by its high level of monitoring activity, strict environmental compliance needs, and strong digital infrastructure. The International Energy Agency estimates that the United States represented 45% of global data-centre electricity use in 2024, and forecasts U.S. data-centre electricity demand to increase by about 240 TWh, or 130%, by 2030
Key Takeaways
- The global IoT Environmental Sensor Market was valued at USD 182.70 million in 2024.
- The global IoT Environmental Sensor Market is projected to grow at a CAGR of 28.1% and is estimated to reach USD 2,173.85 million by 2034.
- On the basis of type, the Temperature segment dominated the market, accounting for 31.7% of the total market share.
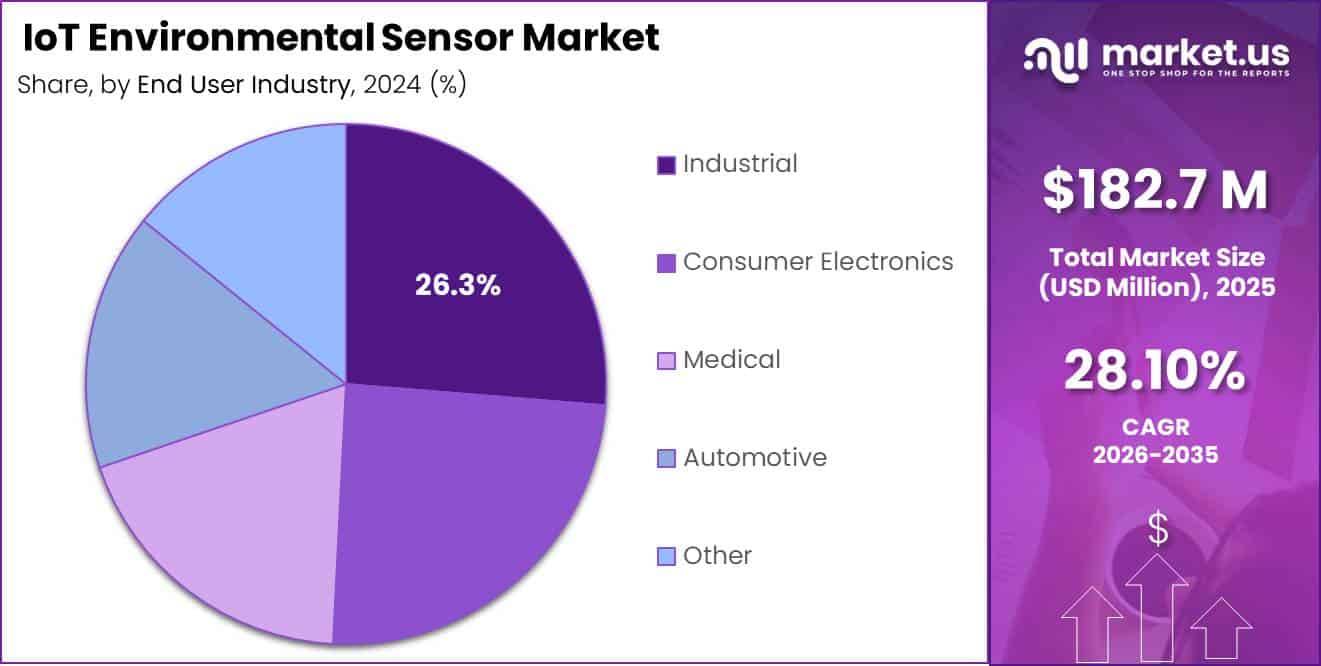
- By end-user, the Industrial segment dominated the market, accounting for 26.3% of the total market share.
- In 2024, North America was the most dominant region in the IoT Environmental Sensor Market, accounting for 47.1% of the total market share, equivalent to approximately USD 86.0 million in revenue.
By Type
The IoT Environmental Sensor Market is dominated by Temperature Sensors, which hold 31.7% of the market share, due to their critical role in industries such as industrial systems, consumer electronics, and medical devices. These sensors are essential for maintaining precise temperature control in applications like HVAC systems, industrial machinery, and medical equipment.
Following closely, Gas Sensors capture 25.8% of the market, driven by their widespread use in monitoring air quality and detecting gases like CO2 and NOx, particularly in automotive, industrial, and environmental applications.
Humidity Sensors, making up 20.5% of the market share, are vital in industries that require climate regulation, such as agriculture, HVAC, and industrial systems, ensuring optimal environmental conditions for product quality and operational efficiency. Pressure Sensors account for 15.6% of the market, being key to monitoring pressure levels in automotive, industrial, and HVAC systems for safety and efficiency.
By End-User
Industrial applications lead the IoT Environmental Sensor Market with 26.3% of the market share, driven by the need to monitor air quality, emissions, and energy usage across manufacturing, energy, and construction industries, largely due to regulatory pressures and sustainability goals.
Consumer Electronics follows with 18.9% of the market, as increasing demand for smart home devices, wearables, and personal electronics pushes the need for sensors that track temperature, humidity, and air quality, enhancing comfort and energy efficiency.
The Automotive sector holds 21.4% of the market share, with rising adoption of environmental sensors in electric and hybrid vehicles, particularly for emissions monitoring and improving cabin air quality. Medical applications represent 17.5% of the market, where sensors are crucial for maintaining optimal environmental conditions in hospitals and clinics to ensure patient safety and compliance with health standards.
Key Market Segments
By Type
- Humidity
- Temperature
- Gas
- Pressure
- Others
By End-user
- Medical
- Consumer Electronics
- Industrial
- Automotive
- Other
Regional Analysis
The IoT Environmental Sensor Market is projected to experience significant growth, with analysts forecasting a rise from USD 86.0 million in 2024, driven by advancements in sensor technology, regulatory mandates, and increasing environmental awareness. The market will expand at a robust 25.8% CAGR, with North America leading, followed by rapid growth in the APAC region, particularly China and India, due to industrial expansion and government investments in smart infrastructure.
Technological innovations, including AI and machine learning integration, are enhancing sensor capabilities, enabling predictive maintenance, and driving demand in industrial, automotive, and medical sectors. Regulatory pressures, such as stricter environmental standards, are fueling the adoption of real-time environmental monitoring solutions, particularly in urban areas and smart cities.
Key Regions and Countries
- North America
- US
- Canada
- Europe
- Germany
- France
- The UK
- Spain
- Italy
- Rest of Europe
- Asia Pacific
- China
- Japan
- South Korea
- India
- Australia
- Singapore
- Rest of Asia Pacific
- Latin America
- Brazil
- Mexico
- Rest of Latin America
- Middle East & Africa
- South Africa
- Saudi Arabia
- UAE
- Rest of MEA
Drivers
| Driver | (~) % Impact on CAGR Forecast | Geographic Relevance | Impact Timeline |
|---|---|---|---|
| Mandatory EU Corporate Sustainability Reporting | +4.2% | European Union | Short term (≤2 years) |
| Smart City Municipal Air Quality Networks | +3.6% | China, India, Southeast Asia | Short term (≤2 years) |
| EPA Climate Pollution Grant Deployments | +2.8% | United States | Short term (≤2 years) |
| Edge-Compute Sensor Node Migration | +2.1% | North America, Western Europe | Medium term (2–4 years) |
| Industrial Emissions Compliance Mandates | +1.9% | Global, led by OECD economies | Short term (≤2 years) |
| Consumer Wearable Air-Quality Integration | +1.4% | North America, East Asia | Medium term (2–4 years) |
Mandatory EU Corporate Sustainability Reporting
The root cause of this driver is the Corporate Sustainability Reporting Directive, which entered into force on January 5, 2023, and expanded mandatory ESG disclosure obligations to roughly 49,000 EU-based entities and subsidiaries for the 2024 reporting year, with first filings due in 2025.
The strategic impact is a structural shift in procurement from capital-expenditure-based, one-time monitoring purchases toward recurring, subscription-like data-service contracts, compressing hardware-only vendor margins by an estimated 3 to 5 percentage points while expanding data-and-assurance service revenue streams that carry 15 to 20 percentage points higher margin than legacy hardware sales, and accelerating CapEx cycles for compliance-grade sensor fleets ahead of the 2025 statutory deadline.
Restraints
| Restraint | (~) % Impact on CAGR Forecast | Geographic Relevance | Impact Timeline |
|---|---|---|---|
| Semiconductor Component Supply Freeze | -3.8% | Global, concentrated in Taiwan, South Korea | Short term (≤2 years) |
| High Interest Rate CapEx Deferral | -2.4% | North America, Europe | Short term (≤2 years) |
| Elevated Precision Sensor Unit Cost | -1.7% | Price-sensitive emerging markets | Short term (≤2 years) |
| Fragmented Municipal Procurement Budgets | -1.3% | Latin America, Sub-Saharan Africa | Short term (≤2 years) |
| Rare-Earth Material Export Controls | -0.9% | China-dependent supply chains | Short term (≤2 years) |
Semiconductor Component Supply Freeze
The root cause of this restraint traces to the 2020–2023 global chip shortage, during which average semiconductor lead times stretched from a pre-pandemic baseline of roughly 12.7 weeks in early 2020 to peaks near 25 weeks by late 2022, directly constraining microcontroller and MEMS sensor-die availability for environmental sensor OEMs.
The quantitative bottleneck manifested as a sustained doubling of component lead time relative to 2019 levels even as capacity expansion required 6 to 9 months and billions of dollars of fresh fab investment to bring online.
The strategic business impact was an immediate freeze on new sensor shipment volumes, forcing OEMs to allocate scarce die inventory to highest-margin industrial contracts, delaying municipal and consumer-grade rollout CapEx by 2 to 3 fiscal quarters and compressing gross margins by an estimated 4 to 6 percentage points as firms absorbed premium spot-market chip pricing rather than passing costs fully to price-sensitive municipal buyers.
Challenges
| Challenge | (~) % CAGR Friction Drag | Geographic Relevance | Mitigation Horizon |
|---|---|---|---|
| Field Calibration Talent Deficit | -1.6% | Global, acute in emerging markets | Medium term (2–4 years) |
| Cross-Protocol Interoperability Gaps | -1.4% | Global, fragmented vendor ecosystems | Medium term (2–4 years) |
| Sensor Drift and Data Integrity Risk | -1.1% | Industrial and municipal deployments globally | Medium term (2–4 years) |
| Fragmented Regional Data Privacy Rules | -0.9% | EU, North America, Asia-Pacific | Long term (≥4 years) |
| Battery and Power Longevity Constraints | -0.7% | Remote and rural deployment zones | Medium term (2–4 years) |
Field Calibration Talent Deficit
The structural vulnerability stems from the rapid scale-up of connected environmental sensor installations, with nearly 10 million new units deployed in 2024 alone, far outpacing the availability of trained field technicians capable of performing periodic gas-cell and electrochemical-cell recalibration.
The quantitative friction shows up as calibration backlogs that can extend routine maintenance cycles by an estimated 20 to 30 percent beyond manufacturer-specified intervals in high-growth metropolitan deployment zones across China and India, where sensor density rose roughly 28 percent in 2024.
The long-term corporate adjustment required is a shift toward self-diagnosing, remote-calibration firmware architectures and third-party calibration-as-a-service partnerships, which raises software R&D allocation by an estimated 2 to 3 percentage points of revenue but is necessary to prevent data-integrity erosion from undermining the very compliance use-cases driving adoption.
Opportunities
| Opportunity | (~) % Potential CAGR Upside | Geographic Relevance | Execution Window |
|---|---|---|---|
| Sensor-Data Subscription Monetization | +2.6% | Global, led by North America and Europe | Medium term (2–4 years) |
| Adjacent Agritech Soil-Sensing Expansion | +2.1% | India, Brazil, Sub-Saharan Africa | Medium term (2–4 years) |
| Emerging Market Municipal Roll-Up M&A | +1.7% | Latin America, Southeast Asia | Long term (≥4 years) |
| Predictive Maintenance AI Overlay Services | +1.5% | Global industrial installed base | Medium term (2–4 years) |
| Non-EU Voluntary ESRS Adoption Wave | +1.2% | North America, Asia-Pacific | Long term (≥4 years) |
Sensor-Data Subscription Monetization
This is untapped white space rather than a current driver because the compliance-driven hardware demand already captured under CSRD mandates (see Drivers) has not yet been paired with a broad shift to recurring, outcome-based data-licensing contracts across the installed base of environmental sensor fleets, leaving most vendors still monetizing largely through one-time unit sales.
The unit-economic shift estimate is that converting even a modest share of the existing hardware-only customer base to tiered data-subscription models could lift blended gross margins by an estimated 8 to 12 percentage points versus the hardware-only baseline, while reducing customer acquisition cost payback periods from an estimated 18 to 24 months to under 12 months as recurring revenue improves lifetime-value-to-CAC ratios.
Key Players Analysis
Tier-1 leaders, Texas Instruments (TI), STMicroelectronics, Analog Devices (ADI), Honeywell, Siemens, Bosch, and TE Connectivity, likely control an estimated 55–65% of addressable IoT environmental-sensor value, measured by industrial/building sensing ICs, MEMS, sensor modules, connectivity, and automation systems rather than total corporate revenue.
TI has the greatest scale leverage. 2025 revenue reached $17.68 billion, including $14.01 billion in Analog and $2.70 billion in Embedded Processing, supporting broad deployment of temperature, pressure, gas-interface, and wireless-enabled sensor designs.
ST is the clearest dedicated MEMS and sensing rival. Its Analog, MEMS & Sensors segment recorded $1.449 billion in Q4 2025 revenue and $235 million operating profit. ADI’s 2025 revenue was $11.0 billion, with $534 million CapEx, reinforcing high-performance industrial condition-monitoring and edge-signal-chain capacity.
Honeywell, Siemens, and Bosch form the systems-led Tier-1 group, pairing sensors with building, industrial, and energy software. Honeywell’s Building Automation generated $1.692 billion of Q1 2025 sales and $440 million segment profit. Its 2025 company-funded R&D equated to approximately 4.5% of sales, while Building Automation’s Q4 organic sales rose 8%.
Siemens reported FY2025 revenue of €78.914 billion and €6.559 billion R&D expenditure, about 8% R&D intensity, creating substantial scale in smart infrastructure and industrial IoT. Bosch posted €91.0 billion in 2025 sales, including roughly €56 billion in Mobility revenue, and committed about €12 billion to combined R&D and CapEx, explicitly spanning semiconductors and sensors.
Tier-2 challengers, NXP, Murata, OMRON, and GE Vernova, the relevant successor to GE’s industrial and energy operations, are differentiated by connectivity, modules, factory automation, and grid-monitoring applications, collectively estimated at 15–25%. NXP delivered $12.269 billion in 2025 revenue while investing $2.035 billion in R&D and $397 million in cash CapEx.
Murata recorded FY2026 revenue of ¥1,830.9 billion, ¥158.9 billion in R&D, representing 8.7% of sales, and ¥247.8 billion in CapEx. TE remains a critical sensor and interconnect challenger, with FY2025 Industrial Solutions sales of $7.874 billion, up 23.7%, and its Richards Manufacturing acquisition adding $179 million in sales.
Top Key Players
- TE Connectivity Corporation
- STMicroelectronics International N.V.
- NXP Semiconductor N.V.
- Honeywell International Inc.
- Siemens AG
- General Electric
- OMRON Corporation
- Murata Manufacturing Co., Ltd.
- Analog Devices, Inc.
- Robert Bosch GmbH
- Other
Recent Developments
- In September 2024, Honeywell completed its $1.9 billion all-cash acquisition of CAES Systems Holdings, valued at approximately 14× estimated 2024 EBITDA; the transaction expanded Honeywell’s advanced sensing and RF-signal-management capabilities for connected industrial and critical-infrastructure applications.
- In September 2024, California Air Resources Board awarded Aclima a $27 million contract, precisely $26.88 million under the competitive RFP, to deploy its Statewide Mobile Monitoring Initiative. The program uses vehicle-mounted, networked air-quality sensing to map pollutants and GHGs, with up to 9 months of simultaneous monitoring coverage planned across selected communities.
Report Scope
| Report Features | Description |
|---|---|
| Market Value (2024) | USD 182.7 Mn |
| Forecast Revenue (2034) | USD 2,173.9 Mn |
| CAGR(2025-2034) | 28.1% |
| Base Year for Estimation | 2024 |
| Historic Period | 2020-2023 |
| Forecast Period | 2025-2034 |
| Report Coverage | Revenue forecast, AI impact on Market trends, Share Insights, Company ranking, competitive landscape, Recent Developments, Market Dynamics and Emerging Trends |
| Segments Covered | By Type (Humidity, Temperature, Gas, Pressure, Others), By End-user (Medical, Consumer Electronics, Industrial, Automotive, Other) |
| Regional Analysis | North America – US, Canada; Europe – Germany, France, The UK, Spain, Italy, Russia, Netherlands, Rest of Europe; Asia Pacific – China, Japan, South Korea, India, New Zealand, Singapore, Thailand, Vietnam, Rest of Latin America; Latin America – Brazil, Mexico, Rest of Latin America; Middle East & Africa – South Africa, Saudi Arabia, UAE, Rest of MEA |
| Competitive Landscape | Texas Instruments, TE Connectivity Corporation, STMicroelectronics International N.V., NXP Semiconductor N.V., Honeywell International Inc., Siemens AG, General Electric, OMRON Corporation, Murata Manufacturing Co., Ltd., Analog Devices, Inc., Robert Bosch GmbH, Other Major Players |
| Customization Scope | Customization for segments, region/country-level will be provided. Moreover, additional customization can be done based on the requirements. |
| Purchase Options | We have three licenses to opt for: Single User License, Multi-User License (Up to 5 Users), Corporate Use License (Unlimited Users and Printable PDF) |





































