


Report Overview
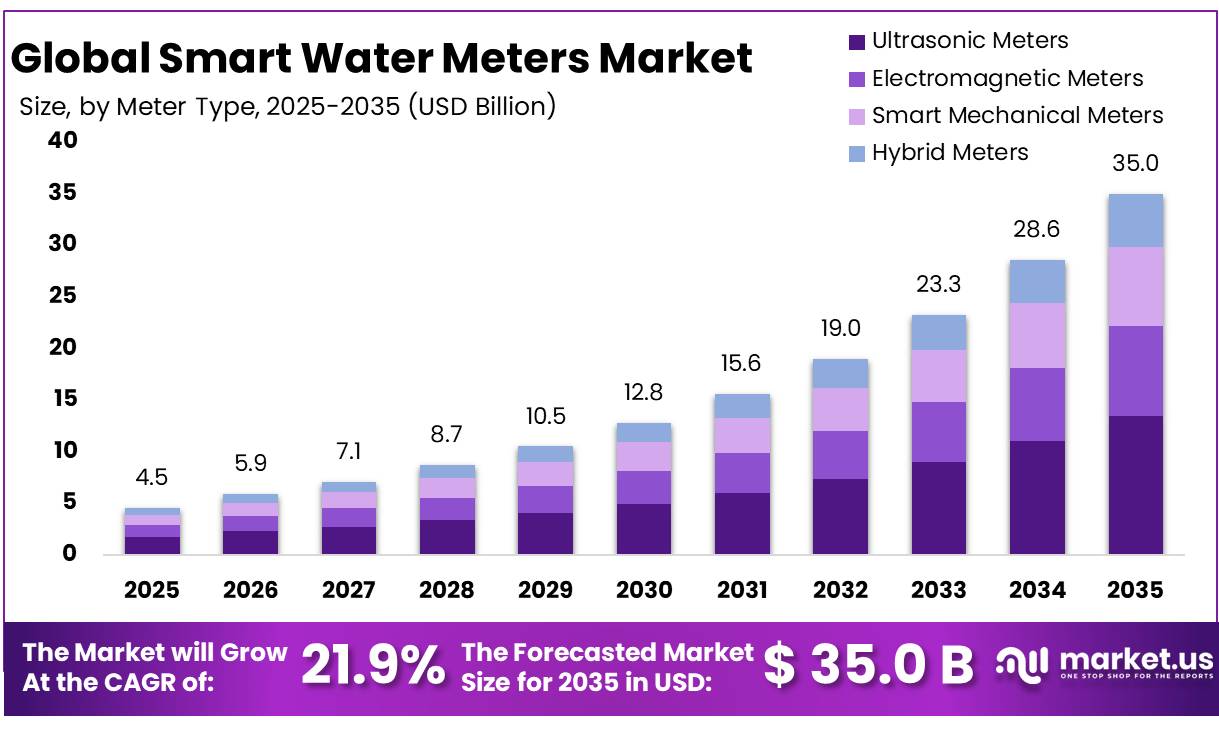
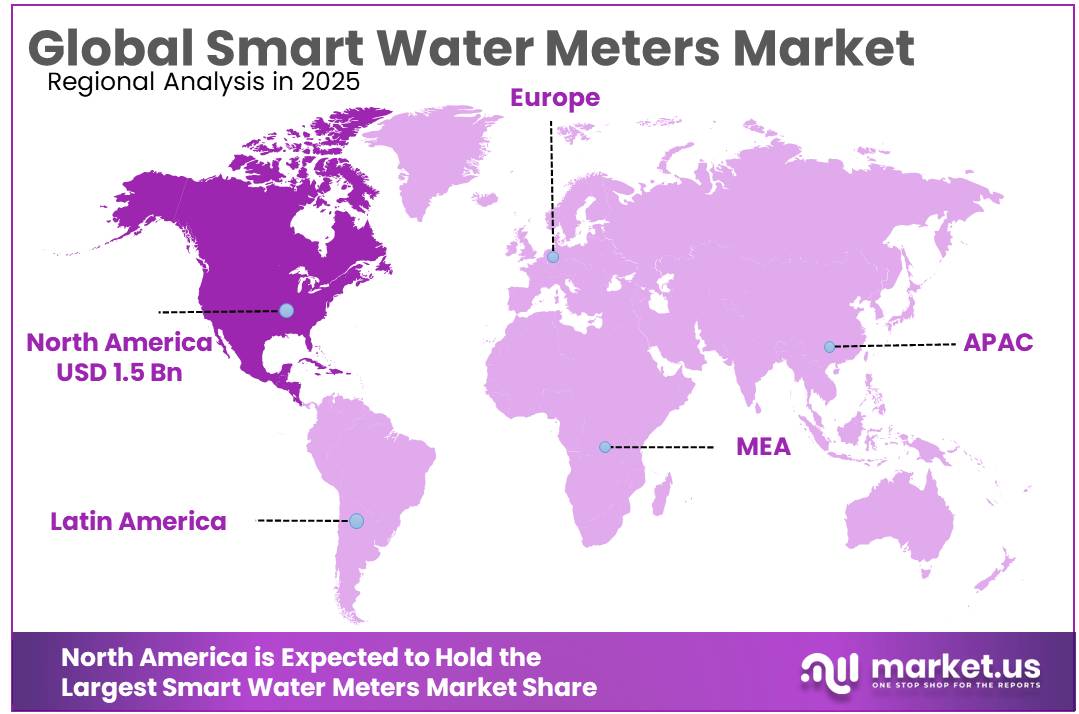
The Global Smart Water Meters Market size is expected to be worth around USD 35.0 Billion by 2035, from USD 4.5 Billion in 2025, growing at a CAGR of 21.9% during the forecast period from 2026 to 2035. In 2025, North America held a dominant market position, capturing more than a 34.5% share, holding USD 1.5 Billion revenue.
Smart water meters are becoming an important part of modern water infrastructure because utilities need more accurate consumption data, faster leak detection, automated billing, and better control over water losses. Advanced Metering Infrastructure, or AMI, combines smart meters with communication networks and data-management systems so utilities can collect and analyze water-use information automatically.
- The industrial scenario is being shaped strongly by water scarcity and leakage reduction programs. In England, nearly 19% of supplied water was still being lost through leakage in 2024–2025. The national average household metering rate reached 62.7%, while some utilities had already exceeded 85% metering.
Government investment is providing a strong demand base for smart water meter manufacturers and technology providers. Ofwat has approved more than £1.7 billion for the installation of 10.4 million smart meters between 2025 and 2030, alongside over £700 million for additional leakage-reduction work. The regulator expects leakage to fall by another 17% over the next five years, creating demand for meters, communication modules, software platforms, analytics, and network-management services.
- The business case is also supported by measurable water savings. Ofwat reported that smart meter installation can reduce household water consumption by up to 18% compared with an unmetered property. Under current investment plans, approximately 50% of households and businesses in England could have smart meters by 2030, compared with 13% of households and 8% of non-household properties in 2023–2024.
Europe is also creating future growth opportunities through digital water policy. In May 2026, the European Commission launched work on an EU-wide digitalisation action plan that includes an initiative for smart meters. The Commission estimates that smart meters can lower water use by up to 25%, while broader digital systems can save another 5–8% and leak detection can reduce consumption by 7–14%.
Key Takeaways
- Smart Water Meters Market size is expected to be worth around USD 35.0 Billion by 2035, from USD 4.5 Billion in 2025, growing at a CAGR of 21.9%.
- Ultrasonic Meters held a dominant market position, capturing more than a 38.50% share.
- Meters and Accessories held a dominant market position, capturing more than a 50.00% share.
- Automatic Meter Reading held a dominant market position, capturing more than a 57.20% share.
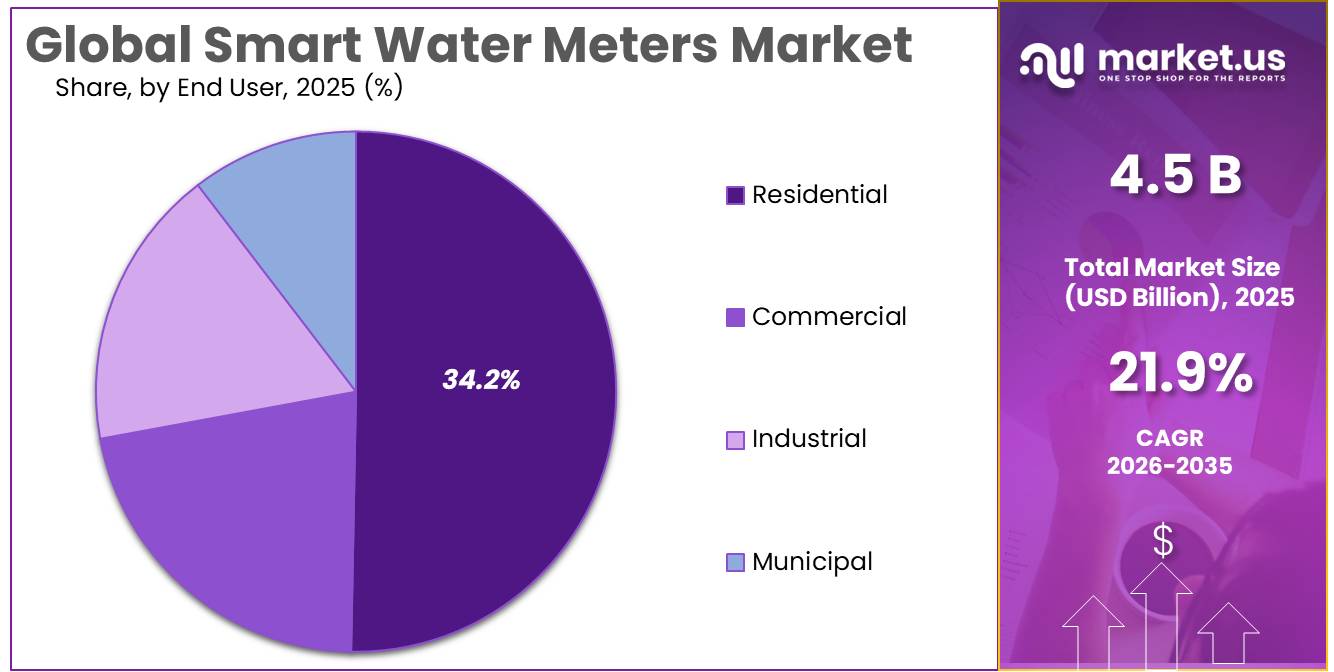
- Residential held a dominant market position, capturing more than a 50.2% share.
- North America held a dominant position in the Smart Water Meters Market, capturing more than a 34.50% share and USD 1.55 billion.
By Meter Type Analysis
Ultrasonic Meters dominate the Smart Water Meters Market with a 38.50% share, supported by accurate measurement and compatibility with digital water networks.
In 2025, Ultrasonic Meters held a dominant market position, capturing more than a 38.50% share. Their strong position was supported by growing utility demand for accurate flow measurement, remote reading, low-maintenance operation, and real-time leakage monitoring. Ultrasonic technology measures water flow without relying on traditional moving mechanical parts, making it suitable for advanced digital metering systems.
- The U.S. Environmental Protection Agency states that Advanced Metering Infrastructure can collect water-use information hourly or even more frequently, allowing utilities to identify leaks and unusual consumption much earlier. In 2026, the European Commission also reported that smart meters can reduce water consumption by up to 25%, while digital systems can deliver another 5–8% saving.
Electromagnetic Meters remained an important segment of the Smart Water Meters Market in 2025 as water utilities continued modernizing distribution networks and improving measurement accuracy. These meters are well suited to conductive liquids such as drinking water and can support applications where utilities require stable flow measurement with limited internal mechanical wear. Their integration with digital communication platforms also makes them useful in Advanced Metering Infrastructure.
The U.S. EPA notes that leaks can account for more than 6% of total water use in an average commercial facility, highlighting the importance of accurate measurement and early detection. In 2026, the European Commission stated that digital leak-detection systems could reduce water consumption by 7–14%. These operational benefits are encouraging utilities to combine electromagnetic flow measurement with telemetry, remote monitoring, and analytics to improve network efficiency and reduce non-revenue water.
By Component Analysis
Meters and Accessories dominate the Smart Water Meters Market with a 50.00% share, supported by large-scale utility installation programs and the need for accurate remote measurement.
In 2025, Meters and Accessories held a dominant market position, capturing more than a 50.00% share. The segment remained strong because smart water programs require physical meters, communication modules, endpoints, registers, valves, and installation accessories before digital monitoring can begin. In England and Wales, Ofwat approved £1.7 billion for the installation of 10.4 million smart meters between 2025 and 2030.
- The regulator also expects at least 80% of meters to operate in smart mode by the end of the 2025–2030 period, with defined connectivity and data-completeness standards. This large rollout creates direct demand for meter hardware and supporting accessories.
IT Solutions remained an important component of the Smart Water Meters Market in 2025 as utilities increasingly required software to collect, validate, store, and analyze data generated by connected meters. These platforms support billing, customer portals, leakage alerts, demand forecasting, network monitoring, and asset management.
In 2026, the European Commission reported that digital water systems can reduce water consumption by an additional 5–8%, while digital leak detection can lower consumption by 7–14%. The Commission is also developing an EU-wide water digitalisation action plan covering IoT, artificial intelligence, sensors, and smart meters. These initiatives are creating opportunities for meter-data management systems, cloud platforms, cybersecurity, analytics, and AI-based applications that help utilities convert frequent meter readings into operational decisions and water-saving actions.
By Technology Analysis
Automatic Meter Reading dominates the Smart Water Meters Market with a 57.20% share, supported by lower manual-reading requirements and faster billing operations.
In 2025, Automatic Meter Reading held a dominant market position, capturing more than a 57.20% share. The technology remained widely used because it allows utilities to collect meter data remotely without sending workers to every property. The U.S. Environmental Protection Agency explains that AMR systems can transmit water-flow and alarm data to a nearby receiver, often while utility staff drive or walk past installed meters. This approach reduces staff time, supports more frequent billing, and improves data collection compared with manual readings.
- In 2025, England also began a major smart-meter rollout covering 10.4 million meters between 2025 and 2030, supported by £1.7 billion in approved funding. Such modernization programs continue to support automated reading technologies as utilities replace older manual systems and improve operational efficiency.
Advanced Metering Infrastructure remained an important technology segment in 2025 as utilities increasingly required continuous communication between meters, networks, and data-management platforms. EPA states that AMI can provide water-use information hourly or more frequently, allowing utilities to detect excessive consumption and possible leaks much faster.
Government policy is also supporting wider adoption. England’s water-demand delivery plan targets installation of around 10.4 million smart meters from 2025 to 2030, raising smart-meter coverage to about 50% of households and businesses by 2030. The same plan states that moving from an unmetered property to smart metering can reduce water consumption by up to 17%. These benefits are supporting investment in AMI networks, telemetry, analytics, customer portals, and automated leakage-management systems.
By End User Analysis
Residential dominates the Smart Water Meters Market with a 50.2% share, supported by large household rollouts, leakage control, and more accurate billing.
In 2025, Residential held a dominant market position, capturing more than a 50.2% share. The segment remained strong as utilities increased household smart-meter installations to improve billing accuracy, identify leaks earlier, and help customers understand daily water use. Ofwat reported that smart meter installation can reduce household water consumption by up to 18% compared with an unmetered property.
- Water companies in England were funded to install 10.4 million smart meters between 2025 and 2030, supported by £1.7 billion in investment. This rollout is expected to raise smart-meter coverage to around 50% of households and businesses by 2030. Residential demand is therefore supported by large installation volumes, growing water-efficiency targets, and the need for automated usage information across individual homes.
Commercial remained an important end-user segment in the Smart Water Meters Market in 2025 as building operators increased the use of meters, submeters, and digital monitoring systems to manage water consumption. The U.S. EPA states that commercial and institutional facilities account for 17% of withdrawals from public water supplies in the United States.
It also reports that leaks can represent more than 6% of a facility’s total water use. Smart meters and Advanced Metering Infrastructure can provide hourly water-use data, helping businesses identify abnormal consumption, equipment problems, and hidden leaks much earlier. EPA also notes that water data have been entered into ENERGY STAR Portfolio Manager for more than 50,000 buildings, showing the growing role of digital measurement in commercial water management and efficiency planning.
Key Market Segments
By Meter Type
- Electromagnetic Meters
- Ultrasonic Meters
- Smart Mechanical Meters
- Hybrid Meters
By Component
- Meters and Accessories
- IT Solutions
- Communication Networks
- Services
By Technology
- Automatic Meter Reading
- Advanced Metering Infrastructure
By End User
- Residential
- Commercial
- Industrial
- Municipal
Driver Analysis
Non-Revenue Water Reduction Mandates
Regulatory pressure to measure, report, and reduce non-revenue water is converting smart metering from a discretionary billing upgrade into a network-efficiency investment, particularly where utilities face large gaps between treated-water production and billable consumption. Non-revenue water combines physical leakage, meter under-registration, unauthorized use, data errors, and unbilled consumption; because treatment, pumping, and chemical costs are incurred before losses occur, every cubic metre recovered improves both utility revenue and energy productivity without requiring new source-water development.
The European Drinking Water Directive now requires Member States to assess leakage levels, and national reporting was due by January 2026; the European Commission must establish a Union-level leakage threshold by January 2028, after which Member States above the threshold must prepare action plans. Leakage levels across European systems vary widely—from approximately 8% to 57%—creating differentiated demand for district metering, pressure monitoring, AMI endpoints, and analytics that can isolate abnormal night flow, customer-side leaks, and meter-revenue gaps.
A utility supplying 100 million m³ annually with 25% non-revenue water loses 25 million m³ before billing; reducing losses by only 3 percentage points recovers 3 million m³, which at a blended tariff and avoided production cost of USD 0.80–2.00 per m³ can create USD 2.4–6.0 million in annual financial value, supporting a metering-and-analytics investment of USD 5–15 million with a two- to five-year payback.
Smart meters alter the business model by shifting utilities from periodic manual reads and reactive leak repair to continuous consumption data, automated exceptions, pressure-zone targeting, customer leak alerts, and performance-based NRW contracts; vendors capture hardware revenue plus 10–15-year software, connectivity, and analytics income. The driver is strongest in the EU, North America, the Middle East, India, and Latin America, where water losses, drought exposure, or regulatory reporting requirements are material, and is estimated to add +2.3 percentage points to the market CAGR through 2028–2030.
Drivers Impact Analysis
| Driver | (~) % Impact on CAGR Forecast | Geographic Relevance | Impact Timeline |
|---|---|---|---|
| Non-revenue water reduction mandates | +2.3 pp | EU, North America, MENA, India, LATAM | Medium term (2–4 years) |
| Aging-network renewal funding | +1.9 pp | North America core, EU, Japan, Australia | Medium term (2–4 years) |
| Utility AMI billing modernization | +1.6 pp | North America, EU, China, India, GCC | Short term (≤ 2 years) |
| Water-scarcity demand management | +1.5 pp | MENA, India, Australia, Southern EU, Western U.S. | Long term (≥ 4 years) |
| Digital leak analytics adoption | +1.3 pp | North America, EU, China, Singapore, GCC | Medium term (2–4 years) |
| IoT connectivity cost decline | +1.0 pp | Global, strongest in APAC and LATAM | Short term (≤ 2 years) |
Restraint Analysis
High Deployment CapEx
A conventional residential meter replacement may cost USD 30–80 per connection, whereas a fully installed AMI water endpoint typically requires USD 120–350 when ultrasonic or electromagnetic hardware, radio or cellular modules, installation labor, network gateways, head-end software, meter-data-management integration, and project management are included; consequently, a 100,000-account utility may need USD 12–35 million of upfront capital, excluding a further USD 1–4 million for customer portals, cyber controls, and legacy billing-system integration.
The hurdle is most severe for small systems: the U.S. water sector includes roughly 170,000 water and wastewater systems with widely varying fiscal capacity, and the Government Accountability Office notes that aging assets, emergency repair obligations, limited resources, and ratepayer affordability can make it difficult or impossible for some utilities to expand budgets for new cybersecurity and digital infrastructure.
Suppliers can mitigate the constraint through leasing, meter-as-a-service, performance-based NRW contracts, cellular-connectivity bundles, phased district rollouts, and financing partnerships, but large upfront commitments remain a material medium-term restriction across emerging APAC, Latin America, Africa, and financially constrained North American utilities, resulting in an estimated -2.0-percentage-point drag on baseline CAGR.
Restraint Impact Analysis
| Restraint | (~) % Impact on CAGR Forecast | Geographic Relevance | Impact Timeline |
|---|---|---|---|
| High deployment CapEx | -2.0 pp | Emerging APAC, LATAM, Africa, small U.S. utilities | Medium term (2–4 years) |
| Legacy-system integration cost | -1.5 pp | North America core, EU, Japan, Australia | Medium term (2–4 years) |
| Cybersecurity and privacy liability | -1.3 pp | North America, EU, Japan, South Korea, GCC | Long term (≥ 4 years) |
| Connectivity coverage gaps | -1.1 pp | Rural APAC, Africa, LATAM, remote Australia | Medium term (2–4 years) |
| Interoperability and vendor lock-in | -1.0 pp | EU, North America, India, APAC urban markets | Long term (≥ 4 years) |
| Weak utility revenue recovery | -0.9 pp | Africa, LATAM, South Asia, small municipalities | Long term (≥ 4 years) |
Opportunity Analysis
Meter-as-a-Service Contracts
Meter-as-a-service is a material commercial white space because most smart water meter deployments remain capital-equipment projects in which utilities must fund endpoints, installation, communications, software integration, and maintenance before operational benefits are demonstrated, whereas a subscription model converts a USD 120–350 installed endpoint cost into a predictable per-connection operating payment. This is an opportunity rather than a current market driver because aging assets and leakage already create baseline demand, but many utilities—especially small municipalities and emerging-market providers—cannot approve a USD 10–35 million upfront AMI program even when the lifecycle economics are favorable.
Under a 10–15-year contract, a provider can charge roughly USD 1.50–5.00 per meter per month for the device, installation, connectivity, meter-data management, firmware updates, cybersecurity, maintenance, and performance reporting; a 100,000-connection system would therefore create USD 1.8–6.0 million of annual recurring revenue and USD 18–90 million of contracted value before optional analytics. The model can be priced against measurable utility gains: a 1–3% increase in billable water capture, a 10–25% reduction in meter-reading expense, or a 2–5% reduction in customer-side leakage can often cover the monthly service fee in high-tariff urban systems.
This commercial structure also lowers customer-acquisition friction because vendors can bundle financing, installation crews, telecom connectivity, and software into a single procurement line, while utility management avoids long capital-approval cycles and can scale district by district. U.S. financing mechanisms such as WIFIA and State Revolving Fund programs are designed to provide subsidized financing for large water, wastewater, and stormwater modernization projects, creating a potential capital source for providers and their utility clients.
The provider assumes credit, asset-utilization, replacement, and performance risk, so successful models need payment-security mechanisms, standardized hardware, remote diagnostics, and clear treatment of non-payment or tampering. If scaled through financial partnerships rather than vendor balance sheets alone, meter-as-a-service could add approximately +1.9 percentage points to market CAGR in North America, Europe, India, Latin America, and African urban systems within two years.
Opportunity Impact Analysis
| Opportunity | (~) % Potential CAGR | Geographic Relevance | Execution Window |
|---|---|---|---|
| Meter-as-a-service contracts | +1.9 pp | North America, EU, India, LATAM, Africa | Short term (≤ 2 years) |
| AI leak-outcome platforms | +1.7 pp | EU, North America, GCC, Australia, China | Medium term (2–4 years) |
| Smart-meter digital twins | +1.5 pp | North America, EU, Japan, Singapore, GCC | Medium term (2–4 years) |
| Prepaid inclusion-meter networks | +1.4 pp | Africa, South Asia, Southeast Asia, LATAM | Short term (≤ 2 years) |
| Water-quality sensing bundles | +1.2 pp | EU, North America, China, India, GCC | Long term (≥ 4 years) |
| Regional utility-platform roll-ups | +1.0 pp | India, ASEAN, LATAM, Eastern Europe, Africa | Medium term (2–4 years) |
Challenges Analysis
Utility Data-Skills Gap
Smart water metering increasingly shifts utility work from manual meter reading toward device management, connectivity operations, data validation, customer analytics, cybersecurity, leak triage, and digital billing, but the supply of personnel able to operate across these disciplines remains materially below the requirements of large-scale AMI programs. This is an operational challenge rather than a hard restraint because utilities can procure and install meters, yet value capture slows when data is not analyzed, alarms are not triaged, firmware is not maintained, or billing and leak-detection workflows remain dependent on a small number of experienced staff.
A 100,000-endpoint AMI network can generate 2.4 million hourly readings each day and more than 875 million records annually; without data engineers, meter-data-management specialists, GIS analysts, field-operations coordinators, and customer-service teams trained to act on exceptions, utilities typically revert to daily or monthly reporting and capture only a fraction of potential leak, billing, and demand-management value.
A 2026 study of smart water meter adoption found that water utilities were conducting limited analysis of meter readings and faced difficulty recruiting and retaining the skilled technical and analytical staff needed to support deployments. The workforce issue is broader than analytics: EPA’s water-sector workforce initiative identifies aging infrastructure, retirements, new technologies, and cybersecurity as compounding staffing challenges, while a 2026 EPA grant round made USD 10.8 million available for training, apprenticeships, and regional workforce partnerships.
For a medium-sized utility, an under-resourced AMI team may add 20–40% to alert-response time, leave 5–15% of meters with unresolved communication or data-quality issues, and reduce the rate at which detected leaks turn into completed repairs. Vendors must therefore bundle managed analytics, remote device operations, low-code workflows, standardized dashboards, multilingual support, and utility academy programs into deployments rather than treating workforce development as the customer’s responsibility. Until operators, engineers, and billing teams are reskilled at scale, the data-skills gap will impose an estimated -1.3-percentage-point long-term drag across North America, Europe, APAC, and Latin American water systems.
Challenges Impact Analysis
| Challenge | (~) % CAGR Friction Drag | Geographic Relevance | Mitigation Horizon |
|---|---|---|---|
| Utility data-skills gap | -1.3 pp | North America, EU, APAC, LATAM | Long term (≥ 4 years) |
| Endpoint lifecycle reliability | -1.1 pp | Global, strongest in harsh-climate markets | Long term (≥ 4 years) |
| Multi-system data integration | -1.0 pp | North America core, EU, Japan, Australia | Medium term (2–4 years) |
| Field-installation execution variability | -0.9 pp | India, Africa, LATAM, Southeast Asia | Medium term (2–4 years) |
| Cyber-resilience operating burden | -0.9 pp | North America, EU, GCC, advanced APAC | Long term (≥ 4 years) |
| Analytics-to-repair conversion gap | -0.8 pp | Global, strongest in small utilities | Medium term (2–4 years) |
Geopolitical Impact Analysis
In Ukraine, the World Bank, European Commission, United Nations, and Ukrainian government estimated in February 2026 that total reconstruction and recovery needs had reached nearly USD 588 billion, while direct damage exceeded USD 195 billion. Rebuilding water, energy, housing, and municipal infrastructure is expected to create demand for digital meters, remote monitoring, leak detection, and automated billing systems as damaged networks are replaced.
Gaza shows the same need from a more severe humanitarian angle. A 2026 UN-backed damage assessment estimated USD 1.7 billion in water, sanitation, and hygiene infrastructure damage, with about 88% of above-ground assets and 76% of underground networks partly or fully damaged. In March 2026, around 70% of water moving through Gaza City’s damaged distribution network was still being lost. These conditions raise the importance of accurate metering, pressure monitoring, and rapid leak identification during reconstruction.
Regional Insights
In 2025, North America held a dominant position in the Smart Water Meters Market, capturing more than a 34.50% share and USD 1.55 billion. The region benefits from mature water utilities, established AMI networks, and rising investment in digital water management. EPA reports that an average American uses around 82 gallons of water per day, while a four-person household can use about 10,000 gallons over 30 days. Such consumption levels encourage utilities to use smart meters for better billing, conservation, and leak identification.
Europe is developing rapidly as regulatory programs accelerate smart-meter deployment and water-efficiency investment. Ofwat approved £1.7 billion for the installation of 10.4 million smart meters between 2025 and 2030, alongside more than £700 million for leakage reduction. The regulator expects leakage to decline by another 17% during this period. In 2026, the European Commission also stated that smart meters can reduce water consumption by up to 25%, while digital systems can deliver an additional 5–8% saving.
North America and Europe are seeing strong adoption because utilities increasingly need frequent consumption data, remote billing, and early leak detection. The U.S. EPA notes that Advanced Metering Infrastructure can provide hourly or more frequent water-use data, allowing utilities to identify abnormal consumption and leaks much faster than conventional monthly or quarterly readings.
Key Regions and Countries Insights
- North America
- US
- Canada
- Europe
- Germany
- France
- The UK
- Spain
- Italy
- Rest of Europe
- Asia Pacific
- China
- Japan
- South Korea
- India
- Australia
- Rest of APAC
- Latin America
- Brazil
- Mexico
- Rest of Latin America
- Middle East & Africa
- GCC
- South Africa
- Rest of MEA
Key Players Analysis
Itron, Inc. remained an important smart metering and utility technology provider in 2025, supported by connected water meters, communication networks, software, and analytics. The company generated about USD 2.4 billion in revenue during 2025, while adjusted EBITDA increased 16% to USD 373.8 million. Itron ended the year with a total backlog of USD 4.5 billion. Its product mix continued shifting toward higher-value connected solutions, with higher smart water shipments partly offsetting weaker traditional water meter sales.
Landis+Gyr Group AG strengthened its smart metering business in FY2025 through large AMI deployments, connected devices, and software-enabled utility services. Net revenue reached USD 1.166 billion, up 4.2%, while adjusted EBITDA rose 10.9% to USD 167.5 million. The company reported a committed backlog of USD 3.893 billion and more than 180 million connected intelligent devices globally. Its installed smart metering base also enabled an estimated 8.0 million tonnes of CO₂ savings during FY2025.
Xylem Inc., through Sensus and its Measurement and Control Solutions business, maintained a strong position in smart water metering during 2025. Xylem generated USD 9.035 billion in total revenue, while Measurement and Control Solutions revenue increased 11.5% to USD 2.086 billion. Smart metering and related applications contributed USD 171 million of organic revenue growth. In May 2026, Xylem sold Sensus International operations outside North America while retaining its North American Sensus business as a strategic metering platform.
Top Key Players Outlook
- Itron, Inc.
- Landis+Gyr Group AG
- Xylem Inc. (Sensus)
- Badger Meter, Inc.
- Kamstrup A/S
- Diehl Metering GmbH
- Honeywell International Inc. (Elster)
- Neptune Technology Group Inc.
- Aclara Technologies LLC
- Arad Group
- ZENNER International GmbH & Co. KG
- B METERS S.r.l.
- Siemens AG
- Apator S.A.
- Sagemcom SAS
Recent Developments
- In November 2025, Diehl Metering and TEXNOPARK opened a smart water meter production line in Tashkent with capacity of 350,000 units per year, producing ARIES DN15 and AURIGA DN20 models; the wider rollout plans 673,000 smart meters over 7 years.
- Kamstrup A/S also completed the acquisition of Saint-Gobain’s IoT Solutions business during 2025, adding further digital capabilities. Kamstrup generated DKK 3.5 billion in 2025 revenue, up 15%, while EBIT reached DKK 651 million, rising 153%, and order intake increased 36% to DKK 3.6 billion.
Report Scope
| Report Features | Description |
|---|---|
| Market Value (2025) | USD 4.5 Bn |
| Forecast Revenue (2035) | USD 35.0 Bn |
| CAGR (2026-2035) | 21.9% |
| Base Year for Estimation | 2025 |
| Historic Period | 2020-2024 |
| Forecast Period | 2026-2035 |
| Report Coverage | Revenue Forecast, Market Dynamics, Competitive Landscape, Recent Developments |
| Segments Covered | By Meter Type (Electromagnetic Meters, Ultrasonic Meters, Smart Mechanical Meters, Hybrid Meters), By Component (Meters and Accessories, IT Solutions, Communication Networks, Services), By Technology (Automatic Meter Reading, Advanced Metering Infrastructure), By End User (Residential, Commercial, Industrial, Municipal) |
| Regional Analysis | North America – US, Canada; Europe – Germany, France, The UK, Spain, Italy, Rest of Europe; Asia Pacific – China, Japan, South Korea, India, Australia, Singapore, Rest of APAC; Latin America – Brazil, Mexico, Rest of Latin America; Middle East & Africa – GCC, South Africa, Rest of MEA |
| Competitive Landscape | Itron, Inc., Landis+Gyr Group AG, Xylem Inc. (Sensus), Badger Meter, Inc., Kamstrup A/S, Diehl Metering GmbH, Honeywell International Inc. (Elster), Neptune Technology Group Inc., Aclara Technologies LLC, Arad Group, ZENNER International GmbH & Co. KG, B METERS S.r.l., Siemens AG, Apator S.A., Sagemcom SAS |
| Customization Scope | Customization for segments, region/country-level will be provided. Moreover, additional customization can be done based on the requirements. |
| Purchase Options | We have three licenses to opt for: Single User License, Multi-User License (Up to 5 Users), Corporate Use License (Unlimited User and Printable PDF) |





































