


Report Overview
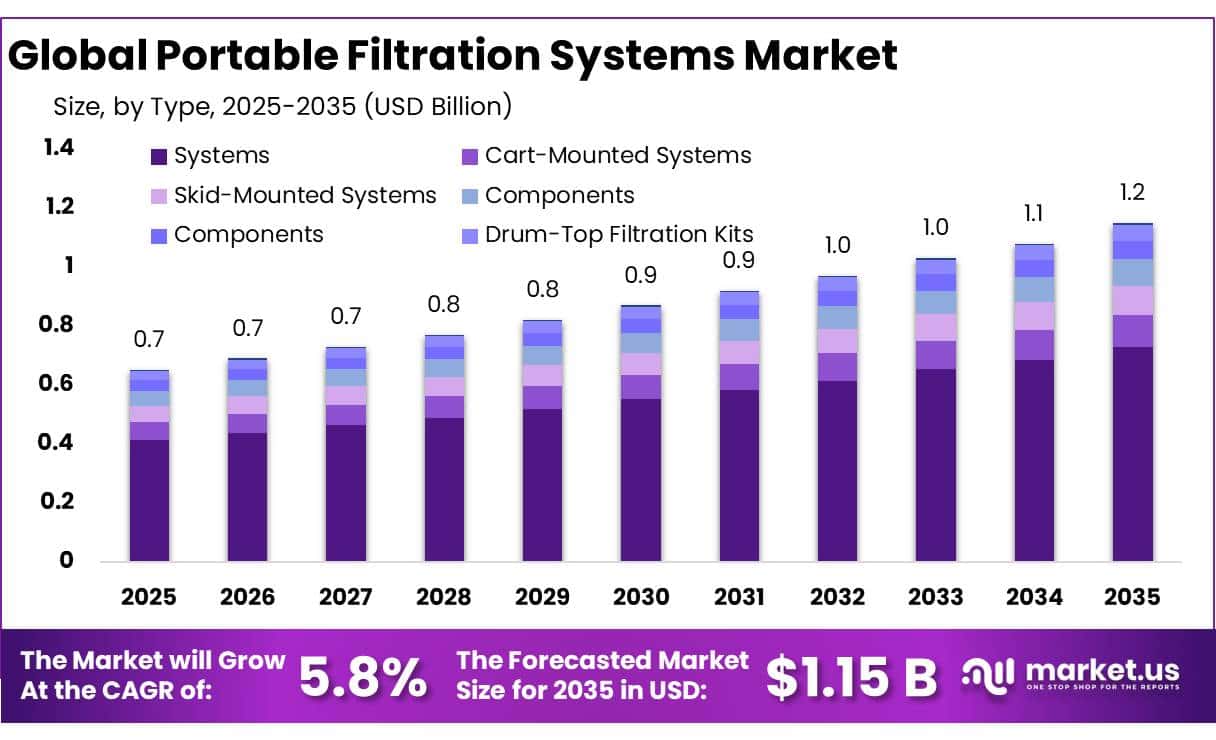
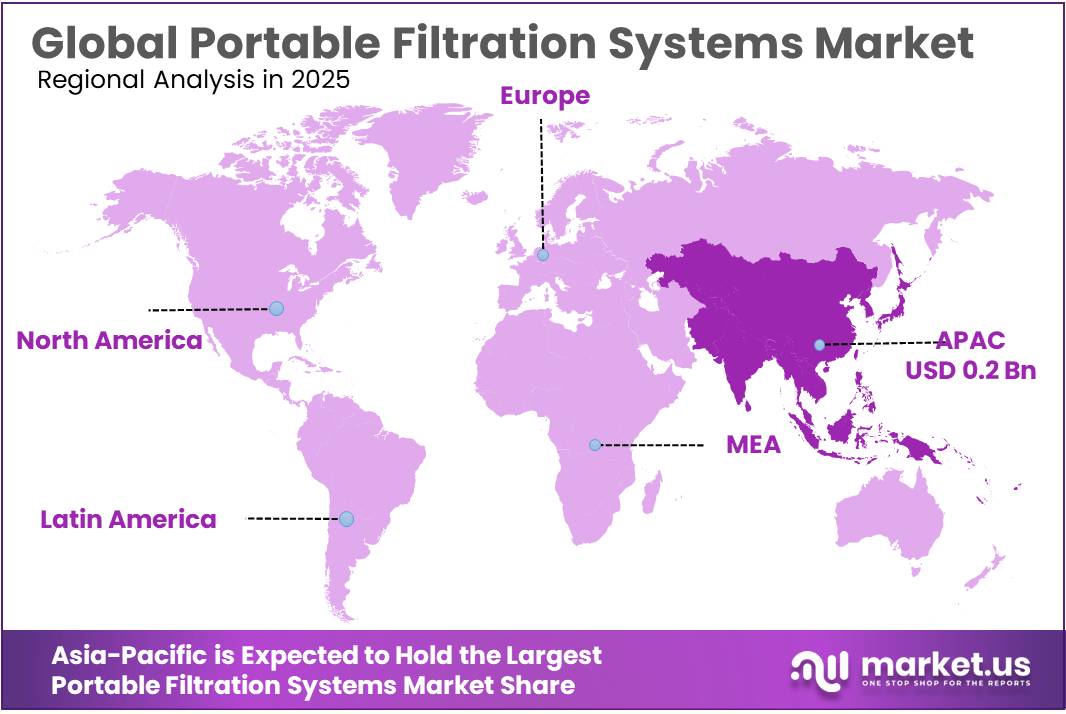
The Global Portable Filtration Systems Market size is expected to be worth around USD 1.15 Billion by 2035, from USD 0.65 Billion in 2025, growing at a CAGR of 5.8% during the forecast period from 2026 to 2035. In 2025, Asia-Pacific held a dominant market position, capturing more than a 42.34% share, holding USD 0.2 Billion revenue.
Portable filtration systems are mobile units designed to remove solid particles, water, sludge, and other contaminants from industrial liquids such as hydraulic oil, lubricants, fuels, coolants, and process water. They are commonly supplied as cart-mounted, skid-mounted, vacuum-assisted, or compact transfer units. Unlike permanently installed filtration equipment, portable systems can be moved between machines, storage tanks, production lines, and maintenance areas.
- According to the US Geological Survey (USGS), self-supplied industrial water withdrawals reached 14.8 billion gallons per day in 2015, accounting for approximately 5% of total US water withdrawals. Industrial withdrawals were also 9% lower than in 2010, reflecting changes in industrial activity and water-use efficiency. These figures demonstrate why manufacturers increasingly consider water recovery, fluid conditioning, and contamination management as part of operational planning.
Demand is further influenced by water-efficiency programmes and environmental compliance requirements. The EPA provides resources for industrial water reuse across manufacturing, energy generation, food processing, and mining. Its guidance includes more than 100 international case studies in the broader 2012 Guidelines for Water Reuse, demonstrating different approaches to reclaimed-water treatment and reuse. The EPA also maintains an Industrial Wastewater Treatment Technology Database to help facilities compare treatment performance and identify suitable technologies.
The power-generation sector also presents an important application area. USGS estimates show that 1,122 water-using, utility-scale thermoelectric power plants in the United States withdrew approximately 103 billion gallons per day in 2015. Although this figure relates to cooling-water withdrawals rather than portable filtration demand, it highlights the scale of water-intensive industrial operations. Portable filtration equipment can assist with selected fluid-conditioning and water-treatment tasks at power facilities, particularly during equipment servicing and temporary operating requirements.
Technological improvements are shaping product development. Manufacturers are focusing on compact designs, higher filtration efficiency, multiple filter-element options, pressure monitoring, and easier movement between work areas. Portable systems are also being integrated into preventive maintenance programmes, where regular fluid sampling and filtration help control contamination before it affects equipment performance. International Standard ISO 23043:2021 provides a framework for evaluating industrial wastewater treatment and reuse processes through technology, environmental, resource, and economic indicators.
Key Takeaways
- Portable Filtration Systems Market size is expected to be worth around USD 1.15 Billion by 2035, from USD 0.65 Billion in 2025, growing at a CAGR of 5.8%.
- Systems held a dominant market position, capturing more than a 63.45% share.
- Pressure Filtration held a dominant market position, capturing more than a 46.22% share.
- (0-10 GPM) held a dominant market position, capturing more than a 53.45% share.
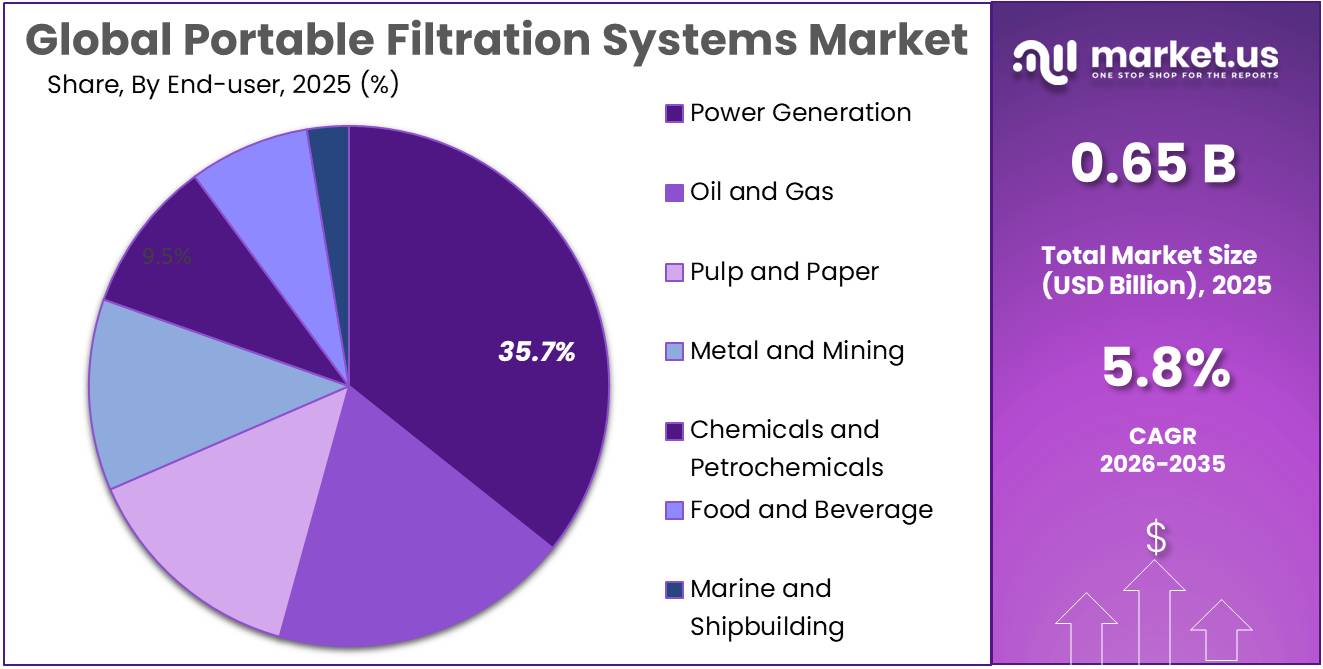
- Power Generation held a dominant market position, capturing more than a 35.78% share.
- Asia-Pacific dominated the Portable Filtration Systems Market in 2025, accounting for 42.34% of the global market, with reported revenue of USD 0.2 billion.
By Type Analysis
Systems lead the market with a 63.45% share in 2025, supported by their flexibility across industrial applications.
In 2025, “Systems” held a dominant market position, capturing more than a 63.45% share of the Portable Filtration Systems Market. Their leading position is supported by their ability to remove contaminants from industrial fluids and support equipment maintenance across different operating environments. Portable filtration systems are used for hydraulic oil, lubricants, fuels, and process liquids, allowing facilities to clean fluids without depending entirely on fixed filtration installations. Their mobility also makes them suitable for servicing multiple machines, tanks, and production areas.
In 2025, “Systems” held a dominant market position, capturing more than a 63.45% share of the Portable Filtration Systems Market. Their leading position is supported by their ability to remove contaminants from industrial fluids and support equipment maintenance across different operating environments. Portable filtration systems are used for hydraulic oil, lubricants, fuels, and process liquids, allowing facilities to clean fluids without depending entirely on fixed filtration installations. Their mobility also makes them suitable for servicing multiple machines, tanks, and production areas.
By Technology Analysis
Pressure Filtration leads the market with a 46.22% share in 2025, supported by its effective contaminant removal and suitability for industrial fluid processing.
In 2025, “Pressure Filtration” held a dominant market position, capturing more than a 46.22% share of the Portable Filtration Systems Market. This technology uses pressure to push fluids through filter media, separating suspended particles and other contaminants. It is widely suited to industrial applications involving hydraulic oil, lubricants, fuels, and process liquids. Its ability to provide controlled filtration makes it useful for routine maintenance, fluid cleaning, and equipment protection.
Centrifugal Filtration separates contaminants from liquids by using rotational force. During operation, denser particles move away from the central flow, allowing them to be collected and removed from the fluid. This technology can be useful in industrial applications involving lubricants, coolants, wastewater, and process liquids, particularly where solid contaminants need to be separated without relying entirely on conventional filter media. It supports fluid maintenance and can help reduce the particle load in industrial systems. The US Geological Survey reported that industrial water withdrawals in the United States reached 14.8 billion gallons per day in 2015, representing approximately 5% of total national water withdrawals.
By Flow Rate Analysis
The (0-10 GPM) segment leads with a 53.45% share in 2025, supported by its suitability for low-volume industrial filtration tasks.
In 2025, “(0-10 GPM)” held a dominant market position, capturing more than a 53.45% share of the Portable Filtration Systems Market. This flow-rate category is suitable for applications that require controlled filtration at relatively low fluid volumes. These systems are commonly used for cleaning hydraulic oil, lubricants, and other industrial fluids in individual machines, smaller equipment units, and maintenance areas. Their compact design and ease of movement make them useful for routine fluid conditioning and contamination control.
(10-20 GPM) portable filtration systems are suitable for industrial facilities that require higher fluid-handling capacity than smaller maintenance units. They can be used to filter hydraulic oil, lubricants, fuels, and process fluids in larger machinery, storage tanks, and production equipment. This flow-rate range provides a balance between filtration capacity and portability, making it useful for maintenance teams that handle multiple fluid systems. The US Geological Survey reported that self-supplied industrial water withdrawals in the United States reached 14.8 billion gallons per day in 2015, representing approximately 5% of total national water withdrawals.
By End User Analysis
Power Generation leads the market with a 35.78% share in 2025, supported by the need for reliable fluid maintenance in power facilities.
In 2025, “Power Generation” held a dominant market position, capturing more than a 35.78% share of the Portable Filtration Systems Market. Power plants use portable filtration systems to clean turbine oil, lubricants, hydraulic fluids, and other operating liquids. These systems help remove solid particles and moisture that can affect equipment performance and increase maintenance requirements. Their mobile design allows maintenance teams to move filtration units between turbines, pumps, hydraulic equipment, and storage tanks.
Oil and Gas facilities use portable filtration systems to remove particles, water, and other contaminants from hydraulic fluids, lubricants, fuels, and selected process liquids. These systems support fluid conditioning during equipment maintenance, drilling operations, production activities, and pipeline-related work. Their mobility allows operators to service equipment at different locations without depending entirely on permanently installed filtration units. The US Energy Information Administration reported that the United States produced an average of approximately 13.2 million barrels of crude oil per day in 2024, demonstrating the scale of upstream activity that requires reliable equipment and fluid management.
Key Market Segments
By Type
- Systems
- Cart-Mounted Systems
- Skid-Mounted Systems
- Components
- Suction/Vacuum Portable Units
- Drum-Top Filtration Kits
- Others
By Technology
- Pressure Filtration
- Centrifugal Filtration
- Vaccum Filtration
By Flow Rate
- (0-10 GPM)
- (10-20 GPM)
- (20-60 GPM)
- Above 60 GPM
By End User
- Oil and Gas
- Power Generation
- Pulp and Paper
- Metal and Mining
- Chemicals and Petrochemicals
- Food and Beverage
- Marine and Shipbuilding
- Others
Driver Analysis
Downtime-Cost Avoidance — +0.7 Percentage Points
The strongest direct purchasing mechanism is the ability to address fluid contamination without routinely replacing the entire fluid charge or committing to a separate filtration installation for every asset. Pall identifies portable filtration applications across hydraulic, lubrication and industrial process-fluid systems, while Donaldson markets offline units for supplementing system cleanliness, flushing and transferring fluid; these establish commercially available maintenance functions, not a quantified guarantee of failure prevention.
In a constructed manufacturing-site case, a $12,000 portable unit used across ten machines needs to avoid only six hours of downtime at an assumed $2,000 contribution loss per hour to recover its purchase price before operating expenses. If it avoids ten hours annually but incurs $2,500 in elements, testing and labor, modeled annual net benefit is $17,500 and simple payback is approximately eight months; the assumed avoided downtime must be validated against maintenance history rather than treated as a universal outcome. The +0.7-point sensitivity assumes 30% of terminal counterfactual equipment revenue is exposed to downtime-sensitive applications and that stronger economic adoption produces approximately 11.3% cumulative outperformance, equivalent to 3.4% additional terminal market revenue.
Strategically, suppliers move from selling nominal flow capacity toward documented cleanliness outcomes, maintenance integration and application support. The driver is already active because contamination-control equipment is commercially deployed, but the model does not assume every hydraulic failure is contamination-related or that a portable cart substitutes for defective seals, damaged components or inadequate primary filtration.
Drivers Impact Analysis
| Driver | (~) % Impact on CAGR Forecast | Geographic Relevance | Impact Timeline |
|---|---|---|---|
| Downtime-cost avoidance | +0.7 pp | US, Germany, Japan, China | Short term (≤ 2 years) |
| Fluid-life extension | +0.6 pp | US, EU, India, China | Medium term (2–4 years) |
| Commissioning cleanliness requirements | +0.5 pp | China, India, US, Germany | Medium term (2–4 years) |
| Wind-fleet maintenance demand | +0.4 pp | China, US, Germany, India | Long term (≥ 4 years) |
| Condition-monitored filtration | +0.4 pp | US, EU, Japan, South Korea | Medium term (2–4 years) |
| Shared maintenance deployment | +0.4 pp | India, ASEAN, Brazil, US | Medium term (2–4 years) |
Restraint Analysis
Low-Utilization Payback Limits — −0.5 Percentage Points
The economic restraint is insufficient recoverable maintenance expenditure at low-duty-cycle sites: portability can reduce the number of units required, but it does not guarantee enough annual savings to justify ownership. Donaldson identifies fluid transfer, reservoir cleaning, repair flushing and supplemental offline filtration as established applications, making the investment case dependent on actual workload rather than a universal preventive-maintenance requirement.
In a constructed small-factory case, a $10,000 cart used for twelve jobs annually, each preserving $300 of fluid or maintenance value, generates $3,600 of gross benefit; subtracting $1,200 for elements and testing and $900 for incremental labor leaves $1,500 annually, implying approximately 6.7-year simple payback before financing and depreciation.
If a purchaser requires recovery within three years, annual net benefit must reach approximately $3,333—more than twice the modeled result. At forty otherwise comparable jobs, gross benefit rises to $12,000, demonstrating why adoption can remain attractive at larger sites while stalling among smaller customers. The −0.5-point sensitivity assumes 30% of terminal counterfactual equipment revenue is exposed to low-utilization purchasing decisions and experiences an 8% realization shortfall, equivalent to approximately 2.4% market-wide terminal revenue loss.
Strategically, vendors face pressure to offer lower-cost configurations, shared fleets or rental access; however, rental fees are outside this equipment-only forecast, and one rental unit serving several would-be purchasers can reduce equipment demand even while expanding access to filtration.
Restraint Impact Analysis
| Restraint | (~) % Impact on CAGR Forecast | Geographic Relevance | Impact Timeline |
|---|---|---|---|
| Low-utilization payback limits | −0.5 pp | India, ASEAN, Brazil; US, EU SMEs | Medium term (2–4 years) |
| Fixed-system substitution | −0.4 pp | US, Germany, Japan, China | Long term (≥ 4 years) |
| Fluid-compatibility exclusions | −0.3 pp | US, EU, China, India | Long term (≥ 4 years) |
| Contaminant-removal boundaries | −0.4 pp | US, EU, Japan, China | Long term (≥ 4 years) |
| Viscosity and throughput ceilings | −0.3 pp | Canada, Northern Europe, China, India | Medium term (2–4 years) |
| Site-suitability restrictions | −0.2 pp | US, EU, Gulf states, Australia | Long term (≥ 4 years) |
Opportunity Analysis
Underserved Rental-Fleet Expansion — +0.5 Percentage Points
The opportunity is to establish locally available rental fleets in customer clusters that cannot economically justify ownership, rather than simply benefit from the shared-maintenance deployment already included in baseline demand. Pall already offers emergency, short-term and semi-permanent rental equipment, including mobile oil purifiers, varnish-removal systems and cleanliness monitors, proving that the commercial model exists but not establishing that the proposed regional markets are underserved. Local white space must therefore be validated through customer density, existing rental availability and response-time requirements.
In a constructed regional fleet, twenty units purchased at USD 20,000 each require USD 400,000 of equipment investment; utilization of 100 billable days per unit at USD 180 daily generates USD 360,000 of annual rental revenue. Assuming USD 120,000 of transport, maintenance, inspection and administration expense, annual operating contribution is USD 240,000 before depreciation and financing, implying approximately 1.7-year simple fleet-investment recovery; at fifty billable days, contribution falls to USD 60,000 if the same expense base persists.
Those rental economics support the buyer’s investment decision but are not themselves counted in the equipment-market forecast. The +0.5-point sensitivity requires approximately 2.4% incremental terminal equipment revenue from new fleet purchases and replacements, net of direct purchases displaced by rental access. The strategic requirement is a route-dense service network with application support and asset tracking; geographically dispersed customers, weak utilization or existing fleet capacity can eliminate the upside even when end-user interest is strong.
Opportunity Impact Analysis
| Opportunity | (~) % Potential CAGR Upside | Geographic Relevance | Execution Window |
|---|---|---|---|
| Underserved rental-fleet expansion | +0.5 pp | India, Indonesia, Vietnam, Brazil | Medium term (2–4 years) |
| Dielectric-oil conditioning packages | +0.5 pp | US, India, Germany, China | Medium term (2–4 years) |
| Hazardous-area portable platforms | +0.4 pp | US, Gulf states, EU, Australia | Long term (≥ 4 years) |
| Verified-outcome equipment packages | +0.4 pp | US, Germany, Japan, South Korea | Medium term (2–4 years) |
| OEM-integrated maintenance kits | +0.3 pp | China, India, Germany, Japan | Short term (≤ 2 years) |
| Capability-led acquisition platforms | +0.3 pp | US, Germany, Benelux, Singapore | Short term (≤ 2 years) |
Challenges Analysis
Cleanliness Measurement Consistency — −0.4 Percentage Points
The operational vulnerability is disagreement between field measurements, laboratory results and customer acceptance criteria, particularly when sampling conditions introduce air or inconsistent flow rather than a genuine change in particle contamination. MP Filtri’s installation guidance specifies downstream check-valve arrangements to prevent backflow and air expansion across the analysis chamber, warning that otherwise air can increase apparent particle counts and cleanliness codes; its 2026 monitoring brochure specifies accuracy of ±0.5 code at 4, 6 and 14 µm(c), with calibration based on ISO 11171.
Those specifications describe particular instruments, not every installed monitor, but demonstrate why a customer acceptance threshold should account for measurement uncertainty. In a constructed service network completing 600 treatments annually, an 8% disputed-result rate creates 48 investigations; two additional samples at USD 150 each plus four technician-hours at USD 50 add USD 500 per investigation, or USD 24,000 annually before travel. If each dispute also delays release of equipment for one day, another 48 fleet-days become unavailable; at an assumed USD 180 daily rental opportunity, the maximum additional revenue exposure is USD 8,640, subject to actual bookings.
The −0.4-point sensitivity assumes 20% of terminal opportunity-enabled equipment revenue is measurement-sensitive and suffers a 9.5% realization shortfall, producing approximately 1.9% aggregate terminal friction through delayed qualifications, disputed performance and weaker repeat orders. Mitigation requires agreed sampling locations, stable operating conditions, instrument verification and acceptance protocols that distinguish particle cleanliness from overall oil health; testing expense alone is not counted as equipment-market revenue loss.
Challenges Impact Analysis
| Challenge | (~) % CAGR Friction Drag | Geographic Relevance | Mitigation Horizon |
|---|---|---|---|
| Cleanliness Measurement Consistency | −0.4 pp | US, EU, Japan, China | Medium term (2–4 years) |
| Cross-Fluid Changeover Discipline | −0.3 pp | US, Germany, India, Singapore | Medium term (2–4 years) |
| Field Deployment Workforce Capability | −0.3 pp | US, EU, India, Gulf states | Long term (≥ 4 years) |
| Treatment Endpoint Variability | −0.3 pp | US, EU, China, India | Long term (≥ 4 years) |
| Component and Logistics Synchronization | −0.3 pp | China–EU, India–EU, Asia–US | Medium term (2–4 years) |
| Rental-Fleet Readiness Coordination | −0.2 pp | India, ASEAN, Brazil, US | Medium term (2–4 years) |
Geopolitical Impact Analysis
Geopolitical Impact of the 2026 Middle East War on the Portable Filtration Systems Market
The ongoing Middle East conflict and the Russia-Ukraine war are creating pressure on the Portable Filtration Systems Market through higher energy costs, shipping delays, and supply-chain uncertainty. Portable filtration manufacturers depend on metals, pumps, motors, filter media, and other industrial components, making production and transportation costs sensitive to these disruptions. The International Energy Agency reported that around 20% of global liquefied natural gas supply moved through the Strait of Hormuz in 2025, highlighting the importance of this trade route.
The World Bank’s October 2026 outlook projects global energy prices to increase by 32% in 2026, while overall commodity prices are expected to rise 23%. Higher energy and freight costs can increase manufacturing expenses and raise the cost of delivering filtration equipment to industrial customers.
These conditions may delay equipment purchases and maintenance investments, particularly among oil and gas, chemical, and power-generation operators facing higher operating costs. At the same time, the need to protect machinery, recover industrial fluids, and maintain reliable operations may support demand for portable filtration units. Manufacturers with diversified suppliers, regional inventory, and flexible sourcing arrangements may be better positioned to manage these disruptions.
Regional Insights
Asia-Pacific – Dominating Region
Asia-Pacific dominated the Portable Filtration Systems Market in 2025, accounting for 42.34% of the global market, with reported revenue of USD 0.2 billion. Regional demand is supported by industrial manufacturing, power generation, chemical processing, mining, and oil and gas operations. These industries require filtration equipment to maintain hydraulic fluids, lubricants, fuels, and process liquids.
The Asian Development Bank’s Asian Water Development Outlook 2025 estimates that Asia and the Pacific will require USD 3,998 billion in water infrastructure investment between 2025 and 2040, equivalent to USD 249.8 billion annually. This investment requirement highlights the region’s growing focus on water infrastructure, industrial treatment, and resource efficiency. These developments support opportunities for portable filtration suppliers serving industrial facilities.
Southeast Asia presents an important growth opportunity within the wider Asia-Pacific region as manufacturing investment and industrial activity expand. According to the ASEAN Investment Report 2025, foreign direct investment inflows into ASEAN increased by 8% in 2024, reaching USD 226 billion. Manufacturing, electronics, electric vehicles, and pharmaceutical production were among the important investment areas. The expansion of industrial facilities can increase requirements for fluid maintenance, process-water treatment, and mobile filtration equipment.
Key Regions and Countries Insights
- North America
- US
- Canada
- Europe
- Germany
- France
- The UK
- Spain
- Italy
- Rest of Europe
- Asia Pacific
- China
- Japan
- South Korea
- India
- Australia
- Rest of APAC
- Latin America
- Brazil
- Mexico
- Rest of Latin America
- Middle East & Africa
- GCC
- South Africa
- Rest of MEA
Key Players Analysis
Bosch Rexroth AG operates in industrial technology, offering hydraulic and filtration-related solutions for industrial applications. In 2025, the company generated EUR 6.5 billion in sales revenue, supported by approximately 31,900 employees and operations in more than 80 countries. Its industrial technology portfolio includes hydraulic systems and components used in machinery and manufacturing. The company’s global service network and engineering capabilities support its position in industrial fluid management and equipment reliability.
Des-Case Corporation focuses on lubricant management, contamination control, and industrial filtration. Founded in 1983, the company offers portable filter carts, drum toppers, and heavy-duty TC Series filter carts for cleaning industrial oils. Its portable units are designed for small, medium, and large reservoirs, supporting fluid transfer, equipment commissioning, and routine maintenance. The company also provides vacuum dehydration systems designed to remove 100% of free and emulsified water and at least 90% of dissolved water from petroleum- and synthetic-based fluids.
Donaldson Company Inc. is a major filtration technology supplier serving industrial, mobile, and life sciences markets. Founded in 1915, the company reported USD 3.69 billion in revenue for fiscal year 2025 and approximately 15,000 employees. It operates through more than 150 facilities and has over 3,100 active patents. Its industrial filtration portfolio serves power generation, manufacturing, industrial hydraulics, and other applications. In fiscal 2025, its Industrial Solutions segment generated USD 1,104.4 million in net sales.
Top Key Players Outlook
- Bosch Rexroth AG
- Des-Case Corporation
- Donaldson Company Inc.
- Norman Filter Company LLC
- Trico Corporation
- MP Filtri S.p.A.
- Pall Corporation
- Parker Hannifin Corp
- HYDAC International GmbH
- Eaton Corporation
- Filtration Group Corp.
- Schroeder Industries LLC
- Harvard Corporation
- Y2K Filtration
- Kleentek Corporation
- Other Key Players
Recent Developments
- August 2026: Parker completed the acquisition of Filtration Group Corporation, expanding its filtration operations across life sciences, heating, ventilation and air conditioning, and industrial markets. The acquired business was expected to contribute approximately USD 1.8 billion to Parker’s fiscal 2027 sales during the first 10.5 months of ownership, while the company continued to target USD 220 million in pre-tax cost synergies by the end of year three.
- June 2026: Eaton introduced the IFPM 10 compact mobile offline fluid purification system. The unit operates at a flow rate of 10 litres per minute and removes free, emulsified and dissolved water, gases and particulate contamination from hydraulic and lubrication oils.
Report Scope
| Report Features | Description |
|---|---|
| Market Value (2025) | USD 0.65 Bn |
| Forecast Revenue (2035) | USD 1.15 Bn |
| CAGR (2026-2035) | 5.8% |
| Base Year for Estimation | 2025 |
| Historic Period | 2020-2024 |
| Forecast Period | 2026-2035 |
| Report Coverage | Revenue Forecast, Market Dynamics, Competitive Landscape, Recent Developments |
| Segments Covered | By Type (Systems, Cart-Mounted Systems, Skid-Mounted Systems, Components, Suction/Vacuum Portable Units, Drum-Top Filtration Kits, Others), By Technology (Pressure Filtration, Centrifugal Filtration, Vaccum Filtration), By Flow Rate ((0-10 GPM), (10-20 GPM), (20-60 GPM), Above 60 GPM), By End User (Oil and Gas, Power Generation, Pulp and Paper, Metal and Mining, Chemicals and Petrochemicals, Food and Beverage, Marine and Shipbuilding, Others) |
| Regional Analysis | North America – US, Canada; Europe – Germany, France, The UK, Spain, Italy, Rest of Europe; Asia Pacific – China, Japan, South Korea, India, Australia, Singapore, Rest of APAC; Latin America – Brazil, Mexico, Rest of Latin America; Middle East & Africa – GCC, South Africa, Rest of MEA |
| Competitive Landscape | Bosch Rexroth AG, Des-Case Corporation, Donaldson Company Inc., Norman Filter Company LLC, Trico Corporation, MP Filtri S.p.A., Pall Corporation, Parker Hannifin Corp, HYDAC International GmbH, Eaton Corporation, Filtration Group Corp., Schroeder Industries LLC, Harvard Corporation, Y2K Filtration, Kleentek Corporation, Other Key Players |
| Customization Scope | Customization for segments, region/country-level will be provided. Moreover, additional customization can be done based on the requirements. |
| Purchase Options | We have three licenses to opt for: Single User License, Multi-User License (Up to 5 Users), Corporate Use License (Unlimited User and Printable PDF) |








