One Stop Shop For Reports One Stop Shop For Reports
  • All Reports
  • All Sectors
    • Chemicals & Materials
      • Advanced Materials
      • Bulk Chemicals
      • Coatings | Paints and Additives
      • Composites
      • Renewable | Speciality chemicals
    • Consumer Goods
      • Baby Products
      • Consumer Electronics
      • Consumer Packaging
      • Cosmetics & Personal Care
      • Homecare & Decor
      • Luxury & premium products
    • Energy and Power
      • Energy Efficiency and Conservation
      • Green | Renewable Energy
      • Non Renewable | Conventional Energy
      • Power Equipment and Devices
    • Life Science
      • Biotechnology
      • Diagnostics
      • Healthcare
      • Healthcare IT
      • Medical Devices & Supplies
      • Pharmaceuticals
    • Food and Beverage
      • Agriculture & Agri Products
      • Beverages
      • Food Ingredients
      • Food Services and Hospitality
      • Nutraceutical | Wellness Food
      • Processed & Frozen Foods
    • Automotive and Transportation
      • Automotive components
      • Automotive Logistics
      • Automotive systems and accessories
    • Information and Communications Technology
      • E Commerce and Outsourcing
      • Entertainment & Media
      • High Tech | Enterprise & Consumer IT
      • Information & Network Security
      • Mobility | Telecom & Wireless
      • Software and Services
    • Semiconductor and Electronics
      • Semiconductor Materials and Components
      • Display Technology
      • Electronics System and Components
      • Emerging technologies
      • Security and Surveillance
      • Sensors and Controls
    • Building and Construction
      • Construction Materials
      • HVAC
      • Residential Construction and Improvement
      • Roads & Highways
    • Manufacturing
      • Manufacturing Services
      • Heavy Manufacturing
      • Packaging
      • Engineering | Equipment and Machinery
  • Who Trust Us
  • [email protected]
  • +1 718 874 1545 (International)
  • +91 78878 22626 (Asia)

More Results

One Stop Shop For Reports One Stop Shop For Reports
  • All Reports
  • All Sectors
    • Chemicals & Materials
      • Advanced Materials
      • Bulk Chemicals
      • Coatings | Paints and Additives
      • Composites
      • Renewable | Speciality chemicals
    • Consumer Goods
      • Baby Products
      • Consumer Electronics
      • Consumer Packaging
      • Cosmetics & Personal Care
      • Homecare & Decor
      • Luxury & premium products
    • Energy and Power
      • Energy Efficiency and Conservation
      • Green | Renewable Energy
      • Non Renewable | Conventional Energy
      • Power Equipment and Devices
    • Life Science
      • Biotechnology
      • Diagnostics
      • Healthcare
      • Healthcare IT
      • Medical Devices & Supplies
      • Pharmaceuticals
    • Food and Beverage
      • Agriculture & Agri Products
      • Beverages
      • Food Ingredients
      • Food Services and Hospitality
      • Nutraceutical | Wellness Food
      • Processed & Frozen Foods
    • Automotive and Transportation
      • Automotive components
      • Automotive Logistics
      • Automotive systems and accessories
    • Information and Communications Technology
      • E Commerce and Outsourcing
      • Entertainment & Media
      • High Tech | Enterprise & Consumer IT
      • Information & Network Security
      • Mobility | Telecom & Wireless
      • Software and Services
    • Semiconductor and Electronics
      • Semiconductor Materials and Components
      • Display Technology
      • Electronics System and Components
      • Emerging technologies
      • Security and Surveillance
      • Sensors and Controls
    • Building and Construction
      • Construction Materials
      • HVAC
      • Residential Construction and Improvement
      • Roads & Highways
    • Manufacturing
      • Manufacturing Services
      • Heavy Manufacturing
      • Packaging
      • Engineering | Equipment and Machinery
  • Who Trust Us
Home ➤ Energy and Power ➤ Smart Plantation Management Systems Market
Smart Plantation Management Systems Market
Published date: Sep 2026 • Formats:
[email protected] +1 718 874 1545
Request Sample Schedule a Call
Table of Contents
  • Report Overview
  • Key Takeaways
  • By System Type Analysis
  • By Component Analysis
  • By Crop Type Analysis
  • By End User Analysis
  • Key Market Segments
  • Driver Analysis
  • Restraint Analysis
  • Opportunity Analysis
  • Challenges Analysis
  • Geopolitical Impact Analysis
  • Regional Insights
  • Key Players Analysis
  • Recent Developments
  • Report Scope
  • Home ➤ Energy and Power ➤ Smart Plantation Management Systems Market

Smart Plantation Management Systems Market Size, Share and Report Analysis By System Type (Irrigation systems, Plant-growth monitoring systems, Harvesting systems, Other systems), By Component (Hardware, Software, Services), By Crop Type (Coffee, Tea, Cocoa, Sugarcane, Cotton, Oil palm, Other plantation crops), By End User (Large plantation owners, Agribusiness companies, Government and research institutions, Other end users) , By Region and Companies - Industry Segment Outlook, Market Assessment, Competition Scenario, Trends and Forecast 2026-2035

  • Published date: Sep 2026
  • Report ID: 193661
  • Number of Pages: 203
  • Format:
Fact Checked
Smart Plantation Management Systems Market https://market.us/report/smart-plantation-management-systems-market/
Cite this Research
  • Overview
  • Table of Contents
  • Segmentation
  • currency-icon
    Revenue, 2025 (US$B)
    1.6 Bn
    growth-icon
    Forecast, 2035 (US$B)
    2.8 Bn
    chart-icon
    CAGR, 2026-2035
    5.7%
    globe-icon
    Leading Region
    Asia Pacific

    Quick Navigation

    • Report Overview
    • Key Takeaways
    • By System Type Analysis
    • By Component Analysis
    • By Crop Type Analysis
    • By End User Analysis
    • Key Market Segments
    • Driver Analysis
    • Restraint Analysis
    • Opportunity Analysis
    • Challenges Analysis
    • Geopolitical Impact Analysis
    • Regional Insights
    • Key Players Analysis
    • Recent Developments
    • Report Scope

    Report Overview

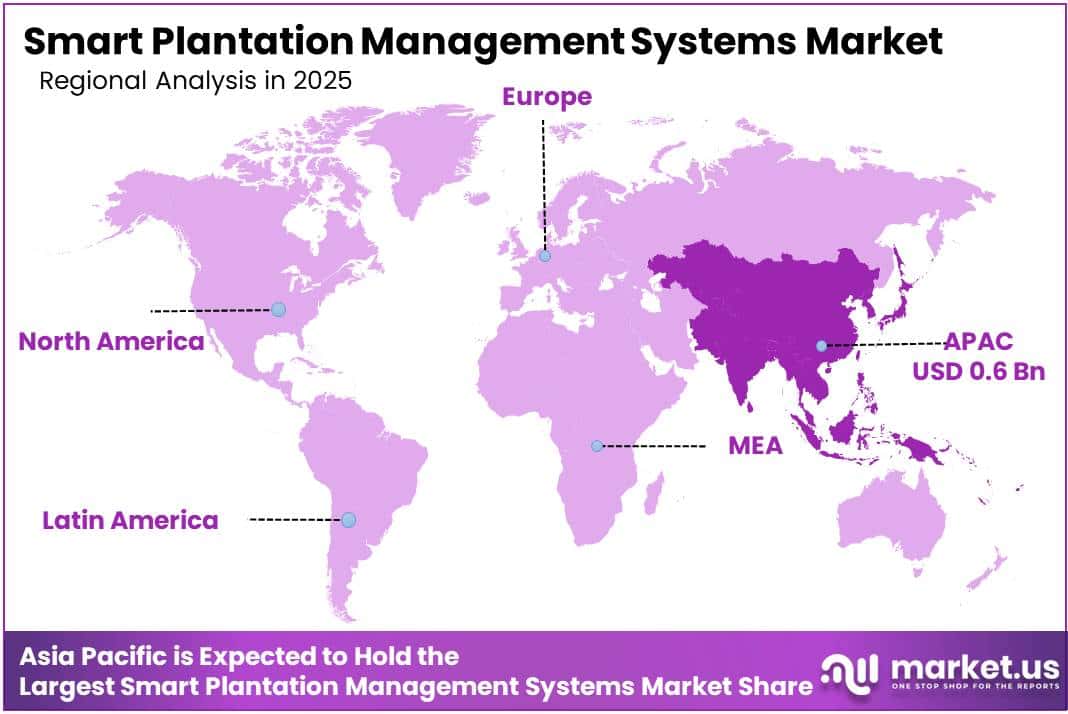
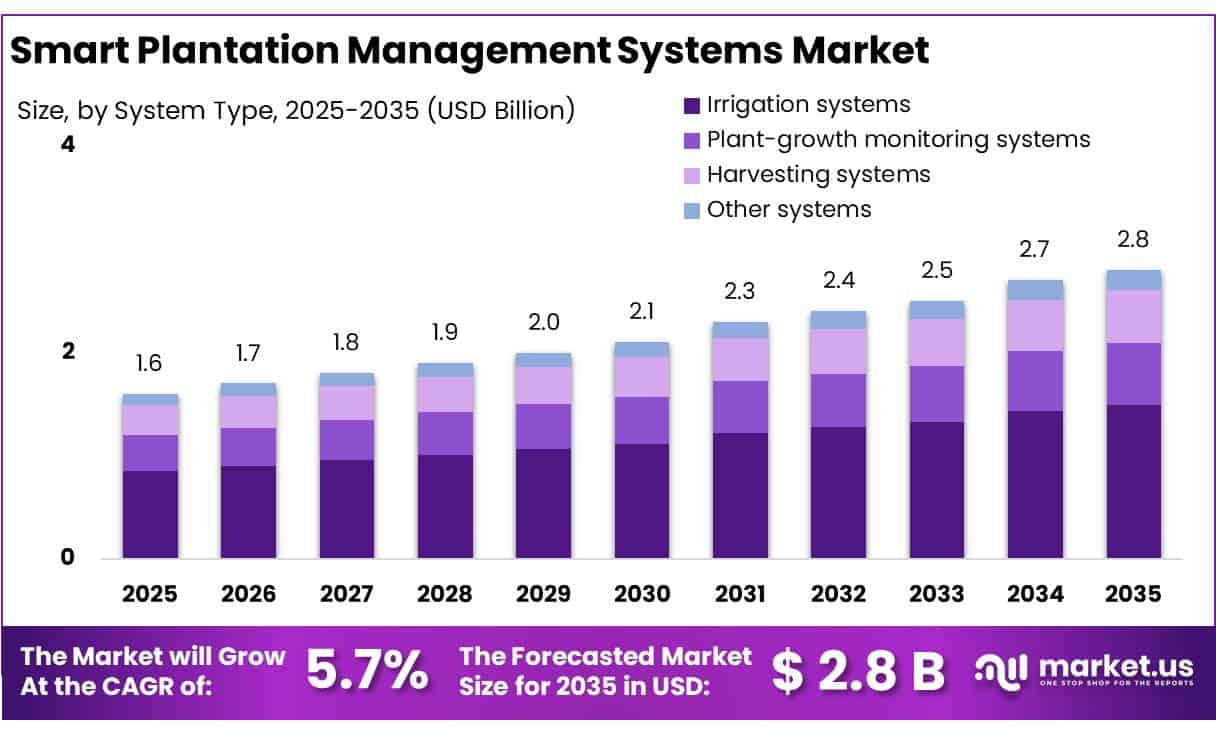
    The Global Smart Plantation Management Systems Market size is expected to be worth around USD 2.8 Billion by 2035, from USD 1.6 Billion in 2025, growing at a CAGR of 5.7% during the forecast period from 2026 to 2035. In 2025, Asia Pacific held a dominant market position, capturing more than a 38.50% share, holding USD 0.62 Billion revenue.

    Smart plantation management systems combine sensors, satellite imagery, drones, GPS, weather data, irrigation controls, farm-management software and artificial intelligence to manage plantations precisely. These systems help plantation operators monitor soil moisture, crop health, pests, nutrients and field conditions in real time, allowing inputs to be applied where needed.

    • The industry is moving from isolated farm devices toward connected management platforms. In the United States, USDA reported in 2025 that 85% of farms had internet access, 74% used cellular data plans and 82% had smartphones. Precision agriculture practices, including GPS guidance, yield monitoring, soil mapping, variable-rate applications and drones, were used by 22% of U.S. farms. This digital base supports plantation dashboards, remote equipment control and data-driven field decisions.
    Smart Plantation Management Systems Market
    European agriculture is moving in the same direction, although adoption remains uneven. A 2026 European Commission study found that two-thirds of surveyed end users relied daily on connected tools such as IoT sensors, machinery telematics, drones and farm-management platforms, while more than four in five considered field connectivity highly important. Under EU Common Agricultural Policy strategic plans, around 378,000 farms are expected to receive support for digital farming technologies, with more than 20,000 farms benefiting from actions in 2024.

    Water scarcity is a major demand driver for smart plantation systems. The World Bank states that agriculture accounts for about 70% of global freshwater withdrawals, while irrigated agriculture covers only 20% of cultivated land but produces 40% of global food. This imbalance strengthens the case for soil-moisture sensors, weather-linked irrigation, automated valves and remote water scheduling, where water must be managed across large areas.

    Input efficiency is another important growth factor. The International Fertilizer Association estimated global fertilizer consumption at about 205 million tonnes of nutrients in the 2025/26 fertilizer year, including roughly 116 million tonnes of nitrogen, 48 million tonnes of phosphate and 41 million tonnes of potash. With such large input volumes, variable-rate nutrient application, crop mapping and sensor-based recommendations can improve application accuracy, control input costs and reduce losses to soil and water.

    Key Takeaways

    • Smart Plantation Management Systems Market size is expected to be worth around USD 2.8 Billion by 2035, from USD 1.6 Billion in 2025, growing at a CAGR of 5.7%.
    • Irrigation systems held a dominant market position, capturing more than a 53.00% share.
    • Hardware held a dominant market position, capturing more than a 58.20% share.
    • Sugarcane held a dominant market position, capturing more than a 22.00% share.
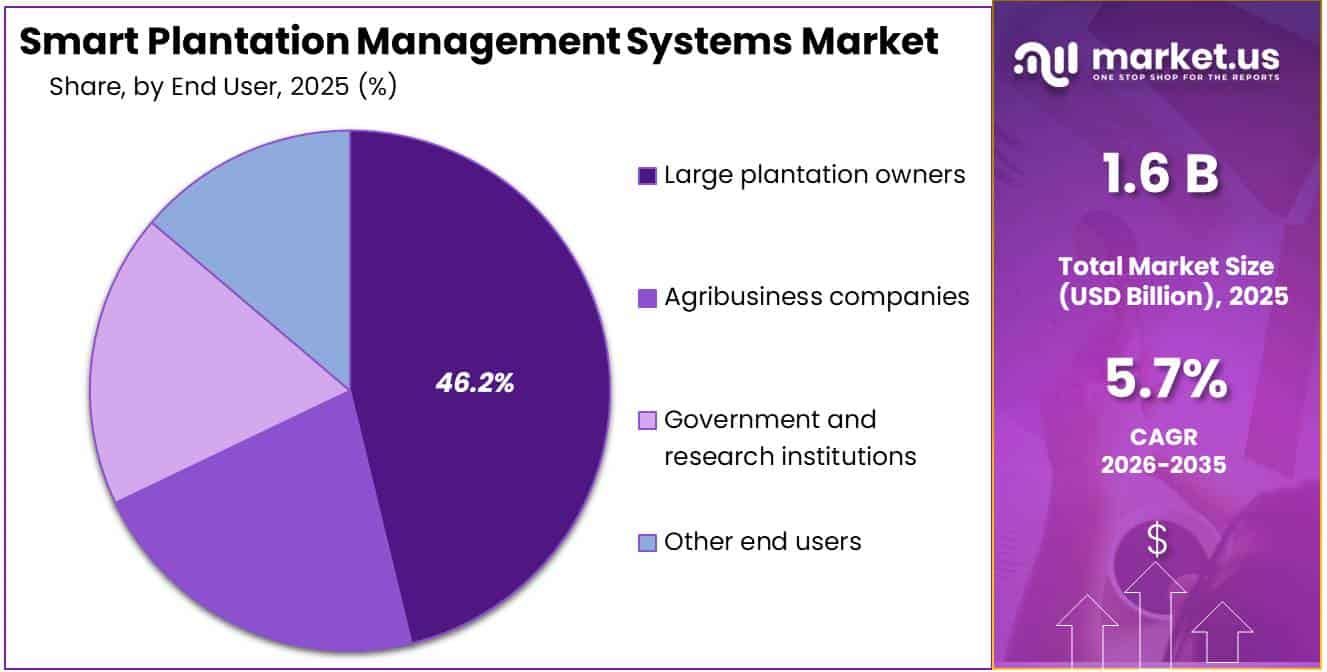
    • Large plantation owners held a dominant market position, capturing more than a 46.20% share.
    • Asia Pacific held the dominant position in the Smart Plantation Management Systems Market, capturing more than a 38.50% share and generating about USD 0.62 billion.

    By System Type Analysis

    Irrigation systems dominate with more than a 53.00% share, supported by rising use of pressurized and precision water management
    In 2025, “Irrigation systems” held a dominant market position, capturing more than a 53.00% share. Irrigation systems remained central to smart plantation management because growers need better control over water timing, volume, and field distribution. Smart controllers, soil-moisture sensors, weather stations, automated valves, and variable-rate systems allow plantations to adjust irrigation according to actual crop conditions instead of fixed schedules.
    A USDA Economic Research Service update published in December 2025 reported that pressurized irrigation systems accounted for 75% of irrigated acreage across the 17 Western U.S. states, compared with 69% previously. Pressurized systems include sprinkler and micro/drip technologies and generally reduce water losses compared with gravity irrigation. USDA also reported in 2025 that 68% of large irrigation organizations used direct metering to measure water deliveries, showing growing importance of accurate water measurement and control.
    Plant-growth monitoring systems remained an important segment of the Smart Plantation Management Systems Market in 2025. These systems use soil sensors, crop cameras, drones, satellite imagery, weather instruments, and farm software to track moisture, plant stress, nutrient conditions, pest risks, and crop development. They help plantation managers identify problems earlier and apply water, fertilizer, or crop protection products more precisely.

    By Component Analysis

    Hardware dominates with more than a 58.20% share, supported by wider use of connected field devices
    In 2025, “Hardware” held a dominant market position, capturing more than a 58.20% share. Hardware forms the physical base of smart plantation management, covering soil and moisture sensors, weather stations, GPS units, irrigation controllers, cameras, drones, gateways, and connected field equipment. These devices collect field information that growers use to control irrigation, monitor crops, and manage inputs more accurately.
    Government data shows that farms already have a strong base of connected equipment. In 2025, the U.S. Department of Agriculture reported that 85% of farms had internet access, 74% accessed the internet through cellular data plans, 82% used smartphones, and 68% used desktop or laptop computers. USDA also recorded precision-agriculture practices involving GPS systems, soil mapping, drones, variable-rate equipment, and electronic monitoring.
    Software remained an important component of the Smart Plantation Management Systems Market in 2025. Farm-management platforms, mobile applications, irrigation software, crop-monitoring dashboards, analytics tools, and cloud systems help plantation operators convert data from sensors, drones, machinery, and satellites into practical decisions. These platforms can support irrigation schedules, crop-health monitoring, input planning, equipment tracking, and production records from one interface.

    By Crop Type Analysis

    Sugarcane dominates the Smart Plantation Management Systems Market with more than a 22.00% share
    In 2025, “Sugarcane” held a dominant market position, capturing more than a 22.00% share. Sugarcane plantations require continuous management of irrigation, soil moisture, fertilizer application, harvesting schedules, and crop health across large growing areas. Smart irrigation controllers, satellite imagery, field sensors, GPS-enabled machinery, and farm-management platforms help producers monitor these activities more closely while improving water and input use.
    Government production data shows the scale of the crop. In April 2026, Brazil’s National Supply Company, Conab, estimated national sugarcane production at 673.2 million metric tons for the 2025/26 season. The same crop supported ethanol production of around 37.5 billion liters. USDA also forecast Brazilian sugarcane output at 671 million metric tons for 2025/26 and sugar production at 44.7 million metric tons. Managing production at this scale creates a strong operating case for automated irrigation, remote crop monitoring, machinery tracking, and data-based harvest planning.
    Coffee remained an important crop type in the Smart Plantation Management Systems Market in 2025. Coffee production is sensitive to rainfall, temperature, soil moisture, flowering conditions, pests, and nutrient management. Plantation operators increasingly use weather stations, soil sensors, satellite images, irrigation controls, and digital farm platforms to identify crop stress and make timely field-management decisions.

    By End User Analysis

    Large plantation owners lead with more than a 46.20% share, as operating scale supports greater investment in smart farming systems
    In 2025, “Large plantation owners” held a dominant market position, capturing more than a 46.20% share. Large plantation operators are well suited to smart management systems because extensive crop areas require continuous monitoring of irrigation, soil conditions, machinery, weather, crop health, and input application. Centralized software, sensors, GPS equipment, drones, and automated irrigation can help these operators manage large production areas with greater consistency.
    USDA data published in May 2026 showed that large-scale family farms represented only 5% of U.S. farms but generated 50% of total agricultural production value and operated 33% of agricultural land. In July 2026, USDA also reported that large-scale farms generated 58% of specialty-crop production value. This concentration of land and production supports investment in technologies that can be deployed across larger crop areas.
    Agribusiness companies remained an important end-user segment of the Smart Plantation Management Systems Market in 2025. These companies often manage farming operations, contracted production, processing networks, and agricultural supply chains at scale. Smart plantation platforms allow them to connect irrigation controls, field sensors, machinery data, satellite imagery, weather information, and crop records within a single operating system, improving visibility across multiple farms and production locations.
    Smart Plantation Management Systems Market Share

    Key Market Segments

    By System Type

    • Irrigation systems
    • Plant-growth monitoring systems
    • Harvesting systems
    • Other systems

    By Component

    • Hardware
    • Software
    • Services

    By Crop Type

    • Coffee
    • Tea
    • Cocoa
    • Sugarcane
    • Cotton
    • Oil palm
    • Other plantation crops

    By End User

    • Large plantation owners
    • Agribusiness companies
    • Government and research institutions
    • Other end users

    Driver Analysis

    Climate-Smart Irrigation
    Water scarcity is converting smart irrigation from a discretionary plantation digitization project into a production-continuity investment: agriculture accounts for about 72% of global freshwater withdrawals, 2024 global mean temperature reached 1.55°C ± 0.13°C above the 1850–1900 level, and damaging droughts since 2023 have intensified across major producing regions, increasing the value of continuous soil-moisture, evapotranspiration, pump-control, and microclimate data.
    The operating case is already measurable—reviewed IoT irrigation applications report 15–50% water savings, an in-field sensor trial applied 30% less water without sacrificing yield or quality, and FAO-supported demonstrations recorded 19% lower water use in mango, 24% savings in greenhouse cultivation, irrigation-efficiency improvement from 50% to above 92%, and a 40% reduction in grape water use.
    For perennial plantations, where a missed irrigation cycle can damage several harvest years rather than one annual crop, these economics support a shift from stand-alone sensors toward integrated subscription platforms combining probes, weather feeds, valve automation, pump-energy analytics, and exception alerts; assuming addressable irrigated estates move from basic monitoring to closed-loop control and vendors capture recurring software and service revenue, this driver contributes an estimated +2.4 percentage points to baseline CAGR, with strongest near-term conversion in water-stressed coffee, fruit, tea, oil-palm, and nut corridors across India, Southeast Asia, Latin America, Africa, and MENA.

    Drivers Impact Analysis

    Driver(~) % Impact on CAGR Forecast Geographic Relevance Impact Timeline
    Climate-smart irrigation +2.4 pp APAC, LatAm, Africa, MENA Short term (≤ 2 years)
    Labor-saving automation +1.9 pp Southeast Asia, LatAm, EU Medium term (2–4 years)
    Plot-level traceability +1.6 pp EU-linked cocoa, coffee, palm, rubber Short term (≤ 2 years)
    Low-cost crop intelligence +1.4 pp Global plantation belts Short term (≤ 2 years)
    Public digital infrastructure +1.1 pp India, EU, North America, APAC Medium term (2–4 years)
    Yield-risk monetization +0.9 pp Coffee, cocoa, tea corridors Short term (≤ 2 years)

    Restraint Analysis

    High Deployment Economics
    The FCC’s precision-agriculture task-force work indicates that a private-network model for a 50-member cooperative can require roughly $55,000 upfront per farm plus about $6,000 annually, while some technology additions can exceed $100,000; its earlier engineering estimate placed network staffing at $200,000–$250,000 plus benefits and equipment near $300,000, illustrating why coverage economics deteriorate rapidly outside dense production clusters.
    USDA evidence also shows a sharp scale effect: in 2023, autosteer was used by 52% of midsize crop farms and 70% of large-scale farms, whereas small family farms consistently recorded the lowest adoption across technology categories. For a plantation operator with volatile crop realizations, the modeled business case can therefore stretch from a target 24–36-month payback to 48–72 months once installation, agronomic customization, replacement batteries, software subscriptions, and field service are included; a 10%–15% overrun or one weak harvest can push net present value below investment thresholds.
    This directly suppresses conversion of pilots into estate-wide contracts, increases discounting and proof-of-value costs for vendors, shifts demand toward lower-ticket point solutions, and supports a modeled 2.4-percentage-point deduction from unconstrained CAGR until leasing, shared-service, outcome-based pricing, and blended public-private finance materially reduce the upfront burden.

    Restraint Impact Analysis

    Restraint(~) % Impact on CAGR Forecast Geographic Relevance Impact Timeline
    High deployment economics -2.4 pp APAC, Africa, Latin America Short term (≤ 2 years)
    Last-acre connectivity gaps -1.9 pp Africa, South Asia, Latin America Medium term (2–4 years)
    Fragmented plantation base -1.6 pp APAC, Africa, Latin America Long term (≥ 4 years)
    Interoperability and lock-in -1.2 pp Global; EU and North America core Medium term (2–4 years)
    Data and cyber exposure -0.9 pp EU, North America, export estates Medium term (2–4 years)
    Regulatory deployment burden -0.7 pp EU-linked supply chains, US, APAC Short term (≤ 2 years)

    Opportunity Analysis

    Compliance-as-a-Service
    This opportunity is not the existing demand for plantation monitoring; it is a new compliance monetization layer that converts plot polygons, title and supplier records, satellite change detection, chain-of-custody events, and risk scoring into audit-ready due-diligence outputs sold to exporters, processors, traders, lenders, and brands. The EU Deforestation Regulation applies from 30 December 2026 to large and medium operators and from 30 June 2027 to micro and small operators, while its scope includes coffee, cocoa, oil palm, rubber, cattle, soy, wood, and derived products—placing several core plantation value chains inside a time-bound geolocation and verification requirement.
    A vendor serving 100,000 farms at an analyst-modeled annual fee of $12–$30 per farm, plus $10,000–$50,000 enterprise integration contracts for 20–40 anchor buyers, could generate roughly $1.4 million–$5.0 million of recurring revenue from one commodity corridor without relying on sensor-hardware margins; automated risk triage and reusable supplier identity can reduce manual onboarding and audit-preparation effort by an estimated 30%–50%, lifting gross margin toward 65%–80% for the software layer versus approximately 20%–40% for field-heavy projects.
    The go-to-market pivot is to charge the legally accountable buyer rather than the cash-constrained grower, bundle evidence retention and due-diligence-statement workflows, and cross-sell remediation monitoring after initial mapping. Because this revenue pool is deadline-created, buyer-funded, and largely absent from traditional agronomy subscriptions, successful penetration of even 10%–15% of eligible export-oriented accounts supports a modeled +2.2-percentage-point CAGR upside, concentrated in EU-linked production corridors in Southeast Asia, West Africa, and Latin America.

    Opportunity Impact Analysis

    Opportunity(~) % Potential CAGR Upside Geographic Relevance Execution Window
    Compliance-as-a-Service +2.2 pp EU-linked coffee, cocoa, palm, rubber Short term (≤ 2 years)
    Embedded finance rails +1.8 pp Africa, South Asia, Southeast Asia, LatAm Medium term (2–4 years)
    Outcome-based irrigation +1.6 pp India, ASEAN, Africa, LatAm, MENA Short term (≤ 2 years)
    Carbon and nature MRV +1.3 pp EU, LatAm, Africa, APAC Medium term (2–4 years)
    Offline edge-AI stack +1.1 pp Africa, South Asia, ASEAN, LatAm Medium term (2–4 years)
    Post-harvest quality OS +0.9 pp Coffee, cocoa, tea, fruit corridors Medium term (2–4 years)

    Challenges Analysis

    Last-Mile Connectivity Gaps
    Smart plantation platforms can continue selling through offline-capable applications and periodic synchronization, but their highest-value use cases—real-time irrigation control, machine telemetry, drone-image upload, pest alerts, and remote diagnostics—remain structurally constrained by weak field-level networks: in 2024 only 48% of rural residents used the internet versus 83% of urban residents, 1.8 billion of the world’s 2.6 billion offline population lived in rural areas, and rural internet use in low-income countries was only 16%. Even where mobile broadband exists, the global usage gap covered 38% of the population, showing that affordability, devices, skills, and relevance remain as consequential as tower coverage.
    The operational threshold is also moving upward; a U.S. precision-agriculture task force recommended 100/100 Mbps connectivity and latency below 10 milliseconds across working lands, specifications that illustrate the gap between ordinary rural access and reliable autonomous operations. The modeled -1.7 percentage-point CAGR drag therefore reflects deferred conversion from basic monitoring subscriptions to higher-ARPU closed-loop automation, higher implementation costs for gateways and edge storage, and elongated commissioning cycles rather than a complete sales halt.
    Vendors must mitigate this through store-and-forward architecture, LoRaWAN or private-network gateways, local inference, multi-SIM backhaul, service-level monitoring, and connectivity bundled into per-hectare contracts; these measures shift cost from the grower’s uncertain telecom budget into the provider’s managed-service stack but require at least one hardware refresh and multiple rural network-investment cycles to normalize.

    Challenges Impact Analysis

    Challenge(~) % CAGR Friction Drag Geographic Relevance Mitigation Horizon
    Last-Mile Connectivity Gaps -1.7% Africa, South Asia, LATAM interiors Long term (≥ 4 years)
    Fragmented Data Ecosystems -1.4% Global; EU core Medium term (2–4 years)
    Localized Model Accuracy -1.2% Tropical APAC, Africa, LATAM Long term (≥ 4 years)
    Field Hardware Reliability -1.0% Humid tropics, remote estates Medium term (2–4 years)
    Digital Agronomy Skills Gap -0.9% Emerging APAC, Africa, LATAM Long term (≥ 4 years)
    Cybersecurity and Data Trust -0.8% North America, EU, export estates Medium term (2–4 years)

    Geopolitical Impact Analysis

    Ongoing Wars Raise Costs and Speed Up Digital Farming
    The Russia–Ukraine war and continuing conflict around the Middle East are affecting the Smart Plantation Management Systems market through higher fuel, fertilizer, freight, and electronic-component costs. Plantation operators using sensors, drones, automated irrigation, GPS equipment, and connected machinery face higher operating expenses when energy and shipping routes are disrupted.
    In September 2026, the U.S. Energy Information Administration reported that Brent crude averaged USD 91 per barrel in August, USD 7 higher than July, while Middle East crude-oil production shut-ins reached about 6.7 million barrels per day. Higher diesel and transport costs can delay technology upgrades, especially for farms operating large machinery fleets.
    Fertilizer supply risk is another concern. UNCTAD reported in March 2026 that around one-third of global seaborne fertilizer trade, about 16 million tonnes, normally passes through the Strait of Hormuz. Disruptions there can raise fertilizer and logistics costs, encouraging plantations to use precision nutrient application and crop-monitoring tools more carefully.

    Regional Insights

    Asia Pacific Leads the Smart Plantation Management Systems Market with 38.50% Share and USD 0.62 Billion
    In 2025, Asia Pacific held the dominant position in the Smart Plantation Management Systems Market, capturing more than a 38.50% share and generating about USD 0.62 billion. The region benefits from large plantation activity, increasing use of irrigation automation, mobile connectivity, satellite monitoring, and digital farm tools.
    ITU reported that 77% of the Asia-Pacific population used the internet in 2025, while 5G coverage reached 70.4%. Better connectivity supports remote sensors, irrigation controllers, drones, and cloud-based plantation platforms. FAO also placed Asia-Pacific smart farming innovation at the center of its July 2026 Global Conference on Smart Farming, highlighting efforts to scale practical digital agriculture solutions across the region.
    North America represents a faster-growing regional opportunity because commercial farms are increasingly using connected and precision technologies. USDA reported in August 2025 that 22% of U.S. farms used precision-agriculture practices, including GPS guidance, soil mapping, variable-rate input application, yield monitoring, and drones. Around 85% of farms had internet access, while 74% used cellular data plans.
    Smart Plantation Management Systems Market Regional Analysis

    Key Regions and Countries Insights

    • North America
      • US
      • Canada
    • Europe
      • Germany
      • France
      • The UK
      • Spain
      • Italy
      • Rest of Europe
    • Asia Pacific
      • China
      • Japan
      • South Korea
      • India
      • Australia
      • Rest of APAC
    • Latin America
      • Brazil
      • Mexico
      • Rest of Latin America
    • Middle East & Africa
      • GCC
      • South Africa
      • Rest of MEA

    Key Players Analysis

    Deere & Company holds a strong position in smart agriculture through precision guidance, telematics, automation, data platforms, and connected farm machinery. In fiscal 2025, Deere generated USD 45.684 billion in net sales and revenues. Its Production & Precision Agriculture segment recorded USD 17.311 billion in sales, USD 2.671 billion in operating profit, and a 15.4% operating margin. The segment supports large-scale growers, including sugarcane producers, with automated equipment and data-driven farm-management technologies.
    Netafim, Orbia’s Precision Agriculture business, is a major provider of drip irrigation, fertigation, digital farming, and automated water-management solutions. In 2025, the company completed 60 years of operation and served agricultural customers across 110 countries. During the first quarter of 2026, Orbia’s Precision Agriculture business generated USD 290 million in sales, up 7%, while EBITDA reached USD 34 million, increasing 2%. Its GrowSphere platform further supports irrigation scheduling and nutrient-management decisions.
    Robert Bosch GmbH participates in smart plantation management through sensors, connectivity, automation, AI, and precision crop-protection technologies. Bosch generated approximately EUR 91.0 billion in sales in 2025 and employed about 413,000 people worldwide. Its 50:50 smart-farming joint venture with BASF operates under the ONE SMART SPRAY brand, combining Bosch cameras and software with agronomic intelligence. Field trials have demonstrated herbicide-volume savings of up to 70%, supporting more precise input application and digitally managed crop production.

    Top Key Players Outlook

    • Deere & Company
    • Netafim
    • Robert Bosch GmbH
    • Trimble Inc.
    • AGCO Corporation
    • DTN
    • SemiosBio Technologies
    • Phytech
    • Rivulis
    • Jain Irrigation Systems
    • WaterBit
    • Tevatronic
    • AquaSpy
    • Synelixis Solutions
    • AgroWebLab

    Recent Developments

    • July 2026, when AGCO reported that 320 dealers were equipped to sell PTx solutions, while the PTx Elite network had reached 85 dealers and more than 90% of the target market had access to a PTx dealer.
    • May 2025, when PTx added more than 50 Fendt and Massey Ferguson dealerships across the U.S. and Canada; by year-end, the wider PTx network had surpassed 70 PTx Elite dealers, more than doubling its global footprint, while the portfolio introduced 14 new products during 2025.

    Report Scope

    Report Features Description
    Market Value (2025) USD 1.6 Bn
    Forecast Revenue (2035) USD 2.8 Bn
    CAGR (2026-2035) 5.7%
    Base Year for Estimation 2025
    Historic Period 2020-2024
    Forecast Period 2026-2035
    Report Coverage Revenue Forecast, Market Dynamics, Competitive Landscape, Recent Developments
    Segments Covered By System Type (Irrigation systems, Plant-growth monitoring systems, Harvesting systems, Other systems), By Component (Hardware, Software, Services), By Crop Type (Coffee, Tea, Cocoa, Sugarcane, Cotton, Oil palm, Other plantation crops), By End User (Large plantation owners, Agribusiness companies, Government and research institutions, Other end users)
    Regional Analysis North America – US, Canada; Europe – Germany, France, The UK, Spain, Italy, Rest of Europe; Asia Pacific – China, Japan, South Korea, India, Australia, Singapore, Rest of APAC; Latin America – Brazil, Mexico, Rest of Latin America; Middle East & Africa – GCC, South Africa, Rest of MEA
    Competitive Landscape Deere & Company, Netafim, Robert Bosch GmbH, Trimble Inc., AGCO Corporation, DTN, SemiosBio Technologies, Phytech, Rivulis, Jain Irrigation Systems, WaterBit, Tevatronic, AquaSpy, Synelixis Solutions, AgroWebLab
    Customization Scope Customization for segments, region/country-level will be provided. Moreover, additional customization can be done based on the requirements.
    Purchase Options We have three licenses to opt for: Single User License, Multi-User License (Up to 5 Users), Corporate Use License (Unlimited User and Printable PDF)
    keyboard_arrow_up
  • Segments Sub-segments
    By System Type
    • Irrigation systems
    • Plant-growth monitoring systems
    • Harvesting systems
    • Other systems
    By Component
    • Hardware
    • Software
    • Services
    By Crop Type
    • Coffee
    • Tea
    • Cocoa
    • Sugarcane
    • Cotton
    • Oil palm
    • Other plantation crops
    By End User
    • Large plantation owners
    • Agribusiness companies
    • Government and research institutions
    • Other end users
     
    North America Europe Asia Pacific Latin America Middle East & Africa
    • US
    • Canada
    • Germany
    • France
    • The UK
    • Spain
    • Italy
    • Rest of Europe
    • China
    • Japan
    • South Korea
    • India
    • Australia
    • Rest of APAC
    • Brazil
    • Mexico
    • Rest of Latin America
    • GCC
    • South Africa
    • Rest of MEA
Smart Plantation Management Systems Market
Published date: Sep 2026
add_shopping_cartBuy Now get_appDownload Sample

Related Reports

  • Cocoa and Chocolate Market
  • Sustainable Agriculture Market
  • Liqueurs Market
  • Micro Irrigation Systems Market
  • Sugar-free Ice Cream Market
  • Date Palm Market
  • Raspberry Ketones Market
  • Nut Products Market
  • Prebiotic Ingredients Market
  • Botanical Ingredient Market
Smart Plantation Management Systems Market
  • 193661
  • Sep 2026
    • ★★★★★
      ★★★★★
Buy Now
Trusted by more than 17382 organizations globally
  • Client Logo
  • Client Logo
  • Client Logo
  • Client Logo
  • Client Logo
  • Client Logo
  • Client Logo
  • Client Logo
  • Client Logo
  • Client Logo
  • Client Logo
  • Client Logo
  • Client Logo
  • Client Logo
  • Client Logo
  • Client Logo

Our Clients

philips
pentair
suez
ecowater
ergobaby
fabricato
genomatica
lenzing
lilly
siemens
honeywell
valspar
pactiv
petsure
schweitzer-online
sappi
pfizer
unilabs
lonza
BD
mckinsey
hilti
✖
Request a Sample Report
We'll get back to you as quickly as possible
CAPTCHA Code

✖
Request a Sample Report
We'll get back to you as quickly as possible
CAPTCHA Code

  • location_on420 Lexington Avenue, Suite 300 New York City, NY 10170,
    United States
  • phone+1 718 874 1545 (International)
  • phone+91 78878 22626 (Asia)
  • email[email protected]
  • Facebook Logo
  • Twitter Logo
  • LinkedIn Logo
Find Help
  • Contact Us
  • How to Order
Legal
  • Privacy Policy
  • Refund Policy
  • Frequently Asked Questions
  • Terms and Conditions
Explore
  • About Us
  • Our Clients
  • Media Mentions
  • Infographics
  • Statistics and Facts
  • Research Methodology
  • Why Choose Us?
Secured Payment Options

© 2026 Market.Us. All Rights Reserved.