


Report Overview
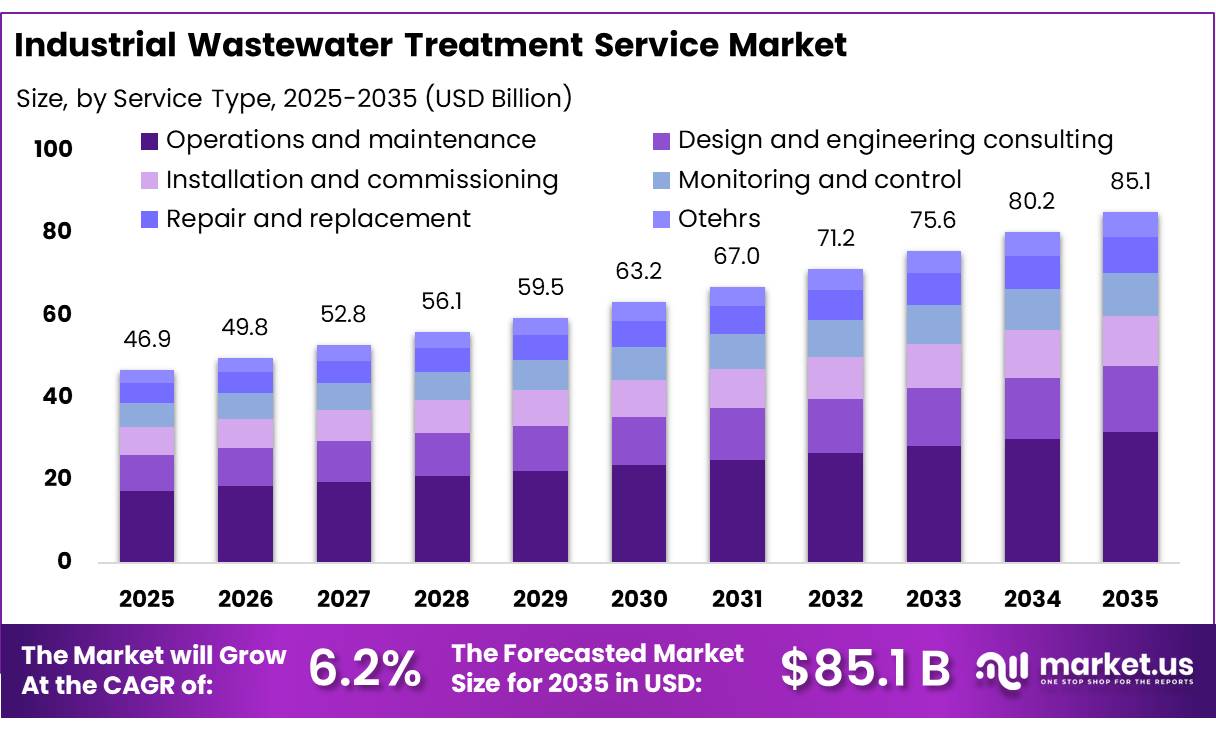
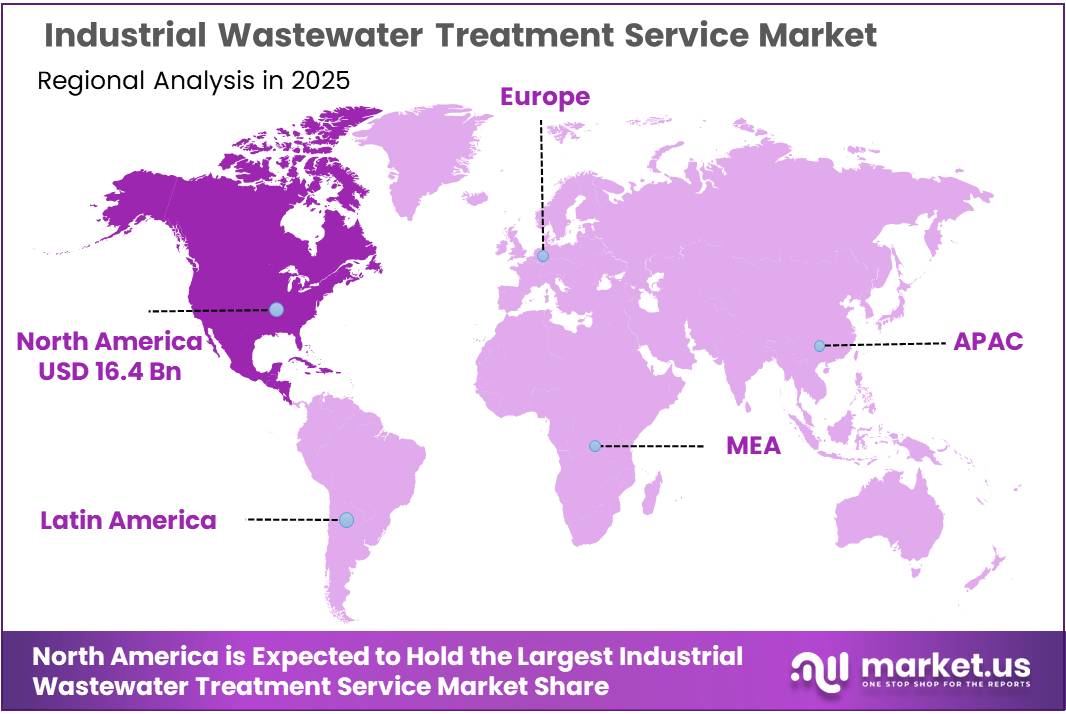
The Global Industrial Wastewater Treatment Service Market size is expected to be worth around USD 85.1 Billion by 2035, from USD 46.9 Billion in 2025, growing at a CAGR of 6.2% during the forecast period from 2026 to 2035. In 2025, North America held a dominant market position, capturing more than a 35.00% share, holding USD 16.4 Billion revenue.
Industrial wastewater treatment services cover the collection, treatment, recycling, monitoring, and management of wastewater generated by manufacturing and processing facilities. These services help industries remove suspended solids, oils, toxic chemicals, heavy metals, and organic pollutants before wastewater is discharged or reused. Major end-use industries include chemicals and petrochemicals, pharmaceuticals, food and beverages, textiles, oil and gas, mining, and pulp and paper.
- According to the United Nations’ 2024 wastewater treatment progress report, data from 22 countries showed that only 38% of industrial wastewater was treated in 2022, while just 27% was safely treated. These findings indicate that industrial wastewater management remains an important environmental challenge. However, the figures represent reporting countries rather than the entire world, as industrial wastewater data remain limited.
Environmental regulations are a major driver of demand for specialized treatment services. In the United States, the Environmental Protection Agency (EPA) has established effluent guidelines for 59 industrial categories. These requirements cover approximately 40,000 facilities that discharge wastewater directly into water bodies and 129,000 facilities that discharge into municipal treatment plants. Such standards encourage manufacturers to maintain effective treatment systems, conduct regular water-quality testing, and use suitable technologies to control industrial pollutants.
Water scarcity and rising demand for efficient resource use are creating further opportunities for wastewater treatment service providers. The World Bank’s 2025 report on scaling water reuse indicates that potable and industrial water reuse could increase eightfold by 2040, reaching 430 million cubic meters per day and potentially unlocking up to US$340 billion in investment. This outlook supports opportunities in filtration, reverse osmosis, membrane bioreactors, biological treatment, and zero-liquid-discharge systems.
Key Takeaways
- Industrial Wastewater Treatment Service Market size is expected to be worth around USD 85.1 Billion by 2035, from USD 46.9 Billion in 2025, growing at a CAGR of 6.2%.
- Operations and maintenance held a dominant market position, capturing more than a 37.00% share.
- Biological treatment held a dominant market position, capturing more than a 27.00% share.
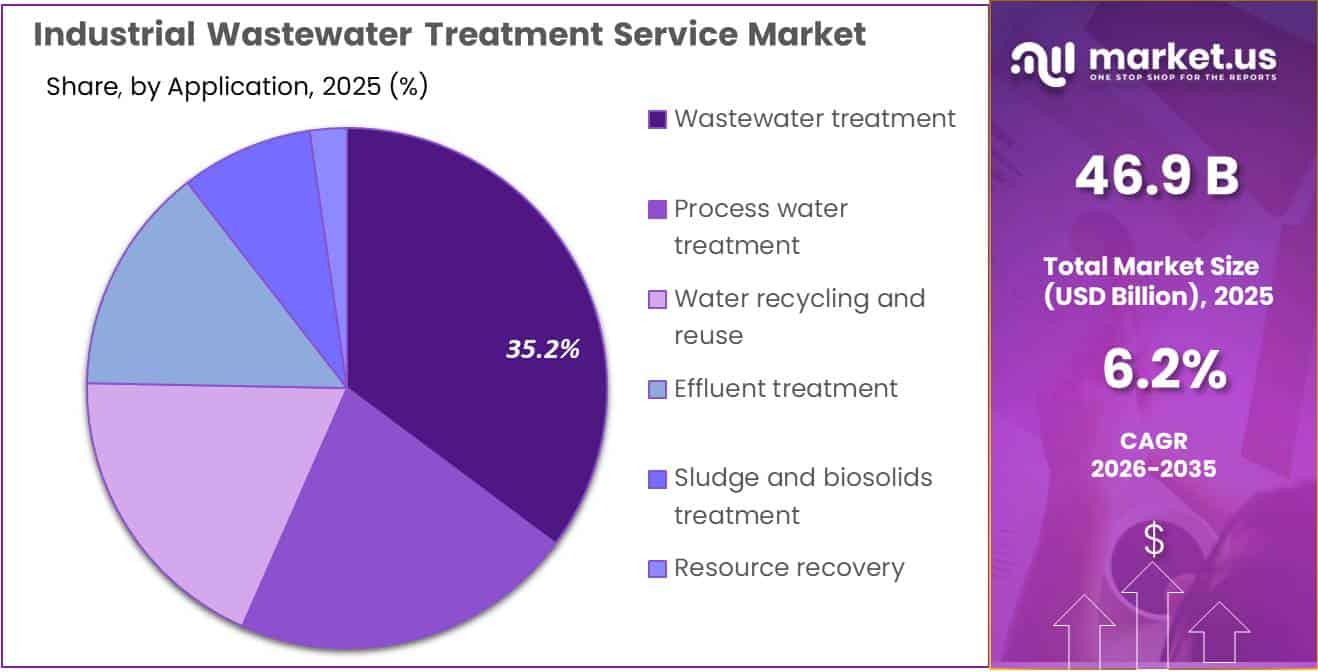
- Wastewater treatment held a dominant market position, capturing more than a 35.00% share.
- Chemicals and petrochemicals held a dominant market position, capturing more than a 20.00% share.
- North America held a dominant position in the Industrial Wastewater Treatment Service Market in 2025, accounting for 35.00% of the market, valued at USD 16.4 billion.
By Service Type Analysis
Operations and Maintenance Segment Dominates the Industrial Wastewater Treatment Service Market with a 37.00% Share in 2025
In 2025, “Operations and maintenance” held a dominant market position, capturing more than a 37.00% share of the Industrial Wastewater Treatment Service Market. The segment benefits from the ongoing need to keep treatment plants operating efficiently, maintain equipment, monitor water quality, and meet environmental discharge requirements. Industrial facilities require regular servicing of pumps, filters, membranes, chemical dosing systems, and sludge-handling equipment to reduce downtime and maintain consistent treatment performance.
The United States Environmental Protection Agency provides industrial effluent guidelines covering 59 industrial categories, demonstrating the broad regulatory requirements that support the need for reliable wastewater treatment operations and maintenance services.
Design and engineering consulting services support industries in selecting suitable treatment technologies, planning plant capacity, improving process efficiency, and meeting wastewater discharge requirements. In 2025, demand for these services was supported by the need to upgrade existing treatment facilities, manage complex industrial effluents, and develop water recycling systems.
Engineering consultants help industrial operators evaluate wastewater characteristics and select appropriate physical, chemical, and biological treatment processes. The United States Environmental Protection Agency’s industrial effluent guidelines cover 59 industrial categories, highlighting the range of industrial processes for which wastewater treatment systems may require specialized design and compliance planning.
By Treatment Method Analysis
Biological Treatment Dominates the Industrial Wastewater Treatment Service Market with a 27.00% Share in 2025
In 2025, “Biological treatment” held a dominant market position, capturing more than a 27.00% share of the Industrial Wastewater Treatment Service Market. This segment is supported by its ability to remove biodegradable organic pollutants from industrial wastewater through the use of microorganisms. Industries such as food processing, pharmaceuticals, chemicals, and pulp and paper use biological processes to reduce organic loads before wastewater is discharged or reused.
Treatment methods such as activated sludge, anaerobic digestion, and biological filtration help improve water quality and support efficient wastewater management. The United States Environmental Protection Agency provides technical information on biological wastewater treatment and secondary treatment requirements, highlighting the role of biological processes in reducing organic pollutants.
Physical treatment is an important method in industrial wastewater management because it removes suspended solids, oil, grease, and other materials through processes such as screening, sedimentation, flotation, and filtration. In 2025, industries used physical treatment as a preliminary or primary step to reduce the pollutant load before applying chemical or biological processes.
This method helps protect downstream equipment, improve treatment efficiency, and support compliance with wastewater discharge requirements. The United States Environmental Protection Agency identifies conventional primary treatment processes, including screening and sedimentation, as important stages in wastewater treatment. These processes support the effective removal of solid materials before further treatment.
By Application Analysis
Wastewater Treatment Dominates the Industrial Wastewater Treatment Service Market with a 35.00% Share in 2025
In 2025, “Wastewater treatment” held a dominant market position, capturing more than a 35.00% share of the Industrial Wastewater Treatment Service Market. The segment is supported by the need to remove pollutants from industrial effluents before discharge or reuse. Manufacturing facilities across the chemical, pharmaceutical, food processing, textile, and metal industries require reliable treatment services to manage suspended solids, organic pollutants, oils, and chemical residues. Regular treatment and monitoring also help industrial operators comply with environmental regulations and reduce the risk of water pollution.
The United States Environmental Protection Agency establishes effluent guidelines for 59 industrial categories, highlighting the importance of managing wastewater across a broad range of industrial activities. These requirements support demand for treatment plant operation, maintenance, testing, and process improvement services.
Process water treatment focuses on improving water quality for use in industrial manufacturing, equipment cleaning, cooling, and other production activities. In 2025, demand for these services was supported by the need to maintain consistent water quality, protect machinery, reduce scaling and corrosion, and improve water-use efficiency. Treatment providers help industries select suitable filtration, softening, membrane treatment, and chemical conditioning processes according to production requirements.
The United States Geological Survey reported that approximately 34 billion gallons of water per day were withdrawn for industrial uses in the United States in 2015, demonstrating the importance of water management across industrial operations. Efficient process water treatment can help facilities manage water demand and increase opportunities for reuse.
By End-Use Industry Analysis
Chemicals and Petrochemicals Lead the Industrial Wastewater Treatment Service Market with a 20.00% Share in 2025
In 2025, “Chemicals and petrochemicals” held a dominant market position, capturing more than a 20.00% share of the Industrial Wastewater Treatment Service Market. This segment is supported by the need to manage wastewater containing solvents, oils, acids, organic compounds, and other chemical residues generated during manufacturing. Chemical and petrochemical facilities require specialized treatment services to maintain water quality, meet discharge standards, and reduce environmental risks.
Treatment providers support these industries through chemical dosing, biological treatment, filtration, process monitoring, and regular maintenance of wastewater treatment plants. The United States Environmental Protection Agency establishes wastewater discharge guidelines for the organic chemicals, plastics, and synthetic fibers manufacturing sector, highlighting the importance of controlling industrial pollutants. These regulatory requirements support demand for reliable treatment services and continuous compliance monitoring.
The oil and gas segment requires wastewater treatment services to manage produced water, refinery wastewater, oily residues, and water contaminated during extraction and processing. In 2025, demand for these services was supported by the need to separate oil and suspended solids, manage chemical contaminants, and prepare water for safe disposal or reuse.
Treatment providers use technologies such as oil-water separation, filtration, chemical treatment, and membrane systems according to the characteristics of the wastewater. The United States Environmental Protection Agency regulates wastewater discharges from petroleum refining under its effluent guidelines, which establish requirements for controlling pollutants from refinery operations. These regulations encourage operators to maintain effective treatment systems and improve wastewater management practices.
Key Market Segments
By Service Type
- Design and engineering consulting
- Installation and commissioning
- Operations and maintenance
- Monitoring and control
- Repair and replacement
- Otehrs
By Treatment Method
- Physical treatment
- Chemical treatment
- Biological treatment
- Membrane treatment
- Others
By Application
- Process water treatment
- Wastewater treatment
- Water recycling and reuse
- Effluent treatment
- Sludge and biosolids treatment
- Resource recovery
By End-Use Industry
- Chemicals and petrochemicals
- Oil and gas
- Power generation
- Food and beverages
- Pharmaceuticals
- Pulp and paper
- Textiles
- Others
Driver Analysis
PFAS and Toxic Effluent Control
The U.S. EPA’s Effluent Guidelines Program Plan 16, issued in January 2025, initiated detailed PFAS studies for centralized waste treatment and PFAS processors, continued nationwide influent data collection at publicly owned treatment works, and extended evaluation of textile, pulp-and-paper, airport, and other industrial discharges; EPA effluent guidelines are technology-based standards governing releases to surface waters and municipal sewer systems.
This regulatory direction expands service revenue beyond conventional biological treatment into source characterization, composite sampling, activated carbon, ion exchange, membrane concentration, foam fractionation, sludge stabilization, off-site destruction coordination, and compliance reporting; a facility generating 50–500 m3/day of difficult wastewater can shift from periodic testing into multi-year service programs that combine monitoring, mobile treatment, consumables replacement, and residuals handling. Value capture increasingly favors operators with mobile assets, certified laboratories, destruction-partner networks, and indemnity capacity, because the customer is purchasing risk transfer and permit defensibility rather than only cubic metres treated.
The driver is strongest in North America, with EU and Asian chemicals, textiles, electronics, and landfill networks following through tighter contaminant monitoring; the 2026–2031 model assigns +1.7 percentage points of CAGR impact because each new contaminant requirement generates recurring sampling, treatment, media-replacement, and waste-disposal revenue rather than a one-time equipment sale.
Drivers Impact Analysis
| Driver | (~) % Impact on CAGR | Geographic Relevance | Impact Timeline |
|---|---|---|---|
| PFAS and toxic effluent control | +1.7 pp | North America core, EU, APAC | Short term (≤ 2 years) |
| Industrial water reuse | +1.6 pp | MENA, China, India, US Southwest, EU | Medium term (2–4 years) |
| EU micropollutant compliance | +1.3 pp | EU core, UK spill-over | Medium term (2–4 years) |
| Outsourced O&M contracts | +1.1 pp | North America, EU, India, Southeast Asia | Short term (≤ 2 years) |
| Digital treatment optimization | +1.0 pp | North America, EU, China, Gulf states | Medium term (2–4 years) |
| Industrial decarbonization | +0.8 pp | EU, North America, China, MENA | Long term (≥ 4 years) |
Restraint Analysis
High Reuse-Project Capex
The World Bank estimates that scaling potable and industrial reuse could require up to USD 340 billion of investment by 2040, even though industrial and potable reuse currently represents only about 53 million m3/day, or approximately 3% of municipal-sector freshwater withdrawals; this low penetration reflects not only technical immaturity but also long payback expectations, weak offtake contracts, and limited project-finance standardization.
A mid-sized industrial reuse project can require USD 1 million–10 million of installed capital depending on flow, contaminant load, discharge target, and conveyance infrastructure, while membrane replacement, chemical cleaning, sludge disposal, electricity, and operator staffing introduce ongoing costs before the customer realizes its water-security benefit.
This suppresses adoption among small and mid-sized factories, especially in textile, food, tanning, metal finishing, and chemical clusters, where balance sheets are insufficient for 7–12-year paybacks and lenders discount uncertain water-price escalation. Service providers can mitigate the problem through build-own-operate models, pooled industrial-park plants, equipment leasing, take-or-pay water offtake agreements, green loans, and blended finance, but each structure adds legal, credit, and performance-guarantee cost. The restraint is therefore modeled to deduct 1.2 percentage points from CAGR in India, MENA, Africa, and Southeast Asia until standardized, aggregated reuse programs reduce both capex intensity and financing risk.
Restraint Impact Analysis
| Restraint | (~) % Impact on CAGR | Geographic Relevance | Impact Timeline |
|---|---|---|---|
| High reuse-project capex | -1.2 pp | India, MENA, Africa, Southeast Asia | Medium term (2–4 years) |
| Low freshwater tariffs | -1.0 pp | India, China, MENA, Southeast Asia | Long term (≥ 4 years) |
| PFAS residual-disposal cost | -0.9 pp | North America core, EU, Japan | Short term (≤ 2 years) |
| Fragmented permitting regimes | -0.8 pp | United States, EU, India, LatAm | Medium term (2–4 years) |
| Energy-intensive treatment | -0.7 pp | EU, Asia, MENA, North America | Short term (≤ 2 years) |
| Unbankable industrial contracts | -0.5 pp | Emerging APAC, Africa, LatAm | Medium term (2–4 years) |
Opportunity Analysis
Reuse-as-a-Service Platforms
Global potable and industrial reuse is still only about 53 million m3/day, equal to approximately 3% of municipal-sector freshwater withdrawals, while the World Bank estimates that supportive policy, financing, and project standardization could expand capacity eightfold to 430 million m3/day by 2040, requiring USD 170–340 billion of investment and roughly 14% annual capacity growth.
A provider that bundles modular MBR, ultrafiltration, reverse osmosis, polishing, network storage, and remote O&M can shift revenue from one-off EPC margins to indexed recurring tariffs of roughly USD 0.40–1.50/m3, with annual escalation linked to electricity, membrane, chemical, and inflation indices; a 10,000 m3/day industrial-park plant operating at 85% utilization can create more than 3 million m3 of billable annual service volume before adding sludge, cooling-water, and compliance-monitoring fees.
This is future upside rather than baseline growth because it requires credit underwriting, balance-sheet or infrastructure-fund capital, standardized contracts, industrial offtake aggregation, and performance-guarantee capability that many conventional treatment vendors do not possess. The strongest opportunity is in India, MENA, China, and Southeast Asia, where water stress and industrial-cluster density are high; if providers convert even 10–15% of addressable reuse projects from capex sales to recurring platform contracts, the model indicates +1.7 percentage points of CAGR upside above baseline.
Opportunity Impact Analysis
| Opportunity | (~) % Potential CAGR Upside | Geographic Relevance | Execution Window |
|---|---|---|---|
| Reuse-as-a-Service platforms | +1.7 pp | India, MENA, China, Southeast Asia | Medium term (2–4 years) |
| PFAS residuals lifecycle services | +1.4 pp | North America core, EU, Japan | Short term (≤ 2 years) |
| Semiconductor and AI water hubs | +1.3 pp | U.S., Taiwan, South Korea, Japan, EU | Medium term (2–4 years) |
| Industrial-park utility roll-ups | +1.1 pp | India, China, Vietnam, Indonesia, Mexico | Medium term (2–4 years) |
| Digital outcome-based O&M | +0.9 pp | North America, EU, Gulf states, China | Short term (≤ 2 years) |
| Micropollutant EPR platforms | +0.8 pp | EU core, UK spill-over | Long term (≥ 4 years) |
Challenges Analysis
Variable Influent Complexity
Industrial wastewater service performance is constrained by continuous variation in flow, pH, COD, BOD, salinity, temperature, oil and grease, metals, solvents, fluorides, nutrients, surfactants, and emerging contaminants, because a treatment train sized for nominal conditions can be destabilized by batch discharges, production changeovers, cleaning-in-place cycles, and unreported chemical substitutions.
A 500 m3/day system with average COD of 2,000 mg/L must manage roughly 1 tonne/day of organic load, but a temporary increase to 5,000 mg/L raises that loading to 2.5 tonnes/day without any increase in hydraulic flow; this can overload biological reactors, increase coagulant or carbon demand, create membrane fouling, and raise sludge volume by 20–50% depending on the treatment sequence.
The business consequence is that fixed-price O&M contracts become vulnerable when customers change production without synchronized wastewater notifications, forcing emergency chemical purchases, tankering, bypass prevention, overtime, and temporary mobile treatment, while failed compliance excursions expose providers to penalty and reputational risk.
Mitigation requires segregated-stream design, online pH/COD/conductivity/TOC monitoring, 12–48-hour equalization capacity, enforceable influent-acceptance clauses, production-data integration, and modular treatment trains that can absorb load shocks; however, process heterogeneity remains intrinsic to manufacturing and restricts standardization across clients. This structural variability creates a modeled -0.8-percentage-point CAGR drag globally because it limits the proportion of sites that can be efficiently served through standardized remote or performance-guaranteed contracts.
Challenges Impact Analysis
| Challenge | (~) % CAGR Friction Drag | Geographic Relevance | Mitigation Horizon |
|---|---|---|---|
| Variable Influent Complexity | -0.8 pp | Global industrial clusters | Long term (≥ 4 years) |
| Skilled Operator Shortage | -0.7 pp | North America, EU, APAC | Long term (≥ 4 years) |
| Legacy OT Cybersecurity | -0.6 pp | North America, EU, Gulf, APAC | Medium term (2–4 years) |
| Membrane Supply Volatility | -0.6 pp | Asia supply corridors, import markets | Medium term (2–4 years) |
| Energy-Process Optimization | -0.5 pp | EU, Asia, MENA, North America | Long term (≥ 4 years) |
| Sludge Liability Escalation | -0.5 pp | North America, EU, China, India | Medium term (2–4 years) |
Geopolitical Impact Analysis
Geopolitical Impact of Ongoing Wars on the Industrial Wastewater Treatment Service Market
Ongoing conflicts, particularly the Russia-Ukraine war and instability in the Middle East, are affecting industrial wastewater treatment services through higher energy costs, supply chain disruptions, and uncertainty in chemical procurement. Wastewater treatment plants depend on electricity, pumps, membranes, spare parts, and treatment chemicals such as coagulants and disinfectants. When shipping routes are disrupted or energy prices rise, service providers may face higher operating costs and delays in equipment delivery.
The scale of the disruption is reflected in the International Energy Agency’s 2026 reporting. Around 20% of global liquefied natural gas supply passed through the Strait of Hormuz in 2025, leaving energy-intensive industries exposed to interruptions in fuel and shipping supplies. The agency has also reported that the conflict disrupted oil, gas, and other commodity flows, increasing risks for industrial supply chains.
Despite these challenges, geopolitical uncertainty may encourage industrial facilities to invest in water recycling, efficient treatment technologies, and resilient service contracts. Such investments can reduce dependence on freshwater supplies and help maintain operations during supply disruptions. However, delayed capital spending and higher operating costs may slow some projects.
Regional Insights
Dominating Region: North America
North America held a dominant position in the Industrial Wastewater Treatment Service Market in 2025, accounting for 35.00% of the market, valued at USD 16.4 billion. The region benefits from established industrial infrastructure, environmental regulations, and demand for reliable wastewater treatment across chemical manufacturing, petroleum refining, food processing, and other industries. Industrial facilities require regular maintenance, pollutant monitoring, and treatment plant upgrades to meet discharge requirements.
The United States Environmental Protection Agency supports industrial water reuse through technical guidance for manufacturing, energy generation, mining, and other applications. Its resources encourage businesses to consider treated water as an alternative supply for suitable industrial processes. These factors support demand for outsourced operations, engineering services, and advanced treatment technologies.
Asia-Pacific presents strong growth opportunities as industrial production, urban development, and demand for water-efficient manufacturing increase across the region. Chemical processing, electronics, textiles, food manufacturing, and power generation require treatment solutions that can manage complex wastewater and support water recycling. Investment opportunities include biological treatment, membrane filtration, automated monitoring, and plant modernization.
The European Environment Agency reported that industrial water abstraction accounts for 14% of total annual water abstraction in the European Union, illustrating the importance of industrial water efficiency across developed economies. Its analysis also identifies potential water-saving opportunities of 30% to 50% in selected water-intensive industries through technological improvements and recycling.
Key Regions and Countries Insights
- North America
- US
- Canada
- Europe
- Germany
- France
- The UK
- Spain
- Italy
- Rest of Europe
- Asia Pacific
- China
- Japan
- South Korea
- India
- Australia
- Rest of APAC
- Latin America
- Brazil
- Mexico
- Rest of Latin America
- Middle East & Africa
- GCC
- South Africa
- Rest of MEA
Key Players Analysis
Veolia Environnement S.A. is a major provider of industrial water treatment, wastewater management, and environmental services. In 2025, the company generated €44.396 billion in revenue and €7.050 billion in earnings before interest, taxes, depreciation, and amortization. It employed approximately 215,000 people across 5 continents, supporting customers through water technologies, treatment services, and resource recovery solutions. Its water technology business reported €4.954 billion in revenue, reflecting its role in advanced treatment and industrial water management.
Xylem Inc. provides water technology equipment and services for wastewater collection, treatment, monitoring, and reuse. In 2025, the company recorded US$9.0 billion in revenue and employed approximately 22,000 people worldwide. Its solutions include wastewater treatment equipment, analytical instruments, digital monitoring systems, and service support for industrial and municipal customers. Xylem serves customers in approximately 150 countries, giving it a broad international presence.
SUEZ S.A. provides wastewater treatment, industrial water management, water recycling, and waste recovery services. In 2025, the company reported €9.5 billion in revenue and approximately 40,000 employees operating across 40 countries. It provided sanitation services to 36 million people and generated 8.7 terawatt-hours of energy from waste and wastewater. Its services include treatment plant design, construction, operation, and maintenance, along with specialized solutions for industrial customers.
Top Key Players Outlook
- Veolia Environnement S.A.
- Xylem Inc.
- SUEZ S.A.
- Ecolab Inc. / Nalco Water
- Kurita Water Industries Ltd.
- Solenis LLC
- Thermax Limited
- Pentair plc
- Aquatech International LLC
- VA Tech WABAG Ltd.
- WOG Technologies
- SWA Water Australia Pty Ltd.
- Ion Exchange (India) Ltd.
- Ovivo Inc.
- H2O Innovation Inc.
Recent Developments
- In September 2026, Solenis signed a strategic representation agreement with Moleaer to integrate nanobubble technology into its Novera Nanobubble Performance Program for wastewater treatment. The companies stated that the technology could reduce polymer consumption by 10% to 40% and increase sludge cake dryness by 2% to 4%, depending on operating conditions.
- Thermax’s Water and Waste Solutions business reported 30,000 installations, 500 million litres per day (MLD) of water treated, 130 MLD of water recycled, and 70 MLD of wastewater treated on its official website. The company also operates 16 manufacturing facilities, serves more than 90 countries, and reported consolidated revenue of ₹10,694 crore for fiscal year 2025–2026.
Report Scope
| Report Features | Description |
|---|---|
| Market Value (2025) | USD 46.9 Bn |
| Forecast Revenue (2035) | USD 85.1 Bn |
| CAGR (2026-2035) | 6.2% |
| Base Year for Estimation | 2025 |
| Historic Period | 2020-2024 |
| Forecast Period | 2026-2035 |
| Report Coverage | Revenue Forecast, Market Dynamics, Competitive Landscape, Recent Developments |
| Segments Covered | By Service Type (Design and engineering consulting, Installation and commissioning, Operations and maintenance, Monitoring and control, Repair and replacement, Otehrs), By Treatment Method (Physical treatment, Chemical treatment, Biological treatment, Membrane treatment, Others), By Application (Process water treatment, Wastewater treatment, Water recycling and reuse, Effluent treatment, Sludge and biosolids treatment, Resource recovery), By End-Use Industry (Chemicals and petrochemicals, Oil and gas, Power generation, Food and beverages, Pharmaceuticals, Pulp and paper, Textiles, Others) |
| Regional Analysis | North America – US, Canada; Europe – Germany, France, The UK, Spain, Italy, Rest of Europe; Asia Pacific – China, Japan, South Korea, India, Australia, Singapore, Rest of APAC; Latin America – Brazil, Mexico, Rest of Latin America; Middle East & Africa – GCC, South Africa, Rest of MEA |
| Competitive Landscape | Veolia Environnement S.A., Xylem Inc., SUEZ S.A., Ecolab Inc. / Nalco Water, Kurita Water Industries Ltd., Solenis LLC, Thermax Limited, Pentair plc, Aquatech International LLC, VA Tech WABAG Ltd., WOG Technologies, SWA Water Australia Pty Ltd., Ion Exchange (India) Ltd., Ovivo Inc., H2O Innovation Inc. |
| Customization Scope | Customization for segments, region/country-level will be provided. Moreover, additional customization can be done based on the requirements. |
| Purchase Options | We have three licenses to opt for: Single User License, Multi-User License (Up to 5 Users), Corporate Use License (Unlimited User and Printable PDF) |





































