


Report Overview
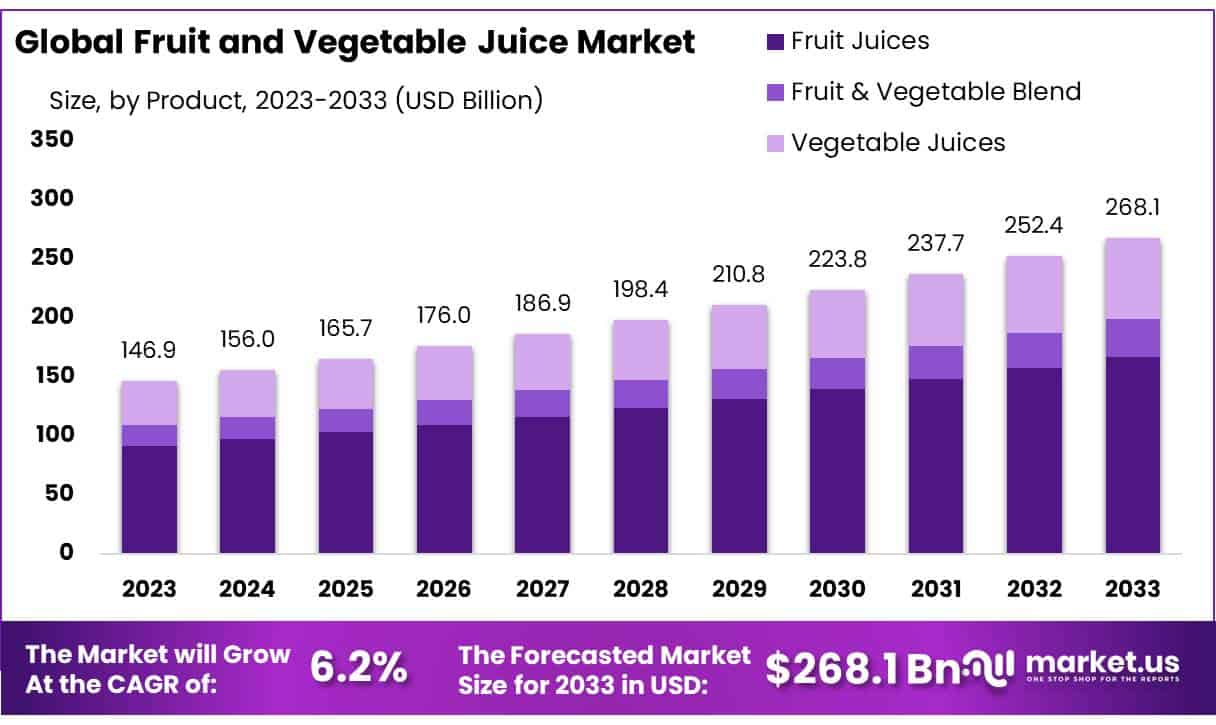
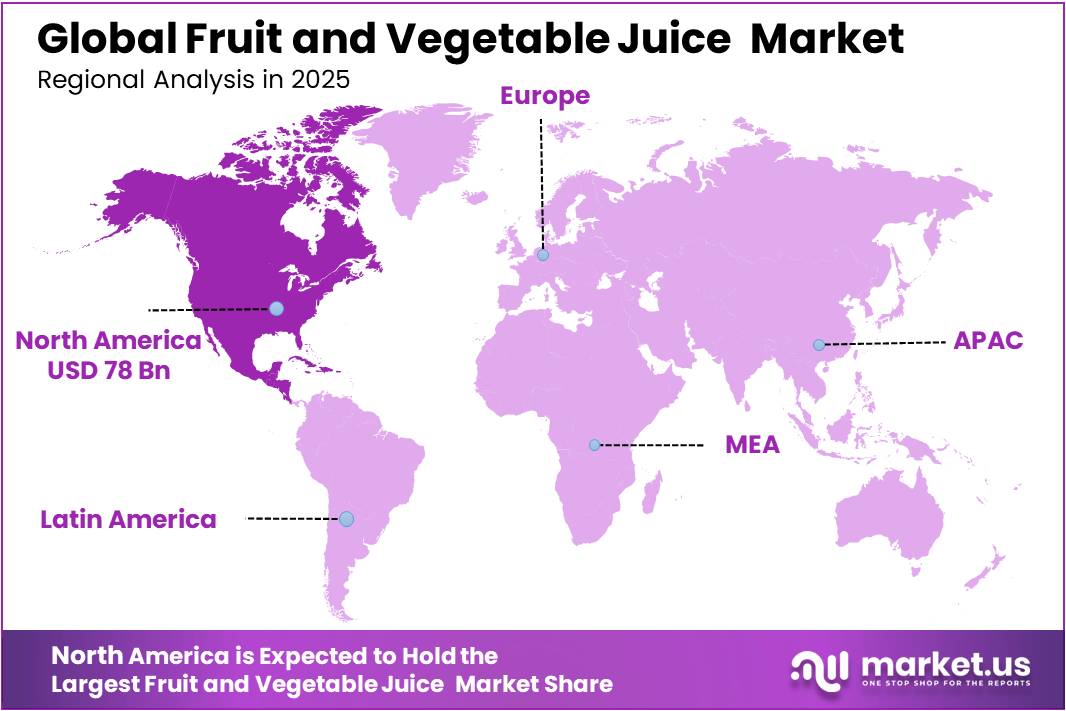
In 2025, the Global Fruit and Vegetable Juice Market was valued at US$213.7 billion, and between 2026 and 2035, this market is estimated to register a CAGR of 5.7%, reaching about US$391.8 billion by 2035. North America held a dominant market position, capturing more than a 36.5% share, holding USD 78 billion in revenue.
The global fruit and vegetable juice market is a dynamic segment of the larger functional and non-alcoholic beverage industry, driven by increased consumer demand for healthier, nutrient-dense, and more convenient drink options. Rising health awareness, increased adoption of natural and organic beverages, and shifting consumption habits toward functional nutrition and immunity-boosting goods all have a significant impact on market demand.
- In 2023, The European Fruit Juice Association recorded EU consumption of fruit juice and fruit nectar at approximately 9.1 billion litres, underscoring Europe’s standing as one of the largest and most established juice markets globally.
Key Takeaways
- The Global fruit and vegetable juice market was valued at USD 213.7 billion in 2025.
- The Global market is projected to grow at a CAGR of 5.7% and is estimated to reach USD 391.8 billion by 2035.
- On the basis of type, fruit juice dominated the market, constituting 42.4% of the total market share.
- Based on nature, conventional products dominated the fruit and vegetable juice market, with a substantial market share of around 72.3%.
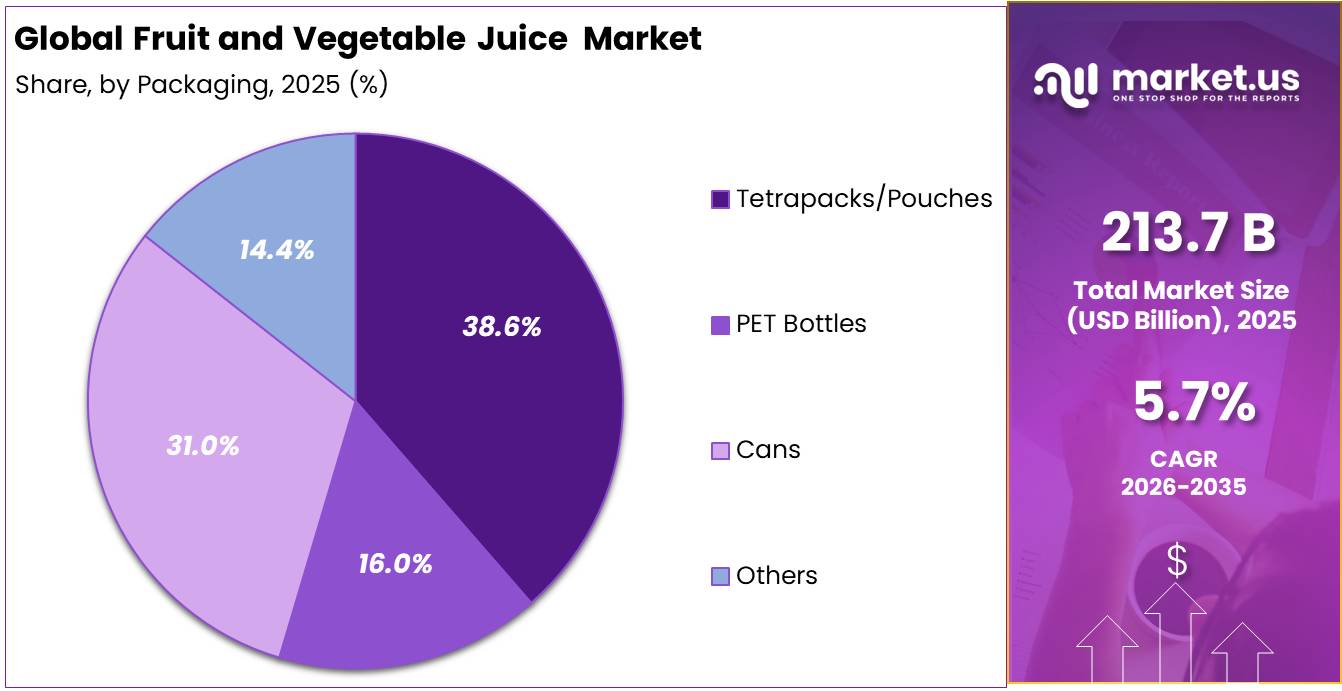
- Among packaging types, tetrapacks and pouches led the market, comprising 38.6% of the total market.
- Among the distribution channels, convenience stores held a major share in the fruit and vegetable juice market, accounting for 48.2% of the market share.
- In 2025, North America was the most dominant region in the fruit and vegetable juice market, accounting for 36.5% of the total market.
Production and consumption remain highly concentrated in Asia Pacific, supported by large population bases, rising disposable incomes, rapid urbanization, and strong demand for packaged beverages in countries such as China and India. North America and Europe are other important markets, driven by premium organic juice demand, clean-label trends, and a growing taste for cold-pressed and preservative-free beverages. The market is seeing ongoing innovation in packaging types such as PET bottles, cans, and sustainable tetrapacks/pouches to improve product convenience, shelf life, and environmental sustainability.
- In January 2026, the USDA Foreign Agricultural Service forecast global orange juice production at 1.4 million tonnes for 2025/26, an increase of less than 1% from the previous season. Worldwide consumption was projected to rise by 4% to 1.2 million tonnes, while exports were expected to increase by 35,000 tonnes to 1.3 million tonnes. Global ending inventories were forecast to remain stable at 250,000 tonnes, indicating a relatively tight supply position despite recovering production.
Manufacturers are increasingly focusing on organic formulations, reduced-sugar products, fortified juices, and functional ingredient integration to align with evolving consumer preferences. Simultaneously, the rapid expansion of supermarkets, convenience retail, and online distribution channels is improving product accessibility and strengthening long-term growth opportunities for the global fruit and vegetable juice market.
Fruit and Vegetable Juice Market Segmentation
By Type Analysis
Fruit Juice dominates with 42.4% due to its familiar taste and wide availability
In 2025, Fruit Juice held a dominant market position, capturing more than a 42.4% share. In December 2025, the segment remained strong because consumers continued to choose orange, apple, mango, grape, and mixed-fruit juices for breakfast, refreshment, and on-the-go consumption. Its wide availability across supermarkets, convenience stores, cafés, hotels, and online platforms supported steady sales. Fruit juice also benefited from familiar taste profiles, attractive packaging, and growing demand for products with no added sugar, natural ingredients, and added vitamins.
Vegetable Juice continued to gain attention in 2025 as health-focused consumers looked for low-sugar and nutrient-rich drink options. Products made from tomato, carrot, beetroot, celery, and mixed vegetables supported this growth. Demand also improved through fitness channels, wellness stores, and ready-to-drink formats.
By Nature Analysis
Conventional dominates with 72.3% due to its affordability and wide retail availability
In 2025, Conventional held a dominant market position, capturing more than a 72.3% share. By December 2025, the segment maintained its leadership because conventionally produced fruit and vegetable juices were widely available across supermarkets, convenience stores, foodservice outlets, and online channels. These products remained more affordable than organic alternatives, making them suitable for regular household consumption. Established supply networks, large-scale fruit processing, longer shelf life, and broad flavour choices also supported demand.
Organic emerged as the fastest-growing segment in 2025 as consumers showed greater interest in clean-label beverages made without synthetic pesticides or artificial ingredients. Rising awareness of sustainable farming, natural nutrition, and ingredient transparency encouraged brands to expand certified organic juice ranges across premium retail and health-focused stores.
By Packaging Analysis
Tetrapacks/Pouches dominate with 55.4% due to their convenience, lightweight design, and longer shelf life
In 2025, Tetrapacks/Pouches held a dominant market position, capturing more than a 55.4% share. By December 2025, the segment maintained its leading position because this packaging format offered easy storage, safe transportation, and strong protection against light, air, and moisture. Tetrapacks and pouches were widely used for single-serve and family-sized fruit and vegetable juices. Their lightweight structure reduced handling and distribution requirements compared with heavier packaging formats.
Cans continued to show steady growth in 2025 due to their durability, recyclability, and suitability for chilled ready-to-drink juices. Their compact shape supported vending-machine sales, outdoor consumption, and convenient storage. Beverage producers also used cans to introduce premium juice blends and modern packaging designs.
By Distribution Analysis
Convenience Stores dominate with 48.2% due to easy access and strong demand for ready-to-drink juices
In 2025, Convenience Stores held a dominant market position, capturing more than a 48.2% share. By December 2025, the segment remained strong because consumers preferred quick access to chilled fruit and vegetable juices during travel, work breaks, and daily shopping. Convenience stores offered single-serve bottles, cartons, pouches, and cans in easily visible refrigerated sections. Their extended operating hours, large store networks, and presence near residential areas, offices, fuel stations, and transport hubs supported regular sales.
Supermarkets/Hypermarkets continued to grow in 2025 as shoppers gained access to wider product ranges, family-sized packs, organic options, and promotional discounts. Dedicated beverage aisles and bulk purchasing choices further supported demand through this channel.
Key Market Segments
By Type
- Fruit Juice
- Vegetable Juice
- Fruit & Vegetable Blends
By Nature
- Organic
- Conventional
By Packaging
- PET Bottles
- Cans
- Tetrapacks/Pouches
- Others
By Distribution Channel
- Supermarkets/Hypermarkets
- Convenience Stores
- Online Retail
Drivers
Citrus supply normalization lifts juice throughput
The clearest 2026 volume-side demand driver is the recovery in orange availability for processors after prior supply pressure. USDA projects 2025/26 global orange juice production at 1.351 million metric tons (65 degrees brix), up from 1.340 million in 2024/25, while Brazil alone rises to 1.032 million tons from 1.013 million; global exports increase to 1.273 million tons from 1.238 million, and global consumption rebounds to 1.168 million tons from 1.124 million.
That sequence matters strategically because juice economics are highly conversion-sensitive: when orange deliveries to processors improve, fixed-cost absorption at extraction, evaporation, aseptic filling, and cold-chain distribution improves materially, which supports promotional activity and private-label restocking without the same degree of margin compression. USDA also reports that oranges delivered to processors are forecast up 3 percent to 17.1 million tons in 2025/26, showing that more raw fruit is being directed into industrial transformation rather than only the fresh market. In practice, this lifts near-term category growth most visibly in orange-led portfolios, concentrate, NFC blends, and breakfast-channel formats tied to Brazil-linked supply.
Drivers Impact Analysis
| Driver | (~) % Impact on CAGR | Geographic Relevance | Impact Timeline |
|---|---|---|---|
| Citrus supply normalization lifts juice throughput | +1.1% | Brazil core, North America, EU, China import corridor | Short term (≤ 2 years) |
| Import dependence increases refill demand in deficit markets | +0.8% | U.S., EU, UK, Canada, China | Short term (≤ 2 years) |
| Processing shift absorbs more fruit into industrial juice streams | +0.9% | Brazil, Egypt, Mexico, EU | Medium term (2-4 years) |
| Food safety and HACCP compliance favor scaled processors | +0.7% | North America core, export-oriented LATAM, EU suppliers | Medium term (2-4 years) |
| Sugar scrutiny accelerates premium 100% juice and reformulation | +0.6% | EU, North America, developed APAC | Medium term (2-4 years) |
| Cross-border trade resilience expands packaged juice availability | +0.5% | Brazil export base, EU, U.S., South Africa, UK | Long term (≥ 4 years) |
Restraints
Sugar taxes and health policies
Escalating health policy pressure on sugar is a direct demand‑side restraint, particularly for juice categories perceived as high in “free sugars” despite their natural origin, and several national and global initiatives up to 2026 concretely tighten the policy environment. WHO guidance urges countries to keep free sugars below 10 percent of total energy intake, with a further reduction to below 5 percent roughly 25 grams per day recommended for additional health benefits; this framing fuels national taxes and school policies that explicitly target sugary drinks, including fruit and vegetable juice products above stipulated sugar thresholds.
In Malaysia, for example, the excise duty on sugar‑sweetened beverages, including fruit juices exceeding 12 grams of sugar per 100 millilitres, was introduced at 0.40 Malaysian ringgit per litre in 2019 and then raised to 0.50 ringgit in Budget 2024 and 0.90 ringgit per litre in Budget 2025, while broader campaigns such as “Jom Kosong” and school beverage rules aim to normalize low‑sugar or sugar‑free beverages by 2026.
Restraint Impact Analysis
| Restraint | (~) % Impact on CAGR | Geographic Relevance | Impact Timeline |
|---|---|---|---|
| Climate volatility and yield risk | -1.2% | Brazil, Mediterranean EU, LATAM, North Africa | Medium term (2-4 years) |
| Structural citrus production constraints | -0.9% | U.S., Mexico, Brazil export corridors | Long term (≥ 4 years) |
| Sugar taxes and health policies | -0.8% | ASEAN, EU, Middle East, APAC corridors | Medium term (2-4 years) |
| Stricter EU “Breakfast” juice rules | -0.7% | EU core, UK spill-over, export suppliers | Medium term (2-4 years) |
| Margin pressure from input and energy costs | -0.6% | Global industrial processors, especially EU | Short term (≤ 2 years) |
| Regulatory and compliance friction (HACCP, labeling) | -0.5% | North America core, EU, export-oriented LATAM | Long term (≥ 4 years) |
Opportunity
Energy- and water-efficient plants
Another long‑term upside lies in aggressively upgrading juice plants to high‑efficiency, low‑emissions operations, going beyond the incremental energy improvements implicitly assumed in current forecasts. Process innovations cited by packaging and processing majors show that redesigned juice production concepts can cut steam consumption by around 65 percent and significantly reduce water usage relative to legacy lines, implying potential operating cost reductions in the mid‑teens as a percentage of total conversion cost per litre for energy‑intensive processes.
Given the exposure of citrus belts and processing hubs in Brazil, the Mediterranean, and MENA to high and volatile energy prices, the ability to shave even 0.02–0.04 US dollars per litre from processing and chilling costs can add several percentage points to plant‑level EBITDA margins, particularly for private‑label contracts where pricing headroom is constrained.
Over a 5–10 year horizon, systematically rolling out high‑efficiency plants across top 10 exporting origins could expand sector‑wide profitability enough to fund more aggressive innovation and market expansion, effectively contributing 0.5–0.6 percentage points of growth on top of baseline expectations by enabling competitive pricing without margin sacrifice.
Opportunity Impact Analysis
| Opportunity | (~) % Potential CAGR | Geographic Relevance | Execution Window |
|---|---|---|---|
| Reduced-sugar EU juice category scaling | +1.0% | EU core, UK, EEA exporters | Short term (≤ 2 years) |
| Functional & super-fruit juice adjacency | +1.2% | North America, EU, APAC urban | Medium term (2-4 years) |
| Capex-light co-packing & SaaS processing | +0.7% | LATAM, APAC emerging, Africa | Medium term (2-4 years) |
| Energy- and water-efficient plants | +0.6% | Brazil export hubs, EU, MENA | Long term (≥ 4 years) |
| Cross-category functional beverage plays | +0.9% | Global multinationals, top 20 markets | Long term (≥ 4 years) |
| Data-driven personalization & D2C juice | +0.5% | North America core, EU, affluent APAC | Medium term (2-4 years) |
Challenge
Packaging cost volatility
Packaging cost volatility is a continuous challenge because fruit and vegetable juice relies heavily on materials such as PET, glass, cartons, and paperboard, whose prices are being driven more by global raw‑material and energy markets than by beverage demand itself. Analysis of packaging markets in April 2026 shows that paper packaging producers in Europe faced pulp price increases in early 2026 and waste‑paper prices rising by 15–30 percent in a single month depending on grade, while weak end‑user demand did little to offset these cost pressures.
Similar dynamics play out in PET and glass, where energy‑linked spikes in feedstock or furnace costs can add 5–10 percent to container prices over short periods, out of sync with juice volume trends. For juice manufacturers, where packaging can account for 25–40 percent of ex‑factory cost depending on format, such volatility complicates pricing, contract negotiations, and margin management; a 10 percent packaging price increase can translate into 2–4 percent higher total cost of goods sold if not offset elsewhere.
To navigate this friction, firms must adopt hedging strategies, multi‑sourcing, lightweighting, recycled‑content integration, and closer collaboration with converters, but these responses often require redesign cycles of 12–24 months and capital investment in new filling and handling equipment, meaning the sector faces a medium‑term horizon before cost volatility can be structurally dampened.
Challenges Impact Analysis
| Challenge | (~) % CAGR Friction | Geographic Relevance | Mitigation Horizon |
|---|---|---|---|
| Perishable inbound logistics risk | -0.8% | Brazil, Mediterranean EU, LATAM, APAC corridors | Medium term (2-4 years) |
| Persistent labour and skills gaps | -0.7% | North America core, EU plants, developed APAC | Long term (≥ 4 years) |
| Packaging cost volatility | -0.6% | EU, UK, North America, export hubs | Medium term (2-4 years) |
| Network complexity in global logistics | -0.5% | EU regulatory hubs, APAC logistics corridors | Long term (≥ 4 years) |
| Compliance and audit workload | -0.4% | North America core, EU, export-oriented LATAM | Long term (≥ 4 years) |
| Retail channel and mix management | -0.4% | Global modern trade, e-commerce nodes | Medium term (2-4 years) |
Geopolitical Impact Analysis
Trade Disruptions and Supply Chain Vulnerabilities Redefining Resilience in the Global Juice Market.
Escalating geopolitical tensions, evolving trade policy frameworks, and global supply chain fragmentation have introduced considerable uncertainty across the fruit and vegetable juice industry. Tariff impositions on key raw materials including orange concentrate from Brazil, apple juice concentrate from China, and tropical fruit derivatives from Southeast Asia have directly elevated input costs for manufacturers operating across North America and Europe, compressing margins and disrupting established procurement strategies.
Simultaneously, ongoing geopolitical conflicts, regional instability, and the broader repercussions of the Russia-Ukraine conflict have materially increased logistics and transportation costs across international juice trade corridors. These compounding pressures are accelerating industry-wide efforts toward supply chain regionalization, nearshoring of production, and strategic raw material diversification as manufacturers seek to build operational resilience against an increasingly complex and unpredictable geopolitical environment.
- In April 2024, According to the World Trade Organization (WTO), global merchandise trade growth remained under pressure due to ongoing geopolitical tensions, supply chain disruptions, and rising trade restrictions, significantly affecting international food and beverage supply chains, including processed fruit and vegetable products.
Regional Analysis
North America Held the Largest Share of the Global Fruit and Vegetable Juice Market.
North America leads the global fruit and vegetable juice market, commanding a 36.50% share of total market revenue. The region’s dominance is underpinned by high per capita juice consumption, well-established retail infrastructure, and strong consumer preference for premium, organic, and functional beverage categories. The United States represents the largest national market within the region, driven by heightened health consciousness, widespread availability of cold-pressed and clean-label juice products, and robust distribution across supermarkets, convenience stores, and rapidly expanding e-commerce channels.
Europe, the second-largest market, is driven by strong consumer preference for premium, organic, and clean-label juice products across key hubs including Germany, France, and the United Kingdom. Asia Pacific stands as the fastest-growing region, fueled by rapid urbanization, rising disposable incomes, and expanding health awareness across China, India, and Southeast Asia. Latin America holds strategic importance as a major global producer of key raw materials including oranges, mangoes, and tropical fruits, particularly across Brazil and Mexico, though economic volatility continues to moderate regional expansion.
Key Regions and Countries Covered
- North America
- The US
- Canada
- Europe
- Germany
- France
- The UK
- Spain
- Italy
- Russia & CIS
- Rest of Europe
- APAC
- China
- Japan
- South Korea
- India
- ASEAN
- Rest of APAC
- Latin America
- Brazil
- Mexico
- Rest of Latin America
- Middle East & Africa
- GCC
- South Africa
- Rest of MEA
Key Players Analysis
The global fruit and vegetable juice market is highly competitive, with leading players such as PepsiCo, The Coca-Cola Company, Nestlé S.A., Keurig Dr Pepper, Dabur India Ltd., Ocean Spray Cranberries, Inc., Del Monte Foods, Inc., and Welch Foods Inc. competing alongside a growing number of regional and specialty juice manufacturers. Major companies continue to strengthen their market presence through strong brand portfolios, wide distribution networks, and continuous innovation in flavors, packaging, and healthier product offerings.
Market players such as The Coca-Cola Company, PepsiCo, Dabur India Ltd., Ocean Spray Cranberries, Inc., increasingly focusing on product quality, natural ingredients, functional benefits, and sustainable packaging to attract evolving consumer preferences. Strategies such as mergers and acquisitions, expansion into emerging markets, and the launch of organic, clean-label, and immunity-boosting juice products are becoming increasingly common across the industry.
Market Key Players
- The Coca‑Cola Company
- PepsiCo
- Fresh Del Monte
- Bolthouse Farms, Inc.
- Lakewood Organic Juices
- Welch’s
- Ocean Spray
- Keurig Dr Pepper Inc.
- The Kraft Heinz Company
- Dole Packaged Foods, LLC
Key Development
- In February 2026, PepsiCo introduced 2 Alvalle vegetable recipes—Vegetable Cream and Pumpkin Cream—made with 100% Spanish-sourced natural ingredients and packed in 600-millilitre recycled-plastic bottles. Investment & Expansion: The products were initially launched in Spain, with expansion planned across Portugal and Western Europe. In May 2025, PepsiCo completed the acquisition of poppi for USD 1.95 billion, including USD 300 million in expected tax benefits, resulting in a net purchase price of USD 1.65 billion.
- In March 2025, Fresh Del Monte purchased a majority stake in Uganda-based Avolio. Its processing system is being expanded to handle 140 metric tons of avocados per day, allowing fruit that cannot be sold fresh to be converted into avocado oil and other valuable ingredients. In March 2026, it also completed the USD 285 million acquisition of selected Del Monte Foods assets, including packaged vegetables, tomatoes and refrigerated fruit operations across 7 facilities in the United States, Mexico and Venezuela.
Report Scope
| Report Features | Description |
|---|---|
| Market Value (2025) | USD 213.7 Bn |
| Forecast Revenue (2035) | USD 391.8 Bn |
| CAGR (2026-2035) | 5.7% |
| Base Year for Estimation | 2025 |
| Historic Period | 2020-2024 |
| Forecast Period | 2026-2035 |
| Report Coverage | Revenue Forecast, Market Dynamics, Competitive Landscape, Recent Developments |
| Segments Covered | By Type (Fruit Juice, Vegetable Juice, Fruit & Vegetable Blends), By Nature (Organic and Conventional), By Packaging (PET Bottles, Cans, Tetrapacks/Pouches, and Others), By Distribution Channel (Supermarkets/Hypermarkets, Convenience Stores, Online Retail, and Others), By Region and Companies – Industry Segment Outlook, Market Assessment, Competition Scenario, Trends and Forecast 2025-2035. |
| Regional Analysis | North America – The US & Canada; Europe – Germany, France, The UK, Spain, Italy, Russia & CIS, Rest of Europe; APAC– China, Japan, South Korea, India, ASEAN & Rest of APAC; Latin America– Brazil, Mexico & Rest of Latin America; Middle East & Africa– GCC, South Africa, & Rest of MEA |
| Competitive Landscape | The Coca-Cola Company, PepsiCo, Fresh Del Monte Produce Inc., Bolthouse Farms, Inc., Lakewood Organic Juices, Welch’s, Ocean Spray, Keurig Dr Pepper Inc., The Kraft Heinz Company, Dole Packaged Foods, LLC, and other key players. |
| Customization Scope | Customization for segments, region/country-level will be provided. Moreover, additional customization can be done based on the requirements. |
| Purchase Options | We have three licenses to opt for: Single User License, Multi-User License (Up to 5 Users), Corporate Use License (Unlimited Users and Printable PDF) |





































