


Report Overview
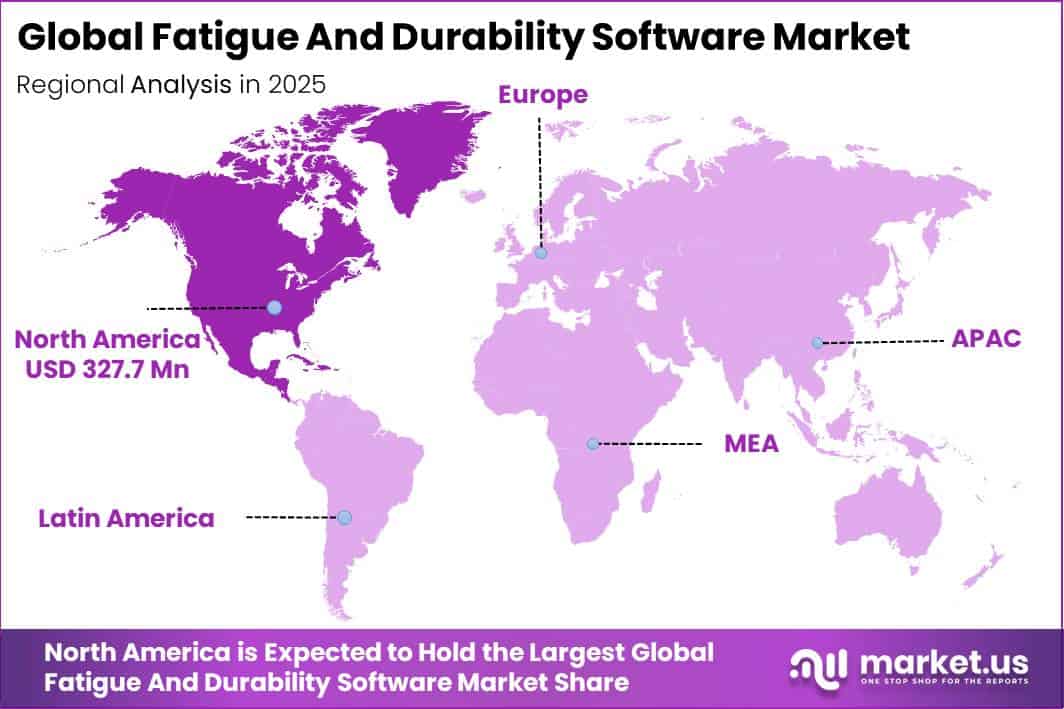
In 2025, the Global Fatigue and Durability Software Market was valued at USD 955.3 million. The market is projected to grow at a CAGR of 12.2% during 2026–2035, reaching approximately USD 3,020.3 million by 2035. North America dominated the global market in 2025, accounting for more than 34.5% of the total market share and generating approximately USD 327.7 million in revenue.
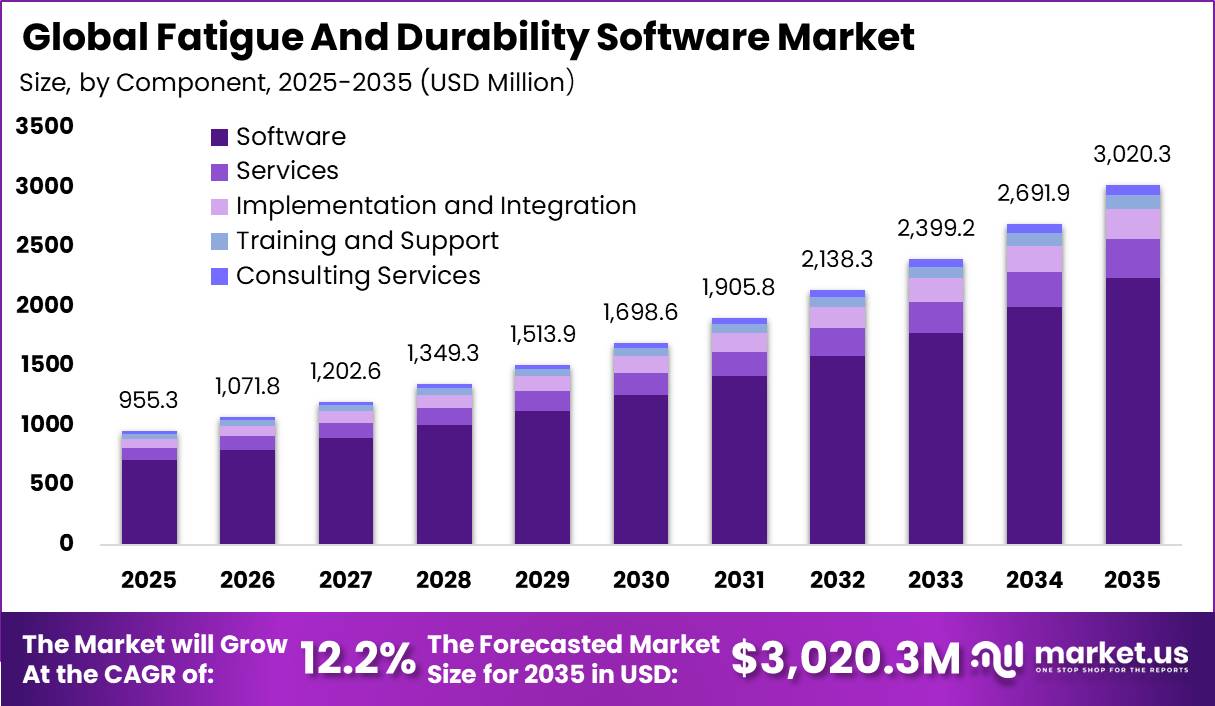
Market growth is strongly supported by increasing vehicle and aircraft production, as manufacturers use fatigue and durability software to study component life, stress, and structural performance before physical prototypes are built. Global vehicle production increased from 92.7 million units in 2024 to 96.4 million units in 2025, representing growth of 3.9%, while worldwide vehicle sales rose 4.7% to 99.8 million units.
This creates greater demand for durability testing of engines, chassis, battery packs, and other critical systems. Aerospace production is also supporting adoption. Airbus delivered 793 aircraft in 2025, an increase of 4%, while industry orders reached around 1,000 gross units. Aircraft components must withstand tens of thousands of flight cycles, making digital fatigue analysis increasingly important during product design.
Manufacturing value added represented 15.12% of global GDP in 2024, highlighting the large industrial customer base. Asia-Pacific also offers strong potential, with China producing 34.53 million vehicles in 2025, up 10.4% year-on-year, supporting wider adoption through 2035.
Key Takeaway
- The Fatigue and Durability Software Market was valued at USD 955.3 million in 2025 and is projected to reach USD 3,020.3 million by 2035 at a 12.2% CAGR.
- The Software segment was dominated by Component with a 74.3% share, driven by rising engineering employment and R&D spending.
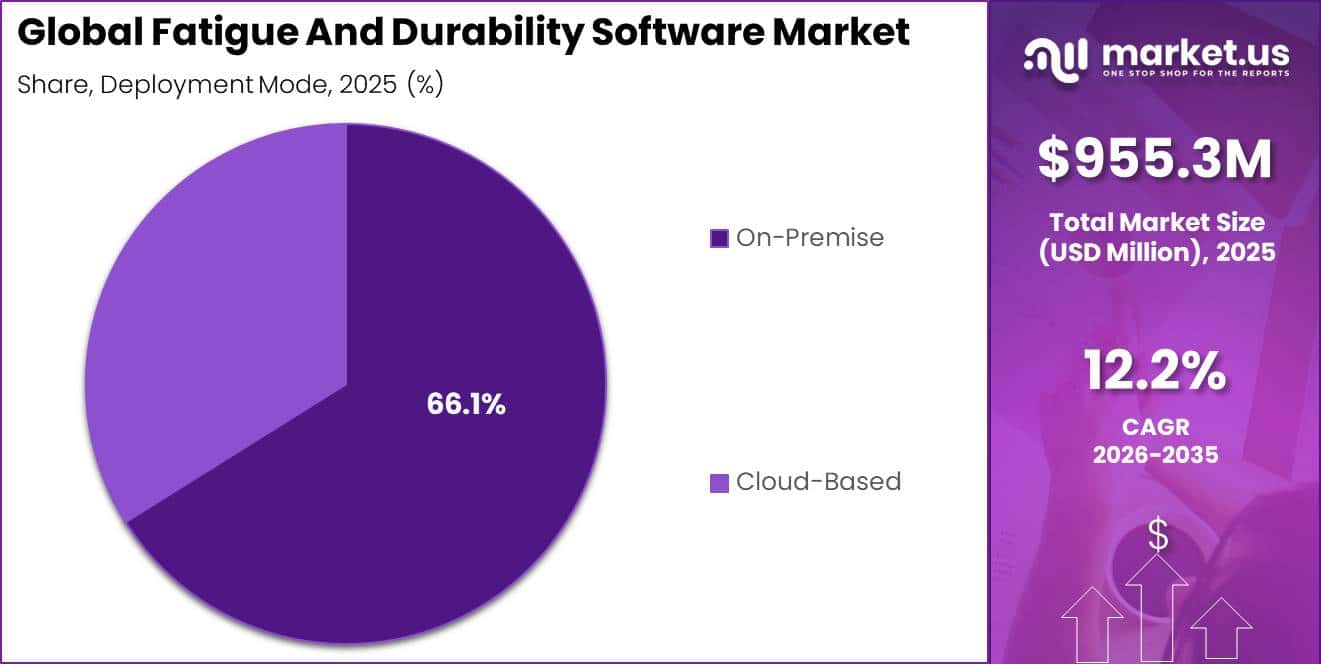
- On-Premise deployment held a 66.1% share due to strict data-security needs in aerospace and defense.
- Large Enterprises accounted for a 63.7% share, supported by stronger R&D budgets and testing infrastructure.
- Automotive and Transportation led End-User Industry demand with a 27.6% share, fueled by EV platform testing.
- North America led the market in 2025 with more than 34.5% share and USD 327.7 million in revenue.
Market Statistics and Data Insights
- Global electric-car sales exceeded 20 million units in 2025, rising 20% from 2024. Electric cars represented 25% of all new cars sold worldwide, meaning about 1 in every 4 new cars was electric.
- EV battery deployment reached 1.2 TWh in 2025, increasing almost 30% year-over-year and reaching more than 7 times its 2020 level. Light-duty vehicles represented more than 85% of EV battery deployment. These batteries introduce thermal, vibration, structural, and fatigue-validation requirements.
- Airbus’ widebody backlog reached a record 1,124 aircraft at the end of 2025. The company delivered 607 A320-family aircraft, 93 A220s, 36 A330s, and 57 A350s during the year, creating significant structural-analysis and fatigue-certification workloads.
- European military expenditure increased 14% in 2025 to USD 864 billion, while Asia and Oceania spending increased 8.1% to USD 681 billion. Higher defense spending supports aircraft, vehicle, naval, and structural engineering programs requiring lifecycle and fatigue analysis.
- Global military expenditure reached USD 2.887 trillion in 2025, increasing 2.9% in real terms and marking the 11th consecutive year of growth. Global military expenditure was also 41% higher than in 2016.
- Ansys employed approximately 2,500 product-development staff at the end of 2024, compared with 2,400 in 2023, illustrating the large specialized workforce required to maintain advanced engineering-simulation platforms.
- Global wind-power capacity additions reached a record 158.7 GW in 2025, while total wind capacity increased 14% from 2024. Large wind blades, towers, hubs, bearings, and drivetrains require repeated fatigue-life analysis.
- In June 2026, Synopsys reported that its first Multiphysics Fusion solutions could provide up to 3X faster multiphysics timing-analysis runtimes and up to 10X faster design closure. NVIDIA also reported that CUDA-X technology used in the workflow could provide up to 13X GPU acceleration for selected simulation workloads.
- NIST recorded 6,044 unique-user downloads of one AM Bench simulation dataset by July 2026. Across published AM Bench datasets, downloads averaged around 1,670 unique users per month, or approximately 55 per day, between May 2025 and May 2026. This provides direct evidence of active engineering-modeling usage.
By Component
The Software segment held a leading position in the Fatigue and Durability Software Market, accounting for a 74.3% share. Its dominance is supported by growing engineering employment and higher R&D investment, which are increasing the use of simulation and computer-aided engineering tools.
According to the U.S. Bureau of Labor Statistics, employment of mechanical engineers is expected to increase by 9.1% from 2024 to 2034, creating around 26,500 additional jobs.
This expanding engineering workforce increases the number of professionals using fatigue, stress, and durability simulation software during product development. Global R&D expenditure reached approximately USD 3.48 trillion in 2024, while transportation equipment manufacturing represented around 10% of U.S. business R&D spending.
By Deployment Mode
The On-Premise segment held a dominant position in the Fatigue and Durability Software Market, accounting for a 66.1% share. Its leadership is mainly supported by strict data-security requirements across aerospace, defense, and other sensitive engineering industries.
Global military expenditure reached a record USD 2,887 billion in 2025, increasing by 2.9%, while the U.S. alone spent around USD 954 billion. These large defense budgets support programs that generate sensitive structural, engineering, and fatigue-testing data.
By Organization Size
The Large Enterprises segment held a dominant position in the Fatigue and Durability Software Market, accounting for a 63.7% share. Fortune Global 500 companies generated a record USD 43.1 trillion in combined revenue in 2025, increasing by 3.2%, while their total profits reached around USD 3.4 trillion.
These strong financial resources allow large organizations to invest in advanced engineering software, simulation platforms, and long-term licensing contracts. According to the OECD, companies with 500 or more employees account for more than 70% of business R&D expenditure (BERD) across countries such as Japan, Germany, the U.S., Korea, and Sweden.
By End-User Industry
The Automotive and Transportation segment held a dominant position in the Fatigue and Durability Software Market, accounting for a 27.6% share. Its leadership is mainly supported by the rapid shift toward electric vehicles and the growing need for advanced durability testing across newly designed vehicle platforms and components.
According to the International Energy Agency, global electric car sales exceeded 20 million units in 2025, rising by 20% year-on-year and representing around 1 in 4 cars sold worldwide. EV battery deployment also reached about 1.2 TWh, increasing by nearly 30% from 2024.
Key Market Segments
By Component
- Software
- Services
- Implementation and Integration
- Training and Support
- Consulting Services
By Deployment Mode
- On-Premise
- Cloud-Based
By Organization Size
- Large Enterprises
- Small and Medium Enterprises (SMEs)
By End-User Industry
- Automotive and Transportation
- Aerospace and Defense
- Industrial Machinery
- Energy and Utilities
- Construction and Heavy Equipment
- Electronics
- Marine
- Others
Geopolitical Impact Analysis
Rising trade tensions are changing the cost structure and supply chain of the Fatigue and Durability Software Market, particularly for the high-performance hardware required to run advanced simulations. The U.S. introduced a 25% Section 232 tariff on advanced computing chips and semiconductors, effective January 15, 2026, increasing the cost of workstations and computing clusters used for fatigue simulation and finite-element analysis.
U.S. tariffs on Chinese-origin goods have also reached a combined 55%, including a 10% baseline tariff, 20% fentanyl-related duty, and 25% Section 301 tariff. These measures can increase the cost of servers, GPUs, and other IT components used in on-premises durability software installations.
The World Trade Organization lowered its global merchandise trade growth forecast for 2026 to 1.9%, compared with 4.6% in 2025, and warned that prolonged Middle East conflict and higher crude oil and LNG prices could reduce growth further to 1.4%. These pressures are encouraging software vendors and industrial users to build more regional computing infrastructure in North America and Europe.
As fatigue and durability platforms increasingly depend on GPU-powered servers for complex engineering models, the 25% chip tariff and higher China-related duties raise total ownership costs. However, AI-related electronics trade value increased by more than 40% year-on-year in the first quarter of 2026, showing that demand for advanced computing hardware remains strong despite tariffs and supply-chain changes.
Regional Analysis
North America held a dominant position in the Fatigue and Durability Software Market, capturing more than 34.5% share and generating around USD 327.7 million in revenue in 2025. The region benefits from a strong presence of automotive manufacturers, aerospace companies, and defense contractors.
These industries use structural simulation and durability software to meet strict safety, performance, and certification requirements. High R&D spending in the U.S. further supports demand for fatigue and engineering simulation tools across vehicle, aircraft, and defense development programs.
Asia Pacific is expected to be the fastest-growing region, supported by expanding industrial activity. China’s industrial output increased by 5.9% year-on-year in 2025, while equipment manufacturing grew by 9.2% and high-tech manufacturing advanced by 9.4%. India also produced 3.47 crore (34.7 million) vehicles in FY2025-26, representing growth of 11.8% year-on-year, while passenger vehicle sales reached a record 46.4 lakh units, increasing by 7.9%.
Europe maintains a stable market position, supported by its established aerospace and defense industries. The European aerospace and defense sector generated approximately EUR 325.7 billion in turnover in 2024. As Asia Pacific manufacturing expands faster than mature Western markets, the region is expected to narrow the gap with North America through 2035.
Key Regions and Countries
North America
- US
- Canada
Europe
- Germany
- France
- The UK
- Spain
- Italy
- Rest of Europe
Asia Pacific
- China
- Japan
- South Korea
- India
- Australia
- Rest of APAC
Latin America
- Brazil
- Mexico
- Rest of Latin America
Middle East & Africa
- GCC
- South Africa
- Rest of MEA
Market Dynamics
Drivers
| Driver | (~) % CAGR | Geographic Relevance | Impact Timeline |
|---|---|---|---|
| SaaS and cloud-licensing migration in CAE tools | +3.1% | North America, Europe | Short term (2 years or less) |
| Electric vehicle platform redesign cycles | +2.4% | Asia Pacific, Europe | Short term (2 years or less) |
| Rising aircraft delivery backlogs and structural testing needs | +1.8% | North America, Europe | Medium term (2 to 4 years) |
| Consolidation of simulation vendors expanding bundled offerings | +1.5% | Global | Short term (2 years or less) |
| Expansion of India and Southeast Asia automotive manufacturing base | +1.2% | Asia Pacific | Medium term (2 to 4 years) |
SaaS and cloud-licensing migration in CAE tools
The market is shifting from perpetual licenses toward subscription and cloud-based pricing. This transition gained momentum after the USD 34.9 billion Synopsys-Ansys acquisition in July 2025 and the USD 10 billion Siemens-Altair acquisition in March 2025.
Subscription models can lower upfront costs for mid-sized engineering teams, although vendor gross margins may decline by around 2–4 percentage points during the transition. At the same time, recurring subscriptions improve revenue visibility and support continued R&D investment.
Ansys invested USD 528.0 million in R&D in 2024, equal to 20.7% of revenue. Wider use of cloud and subscription models could bring smaller manufacturers into the market and provide additional growth beyond the existing 12.2% CAGR.
Restraints
| Restraint | (~) % CAGR | Geographic Relevance | Impact Timeline |
|---|---|---|---|
| Semiconductor and compute hardware tariff escalation | -2.2% | North America, China | Short term (2 years or less) |
| ITAR and export-control data residency mandates | -1.4% | North America | Medium term (2 to 4 years) |
| High interest-rate environment delaying enterprise CapEx | -1.1% | Global | Short term (2 years or less) |
| Antitrust regulatory review delays on simulation M&A | -0.6% | Europe, United States | Short term (2 years or less) |
Semiconductor and compute hardware tariff escalation
The market faces rising hardware costs due to the 25% Section 232 tariff on advanced computing chips effective January 15, 2026. U.S. tariffs on Chinese-origin electronics can total 55%, including a 10% baseline duty, 20% fentanyl-linked surcharge, and 25% Section 301 tariff.
These measures increase the cost of GPU servers and workstations used for large fatigue and finite-element simulations. Hardware procurement lead times may also extend by around 15–20 days as buyers shift sourcing away from tariffed suppliers.
This creates particular pressure on on-premise deployments, which hold 66.1% market share, and may delay hardware refresh spending by around 2–3 quarters. Higher infrastructure costs could therefore limit near-term market growth against the existing 12.2% CAGR.
Challenges
| Challenge | (~) % CAGR | Geographic Relevance | Mitigation Horizon |
|---|---|---|---|
| Simulation engineer talent shortage | -1.6% | North America, Europe | Long term (4 years or more) |
| Legacy on-premises integration complexity | -1.0% | Global | Medium term (2 to 4 years) |
| Fragmented interoperability standards across CAE vendors | -0.7% | Global | Long term (4 years or more) |
| Post-merger integration disruption at major vendors | -0.5% | North America, Europe | Medium term (2 to 4 years) |
Simulation engineer talent shortage
The market faces a talent constraint as U.S. mechanical and simulation engineering employment is projected to grow only 9.1% between 2024 and 2034, adding around 26,500 jobs. This growth may not fully match the rising fatigue-analysis workload created by electric vehicles and expanding aerospace programs.
Specialized CAE and durability roles can remain open for an estimated 30–40 additional days, limiting implementation and customization capacity. Vendors may need greater investment in AI-assisted simulation and university partnerships, which could increase near-term operating expenses by around 1–2 percentage points of revenue before productivity benefits are realized.
Opportunities
| Opportunity | (~) % CAGR | Geographic Relevance | Execution Window |
|---|---|---|---|
| AI-native generative fatigue modeling monetization | +2.6% | Global | Medium term (2 to 4 years) |
| Cross-sell into adjacent life sciences and industrial IoT verticals | +1.5% | North America, Europe | Long term (4 years or more) |
| Untapped SME segment via low-code simulation tiers | +1.3% | Asia Pacific, Europe | Medium term (2 to 4 years) |
| Roll-up M&A of niche fatigue-testing specialists | +0.9% | Global | Long term (4 years or more) |
AI-native generative fatigue modeling monetization
This remains an untapped opportunity because most simulation software is still priced by user seats and compute usage rather than AI-driven design outcomes. Dassault Systèmes reported 4% software revenue growth to EUR 1.40 billion in Q2 2026, but current disclosures do not separately identify revenue from generative-AI fatigue or durability offerings.
Future upside could come from pricing based on design iterations or engineering outcomes. AI-driven automation may reduce manual meshing and load-case setup time by up to 40%, while improved efficiency could support an estimated 3–5 percentage-point increase in software gross margins. This opportunity would sit above the market’s existing 12.2% CAGR rather than being fully reflected in current growth forecasts.
Key Players Analysis
The Fatigue and Durability Software Market is led by a Tier-1 group of large and diversified simulation software companies. Ansys Inc. generated USD 2,544.8 million in revenue in 2024, increasing 12.1% year-over-year, while spending USD 528.0 million, or 20.7% of revenue, on R&D. This investment supports continued development of fatigue, durability, and structural simulation solutions.
Siemens strengthened its competitive position through the completed USD 10 billion acquisition of Altair Engineering. Siemens Group reported EUR 75.9 billion in FY2024 revenue and EUR 9.0 billion in net income. The Altair transaction is expected to contribute around EUR 600 million to digital business revenue, generate more than USD 1.0 billion in annual revenue synergies over the long term, and deliver over USD 150 million in annual EBITDA cost synergies by year two.
Hexagon AB also maintains a strong Tier-1 position, investing EUR 855.7 million in R&D in 2024, equal to 16% of net sales, while launching more than 450 new products. Dassault Systèmes, through SIMULIA, and Comsol remain major competitors in structural and multiphysics simulation.
Tier-2 companies such as HBK, ATA Engineering, Endurica LLC, Femfat, Dewesoft, and ESI Group mainly compete through specialized fatigue, vibration, and durability capabilities, often working alongside broader Tier-1 engineering platforms.
Top Key Players in the Market
- HBK
- ANSYS Inc.
- Siemens Digital Industries Software
- Altair Engineering Inc.
- ATA Engineering
- Hexagon
- Dassault Systèmes
- Komachine
- Endurica LLC
- Dewesoft
- Simulia
- Femfat
- Comsol
- ESI Group
Recent Developments
- In 2025, Siemens completed its acquisition of Altair Engineering on March 26 for an enterprise value of approximately USD 10 billion. The original deal valued Altair at USD 113 per share, representing a 19% premium to its unaffected closing price.
- In 2025, Synopsys completed its acquisition of Ansys on July 17 for approximately USD 34.9 billion, including USD 17.6 billion in cash and USD 17.1 billion in Synopsys stock. The combination brought Ansys’ engineering simulation and structural analysis technologies together with Synopsys’ design platform and expanded the combined company’s addressable market to around USD 31 billion.
Report Scope
| Report Features | Description |
|---|---|
| Market Value (2025) | USD 955.3 million |
| Forecast Revenue (2035) | USD 3,020.3 million |
| CAGR (2026-2035) | 12.2% |
| Base Year for Estimation | 2025 |
| Historic Period | 2020-2024 |
| Forecast Period | 2026-2035 |
| Report Coverage | Revenue Forecast, Market Dynamics, Competitive Landscape, Recent Developments |
| Segments Covered | By Component (Software, Services (Implementation and Integration, Training and Support, Consulting Services)); By Deployment Mode (On-Premise, Cloud-Based); By Organization Size (Large Enterprises, Small and Medium Enterprises (SMEs)); By End-User Industry (Automotive and Transportation, Aerospace and Defense, Industrial Machinery, Energy and Utilities, Construction and Heavy Equipment, Electronics, Marine, Others) |
| Regional Analysis | North America – US, Canada; Europe – Germany, France, The UK, Spain, Italy, Rest of Europe; Asia Pacific – China, Japan, South Korea, India, Australia, Singapore, Rest of APAC; Latin America – Brazil, Mexico, Rest of Latin America; Middle East & Africa – GCC, South Africa, Rest of MEA |
| Competitive Landscape | HBK, ANSYS Inc., Siemens Digital Industries Software, Altair Engineering Inc., ATA Engineering, Hexagon, Dassault Systèmes, Komachine, Endurica LLC, Dewesoft, Simulia, Femfat, Comsol, ESI Group |
| Customization Scope | Customization for segments, region/country-level will be provided. Moreover, additional customization can be done based on the requirements. |
| Purchase Options | We have three licenses to opt for: Single User License, Multi-User License (Up to 5 Users), Corporate Use License (Unlimited Users and Printable PDF) |





























