


Report Overview
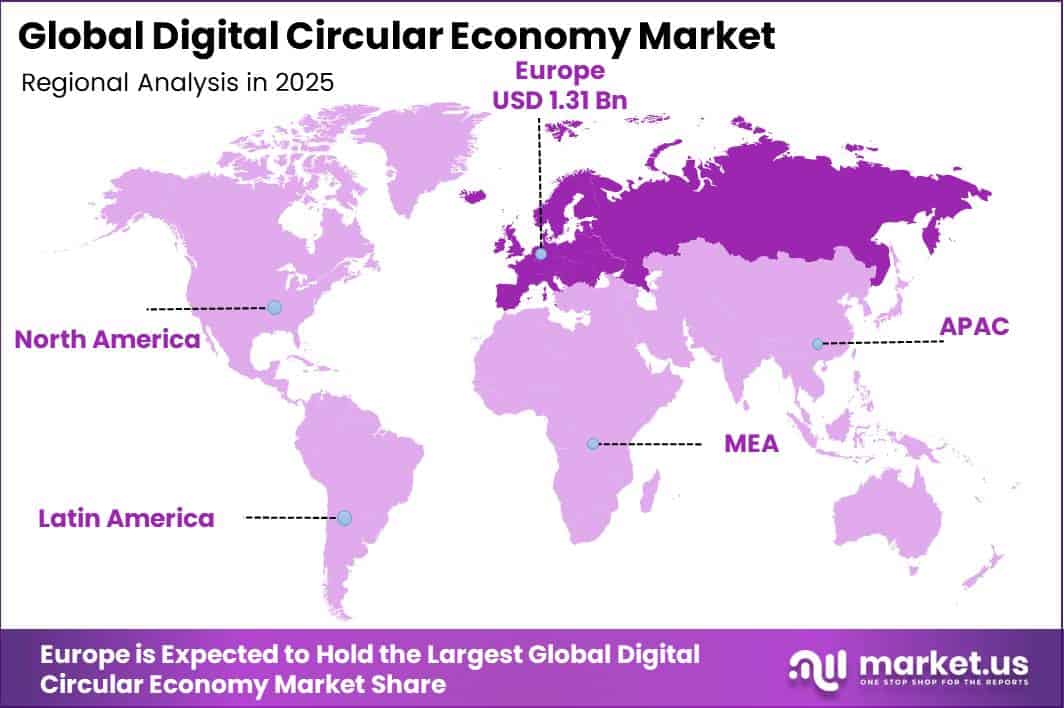
In 2025, the Global Digital Circular Economy Market was valued at USD 3.6 billion. The market is projected to grow at a CAGR of 24.6% during 2026–2035, reaching approximately USD 32.6 billion by 2035. Europe dominated the global market in 2025, accounting for more than 36.4% of the total market share and generating approximately USD 1.31 billion in revenue.
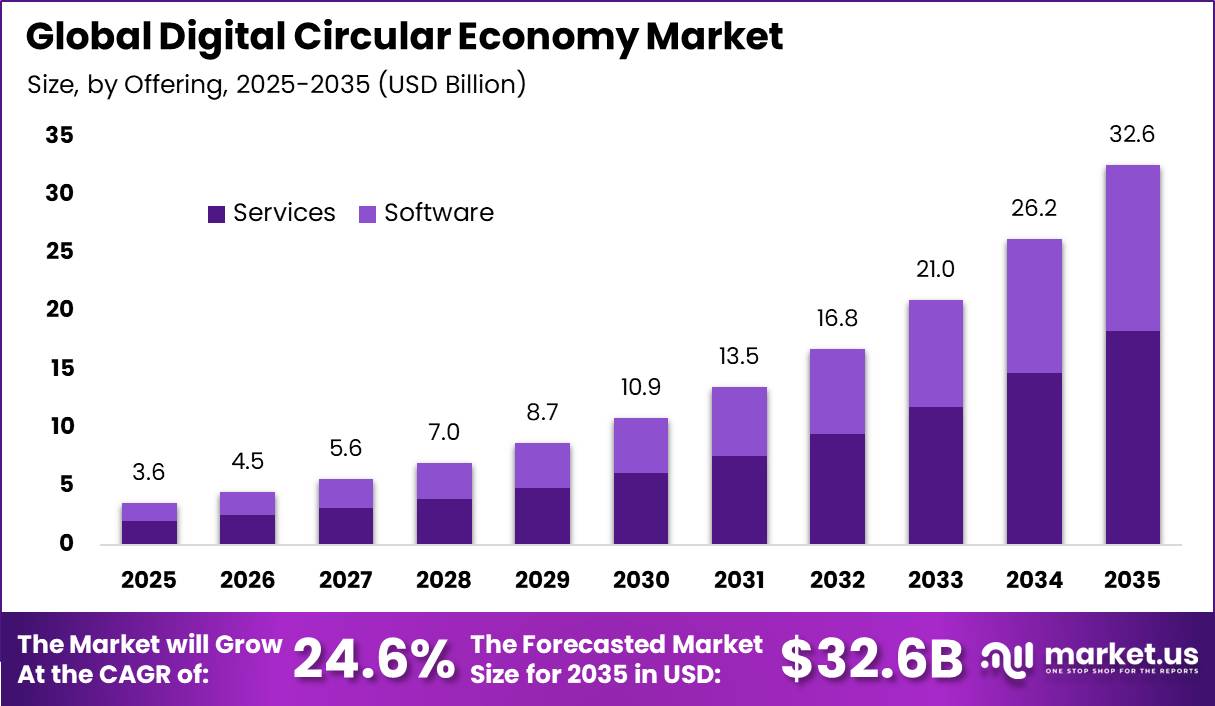
Growth is supported by rising government regulations, sustainability targets, and greater use of digital technologies to reduce waste and improve recycling. Global e-waste reached 62 million tonnes in 2022, while only 22.3% was formally collected and recycled. In the European Union, around 1,992 million tonnes of waste were treated in 2022, but 38.6% was still disposed of.
Packaging waste reached 83.4 million tonnes, including 16.16 million tonnes of plastic packaging waste, with only 40.7% recycled. These large waste volumes are increasing demand for digital tracking, AI-based sorting, material marketplaces, and product-data platforms.
Europe is expected to remain a major market due to strict circular-economy regulations. Recycled materials represented only 12.2% of total EU material use in 2024, while 87.8% came from non-recycled sources. The EU aims to double recycled-material use by 2030, with strategic raw-material recycling targeted at 25% of annual consumption.
Packaging-waste recycling must reach 70% by 2030, while at least 40% of transport packaging must be reusable from January 2030. From February 2027, battery passports will apply to EV batteries, light-mobility batteries, and industrial batteries above 2 kWh, supporting demand for digital product passports and lifecycle-tracking platforms.
Key Takeaway
- The Digital Circular Economy Market was valued at USD 3.6 billion in 2025 and is projected to reach USD 32.6 billion by 2035, growing at a 24.6% CAGR.
- In 2025, Services dominated the Digital Circular Economy Market with a 56.3% share.
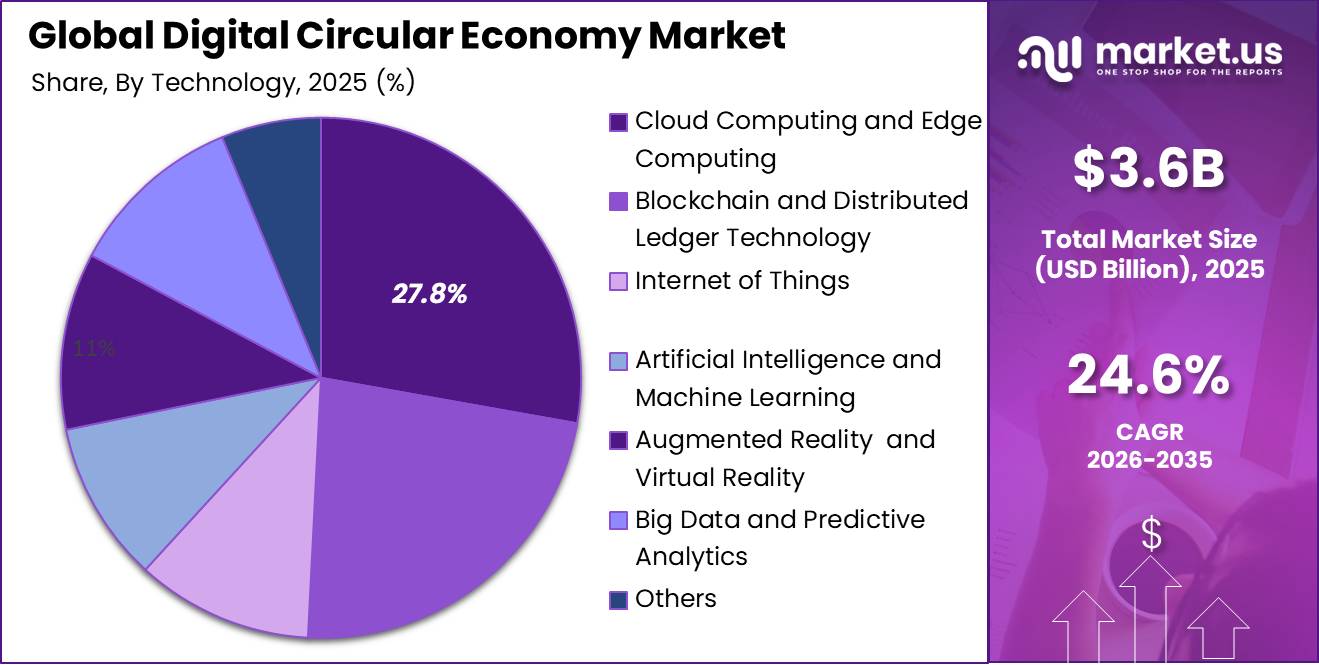
- In 2025, Cloud Computing and Edge Computing captured a 27.8% market share.
- In 2025, Supply Chain and Material Tracking held a leading 24.5% share.
- In 2025, Industrial Manufacturing accounted for a dominant 25.7% market share.
- Europe led the market in 2025 with over 36.4% share and around USD 1.31 billion in revenue.
Market Statistics and Data Insights
- E-waste generated in 2022 contained about 31 million tonnes of metals, 17 million tonnes of plastics, and 14 million tonnes of other materials. The embedded metals were valued at about USD 91 billion, including USD 19 billion of copper, USD 15 billion of gold, and USD 16 billion of iron.
- Documented e-waste recycling recovered about USD 28 billion of secondary raw materials, avoided around 900 million tonnes of primary ore extraction, and prevented approximately 93 million tonnes of CO2-equivalent emissions in 2022.
- In a 2024 EU survey, 78% of Europeans said environmental problems directly affect their daily lives, while around 60% expressed concern about increasing quantities of waste.
- Nearly 59% of Europeans in 2024 said they were willing to pay more for products that are easier to repair, recyclable, and sustainably produced. However, this declined from 72% in 2007, indicating that affordability remains important even when consumers support circular products.
- The EEA’s combined circular-consumption indicator found that around 65% of EU citizens in 2024 recognised environmental impacts, were concerned about waste, supported waste-reduction actions, or were willing to pay more for circular products.
- Only 35% of consumers were reported to choose repair for their products, while discarded electrical and electronic equipment amounted to around 7 million tonnes in the EU, illustrating the remaining gap between repair potential and actual behavior.
- GS1 states that more than 1 billion products currently carry GS1 barcodes and these codes are scanned around 10 billion times every day, providing a large existing identification infrastructure that can migrate toward QR-based lifecycle and recycling data.
- In 2025, 78% of EU internet users purchased goods or services online, providing a large digital consumer base for QR-based product passports, resale platforms, repair services, and digitally enabled take-back programs.
- Ireland’s deposit-return system collected 30,917 tonnes of material during 2025, while more than 4,500 community initiatives were using the scheme by year-end.
- TOMRA’s 2025 operations included more than 91,900 installed reverse-vending machines across over 60 markets, collecting more than 53 billion used beverage containers annually through digitally enabled deposit-return infrastructure.
By Offering
In 2025, the Services segment held a dominant position in the Digital Circular Economy Market, accounting for 56.3% of the total market share. The segment leads because many organizations need expert support to turn circular-economy goals into practical systems.
Service providers assist businesses with material-flow mapping, supplier and recycler integration, product-data preparation, ERP integration, recycled-content verification, regulatory reporting, system maintenance, and data management.
Demand is also supported by the growing size of circular-economy activities. More than 4 million people worked in EU circular-economy sectors in 2021, while the sector generated around EUR 686.9 billion in output. These activities include repair, reuse, recycling, remanufacturing, logistics, and waste management, creating strong demand for consulting and implementation services.
By Technology
In 2025, Cloud Computing and Edge Computing held a significant position in the Digital Circular Economy Market, capturing a 27.8% share. The segment is growing because circular-economy operations require fast, secure, and continuous data exchange across factories, warehouses, collection centers, repair facilities, and recycling plants.
Cloud platforms help businesses store and manage product, material, and compliance data across different locations, while edge computing processes sensor and machine data close to where it is generated. This supports faster sorting, asset tracking, quality checks, and equipment monitoring. In the EU, 52.74% of enterprises used paid cloud services in 2025, increasing by 7.42 percentage points from 2023.
The European Commission aims for 75% of EU businesses to use cloud-edge technologies and plans to deploy 10,000 climate-neutral and secure edge nodes by 2030. Edge-node deployment increased from 498 in 2022 to around 1,836 in 2024. This expanding digital infrastructure supports real-time data processing and helps companies make faster decisions related to reuse, repair, remanufacturing, recycling, and material recovery.
By Application
In 2025, Supply Chain and Material Tracking held a dominant position in the Digital Circular Economy Market, capturing a 24.5% share. The segment leads because circular supply chains need verified product and material data from raw-material sourcing through reuse, recycling, and final recovery.
The OECD estimated that global trade in counterfeit goods reached USD 467 billion in 2021, representing 2.3% of global imports and 4.7% of EU imports. This increases the importance of digital identity systems, serialisation, QR codes, RFID tags, and secure chain-of-custody records. In the EU textile sector, separate collection rules for used textiles and footwear are also increasing the need for reliable tracking.
By End User
In 2025, Industrial Manufacturing held a dominant position in the Digital Circular Economy Market, capturing a 25.7% share. The segment leads because manufacturers handle large volumes of raw materials, components, packaging, production scrap, and end-of-life products.
The large size of the manufacturing sector makes these improvements financially important. EU manufacturing generated around EUR 9.9 trillion in turnover and EUR 2.5 trillion in value added in 2023, while employing 30.2 million people. Manufacturing also represented 23.1% of total EU business-economy value added, making it the largest sector by economic output.
Globally, manufacturing’s share of world GDP increased from 14.7% in 2000 to 16.7% in 2023. As production expands, manufacturers are increasingly adopting digital twins, IoT sensors, lifecycle-management software, factory data platforms, and traceability tools to reduce material loss, recover production scrap, improve efficiency, and meet sustainability reporting requirements.
Key Market Segments
By Offering
- Software
- Circularity Analytics Platforms
- Digital Twin Platforms
- Lifecycle Assessment Software
- Circular Supply Chain Management Software
- Services
- Consulting and Implementation
- Integration and Deployment
- Support and Maintenance
- Training and Education
By Technology
- Cloud Computing and Edge Computing
- Blockchain and Distributed Ledger Technology
- Internet of Things (IoT)
- Artificial Intelligence (AI) and Machine Learning (ML)
- Augmented Reality (AR) and Virtual Reality (VR)
- Big Data and Predictive Analytics
- Others
By Application
- Supply Chain and Material Tracking
- Resource Optimization and Efficiency
- Digital Resale and Reuse
- Reverse Logistics and Remanufacturing
- Circular Economy Reporting and Compliance
- Circular Waste Management and Recycling
- Smart Material Selection and Testing
- Others
By End User
- Industrial Manufacturing
- Consumer Electronics
- Information Technology and Telecom
- Automotive and Transportation
- Construction and Building Materials
- Retail and E-Commerce
- Others
Geopolitical Impact Analysis
Geopolitical disruptions are increasing the cost and complexity of Digital Circular Economy solutions because many systems depend on globally sourced sensors, RFID tags, QR-code labels, servers, networking equipment, batteries, industrial gateways, and electronic components. Red Sea tensions have forced ships to avoid the Suez Canal and travel around the Cape of Good Hope.
UNCTAD reported that Suez Canal transit tonnage declined by 70% by mid-2024, while the China Containerized Freight Index increased by around 120% between October 2023 and June 2024. Red Sea and Suez disruptions contributed 148 percentage points to this increase. On the Shanghai–Northern Europe route, spot freight rates rose 256% to USD 2,648 per TEU by 9 February 2024.
Higher shipping costs can increase prices and delay deployment of IoT devices, smart bins, scanners, sensors, edge-computing equipment, and automated sorting systems. Trade tensions are creating additional uncertainty. The WTO projected global merchandise-trade volume to decline 0.2% in 2025, nearly 3 percentage points below its low-tariff baseline, while wider tariff uncertainty could lead to a 1.5% contraction.
These risks encourage companies to diversify suppliers, regionalize production, and hold larger inventories, increasing demand for supply-chain visibility and material-tracking platforms. Energy costs also remain important. The World Bank projected energy prices to decline 17% in 2025, after Brent crude averaged USD 81 per barrel in 2024.
Regional Analysis
Europe led the global Digital Circular Economy Market in 2025, accounting for 36.4% of total revenue and generating around USD 1.31 billion. The region’s strong position is supported by strict sustainability rules, a mature recycling system, and early adoption of digital product-data technologies.
Initial implementation is focused on batteries, with future coverage expected across textiles, iron and steel, and construction products. In addition, 52.7% of EU enterprises used paid cloud-computing services in 2025, up 7.4 percentage points from 2023, while adoption reached 85% among large enterprises.
North America is expected to be the fastest-growing region, supported by higher investment in recycling, advanced manufacturing, industrial IoT, smart logistics, and sustainability reporting. In the United States, the Infrastructure Investment and Jobs Act allocated USD 275 million to the EPA’s Solid Waste Infrastructure for Recycling program during fiscal years 2022–2026, equal to USD 55 million per year.
The EPA also announced USD 117 million in recycling and food-waste grants, including around USD 58 million for community recycling infrastructure and USD 20 million for tribal recycling projects. These investments are supporting demand for digital collection, sorting, tracking, and secondary-material platforms.
Key Regions and Countries
North America
- US
- Canada
Europe
- Germany
- France
- The UK
- Spain
- Italy
- Rest of Europe
Asia Pacific
- China
- Japan
- South Korea
- India
- Australia
- Rest of APAC
Latin America
- Brazil
- Mexico
- Rest of Latin America
Middle East & Africa
- GCC
- South Africa
- Rest of MEA
Market Dynamics
Drivers
| Driver | (~) % CAGR | Geographic Relevance | Impact Timeline |
|---|---|---|---|
| Digital product passport rollout | +3.2% | Europe, global exporters to EU | Short term (2 years or less) |
| Enterprise cloud adoption | +2.6% | Europe, North America, Asia-Pacific | Short term (2 years or less) |
| Industrial IoT deployment | +2.1% | Global manufacturing hubs | Medium term (2 to 4 years) |
| Battery traceability compliance | +1.9% | Europe, China, North America | Short term (2 years or less) |
| Secondary-material procurement | +1.5% | Europe, Japan, South Korea | Medium term (2 to 4 years) |
Digital product passport rollout
The Digital Product Passport rollout is a major demand catalyst because circularity data is becoming a product-market access requirement. From 18 February 2027, electric-vehicle batteries, industrial batteries above 2 kWh, and light-means-of-transport batteries will require a battery passport, increasing demand for product identifiers, cloud repositories, lifecycle records, and supplier-data integration.
The Ecodesign for Sustainable Products Regulation also supports wider passport use across textiles, iron and steel, furniture, tyres, and chemicals. In 2025, 52.7% of EU enterprises used paid cloud services, up from 45.2% in 2023, while adoption among large enterprises reached 85%.
This digital base supports SaaS subscriptions, managed compliance, data hosting, and API integration, contributing an estimated +3.2% to the baseline CAGR.
Restraints
| Restraint | (~) % CAGR | Geographic Relevance | Impact Timeline |
|---|---|---|---|
| High implementation cost | -2.4% | Global, strongest among SMEs | Short term (2 years or less) |
| Fragmented compliance requirements | -1.8% | Europe, North America, Asia-Pacific | Medium term (2 to 4 years) |
| Recycling infrastructure deficits | -1.6% | Emerging markets | Long term (4 years or more) |
| Weak customer data readiness | -1.4% | Global SMEs and public bodies | Short term (2 years or less) |
| Hardware procurement inflation | -1.1% | Import-dependent markets | Short term (2 years or less) |
High implementation cost
High implementation cost remains the strongest immediate restraint because circularity systems often require data cleansing, ERP integration, product coding, sensors, cybersecurity, staff training, and regular compliance updates.
The World Bank projected global commodity prices to decline by around 5% in 2025, while UNCTAD reported that the China Containerized Freight Index increased about 120% from October 2023 to June 2024, raising costs for imported scanners, RFID equipment, networking devices, and edge-computing hardware.
Small and medium-sized enterprises also face tighter financing conditions than large companies, limiting investment in multi-year digital transformation projects. As a result, vendors can experience longer sales cycles, delayed capital approvals, and pressure on implementation pricing, creating an estimated -2.4% drag on the baseline CAGR.
Challenges
| Challenge | (~) % CAGR | Geographic Relevance | Mitigation Horizon |
|---|---|---|---|
| Material Data Quality | -2.0% | Global multi-tier supply chains | Medium term (2 to 4 years) |
| Interoperability Standards Gap | -1.7% | Europe and global trade corridors | Medium term (2 to 4 years) |
| Cybersecurity Exposure | -1.4% | Global industrial networks | Long term (4 years or more) |
| Digital Skills Shortage | -1.3% | Europe, North America, Asia-Pacific | Long term (4 years or more) |
| Cross-Border Data Complexity | -1.0% | Global exporters and recyclers | Medium term (2 to 4 years) |
Material Data Quality
The European Commission requires battery passport data to be accessible through QR codes from 18 February 2027. Companies must therefore improve data governance, supplier onboarding, automated validation, and interoperable identifiers. Poor-quality data can weaken compliance, reduce platform use, and create an estimated -2.0% friction drag on maximum market growth.
Opportunities
| Opportunity | (~) % CAGR | Geographic Relevance | Execution Window |
|---|---|---|---|
| Industrial material marketplaces | +2.8% | Europe, North America, Asia-Pacific | Medium term (2 to 4 years) |
| SME circularity subscriptions | +2.2% | Global | Short term (2 years or less) |
| AI sorting monetization | +1.9% | Europe, North America, East Asia | Medium term (2 to 4 years) |
| Reverse logistics platforms | +1.6% | North America, Europe, India | Medium term (2 to 4 years) |
| Refurbishment asset networks | +1.4% | Global electronics and machinery hubs | Long term (4 years or more) |
Industrial material marketplaces
Industrial material marketplaces offer a major untapped opportunity because secondary-material supply remains fragmented across waste generators, recyclers, processors, and manufacturers. UNEP estimates that global resource extraction and processing contribute to more than 90% of biodiversity loss and water-stress impacts and around 50% of climate-change emissions.
The World Bank projects municipal solid waste generation could reach 3.40 billion tonnes annually by 2050. The EU Critical Raw Materials Act targets recycling to supply 25% of annual strategic raw-material consumption by 2030.
Digital marketplaces can improve material matching, quality verification, provenance tracking, and logistics. Automated matching could reduce brokerage and processing costs by 15–25%, while improving recycler gross margins by around 3–7 percentage points, supporting potential CAGR upside of +2.8%.
Key Players Analysis
The Digital Circular Economy Market remains fragmented, with major enterprise software, cloud, industrial automation, and consulting companies forming the Tier-1 group. Microsoft, SAP, IBM, Accenture, Schneider Electric, Siemens, Oracle, Dassault Systèmes, Capgemini, Cognizant, Infosys, and Hitachi Vantara are estimated to account for around 55–65% of total market spending.
Their strong position comes from existing cloud, ERP, industrial IoT, digital-twin, supply-chain, and consulting platforms. Microsoft reported USD 281.7 billion in fiscal 2025 revenue, including USD 168.9 billion from Microsoft Cloud, while R&D spending reached USD 32.5 billion, equal to 12% of revenue.
SAP generated EUR 36.8 billion in 2025 revenue, including EUR 21.0 billion from cloud, and invested EUR 6.63 billion, or 18.0%, in R&D. IBM recorded USD 67.5 billion in revenue, including USD 21.1 billion from Consulting, invested USD 8.32 billion in R&D, and completed 10 acquisitions.
Tier-2 players include TOMRA, Veolia Digital Services, Avery Dennison, Circularise, Rheaply, Everledger, Resourcify, and Loopcycle. TOMRA generated EUR 1.318 billion in 2025 revenue, operated about 119,900 installations across more than 100 markets, and collected 53 billion containers through over 91,900 reverse-vending machines. Accenture generated USD 69.7 billion in fiscal 2025 revenue, USD 10.9 billion in free cash flow, and USD 2.7 billion from generative AI.
Top Key Players in the Market
- SAP SE
- IBM Corporation
- Accenture plc
- Microsoft Corporation
- Schneider Electric SE
- Circularise B.V.
- Rheaply Inc.
- Everledger Ltd.
- Resourcify GmbH
- Loopcycle Ltd.
- Veolia Digital Services
- TOMRA Systems ASA
- Avery Dennison Corporation
- Oracle Corporation
- Dassault Systèmes SE
- Hitachi Vantara LLC
- Infosys Ltd.
- Siemens AG
- PwC Circular Economy Services
- Capgemini SE
- Cognizant Technology Solutions
Recent Developments
- In 2026, Schneider Electric agreed to acquire 100% of Cognite Holding B.V. in an all-cash transaction valued at USD 3.1 billion, strengthening its industrial data, AI, digital-twin, and asset-management capabilities. Schneider Electric also agreed to acquire approximately 90% of AiDASH at an implied enterprise value of USD 350 million.
- In 2026, TOMRA Recycling increased its ownership in PolyPerception to a 51% majority stake and introduced an AI-native platform for real-time recycling data analysis. TOMRA also launched three new deep-learning applications under its GAINnext ecosystem.
Report Scope
| Report Features | Description |
|---|---|
| Market Value (2025) | USD 3.6 Billion |
| Forecast Revenue (2035) | USD 32.6 Billion |
| CAGR (2026-2035) | 24.6% |
| Base Year for Estimation | 2025 |
| Historic Period | 2020-2024 |
| Forecast Period | 2026-2035 |
| Report Coverage | Revenue Forecast, Market Dynamics, Competitive Landscape, Recent Developments |
| Segments Covered | By Offering (Software [Circularity Analytics Platforms, Digital Twin Platforms, Lifecycle Assessment Software, Circular Supply Chain Management Software], Services [Consulting and Implementation, Integration and Deployment, Support and Maintenance, Training and Education]); By Technology (Cloud Computing and Edge Computing, Blockchain and Distributed Ledger Technology, IoT, AI and ML, AR and VR, Big Data and Predictive Analytics, Others); By Application (Supply Chain and Material Tracking, Resource Optimization and Efficiency, Digital Resale and Reuse, Reverse Logistics and Remanufacturing, Circular Economy Reporting and Compliance, Circular Waste Management and Recycling, Smart Material Selection and Testing, Others); By End User (Industrial Manufacturing, Consumer Electronics, Information Technology and Telecom, Automotive and Transportation, Construction and Building Materials, Retail and E-Commerce, Others) |
| Regional Analysis | North America – US, Canada; Europe – Germany, France, The UK, Spain, Italy, Rest of Europe; Asia Pacific – China, Japan, South Korea, India, Australia, Singapore, Rest of APAC; Latin America – Brazil, Mexico, Rest of Latin America; Middle East & Africa – GCC, South Africa, Rest of MEA |
| Competitive Landscape | SAP SE, IBM Corporation, Accenture plc, Microsoft Corporation, Schneider Electric SE, Circularise B.V., Rheaply Inc., Everledger Ltd., Resourcify GmbH, Loopcycle Ltd., Veolia Digital Services, TOMRA Systems ASA, Avery Dennison Corporation, Oracle Corporation, Dassault Systèmes SE, Hitachi Vantara LLC, Infosys Ltd., Siemens AG, PwC Circular Economy Services, Capgemini SE, Cognizant Technology Solutions |
| Customization Scope | Customization for segments, region/country-level will be provided. Moreover, additional customization can be done based on the requirements. |
| Purchase Options | We have three licenses to opt for: Single User License, Multi-User License (Up to 5 Users), Corporate Use License (Unlimited Users and Printable PDF) |





























