


Report Overview
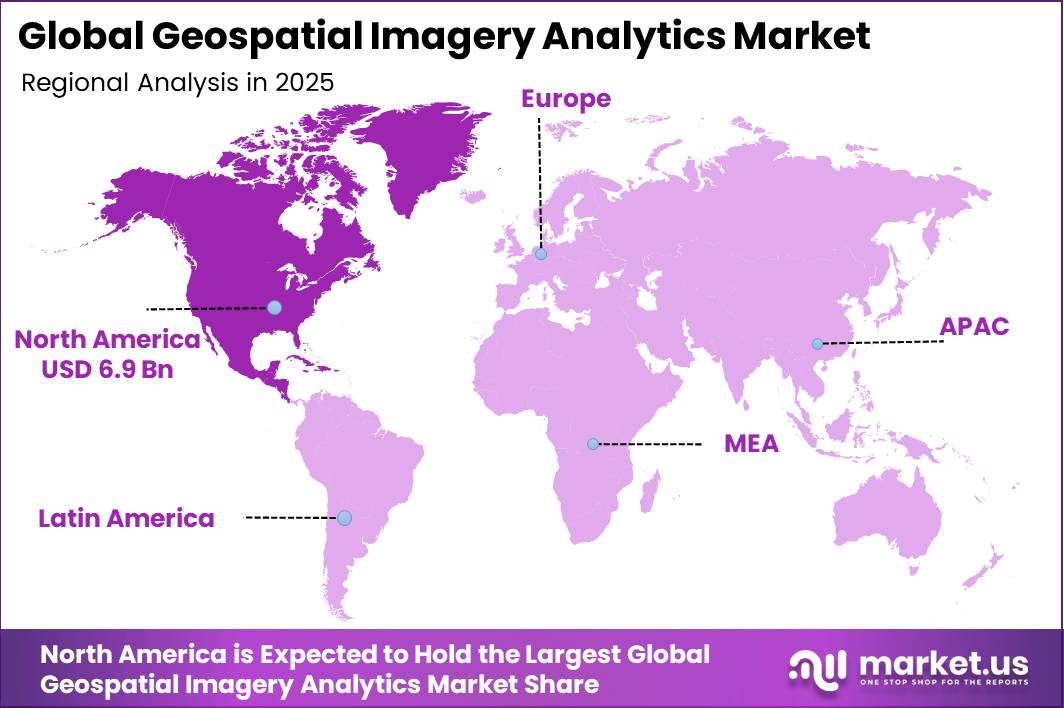
In 2025, the Global Geospatial Imagery Analytics Market was valued at USD 17.9 billion. The market is projected to grow at a CAGR of 10.9% during 2026–2035, reaching approximately USD 50.2 billion by 2035. North America dominated the global market in 2025, accounting for more than 38.7% of the total market share and generating approximately USD 6.9 billion in revenue.
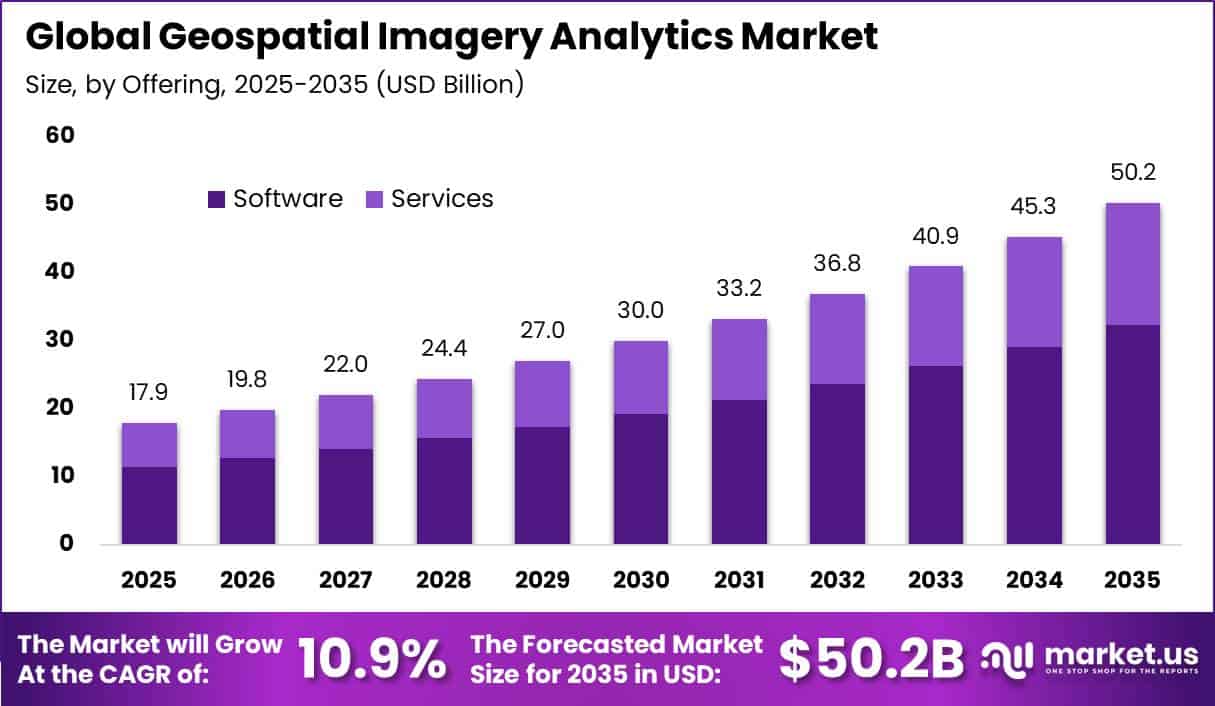
The rising use of satellite, drone, and aerial imagery across construction, agriculture, infrastructure, disaster management, defense, utilities, and urban planning is supporting market growth. In the United States, construction spending reached an annual rate of USD 2.14 trillion in June 2025, including USD 738.8 billion in private non-residential construction and USD 144.1 billion in highway construction.
These large projects are increasing demand for imagery analytics to monitor construction progress, measure land changes, inspect assets, and identify project risks. The U.S. Federal Aviation Administration also expects the commercial small-drone fleet to exceed 1 million units in 2025 and reach nearly 1.118 million units by 2029, creating additional demand for image-processing and mapping software.
NASA estimated that free Landsat data generated around USD 25.6 billion in economic value for the U.S. economy in 2023. In agriculture, the USDA’s 2025 Cropland Data Layer used 10-meter satellite imagery from Landsat 8, Landsat 9, and Sentinel-2. Growing imagery volumes are encouraging organizations to adopt automated platforms for image classification, change detection, risk forecasting, and faster location-based decision-making.
Key Takeaway
- Geospatial Imagery Analytics Market is valued at USD 17.9 billion in 2025, projected to reach USD 50.2 billion by 2035 at a 10.9% CAGR.
- Software Segment: In 2025, the software segment dominated the market with more than a 64.2% share.
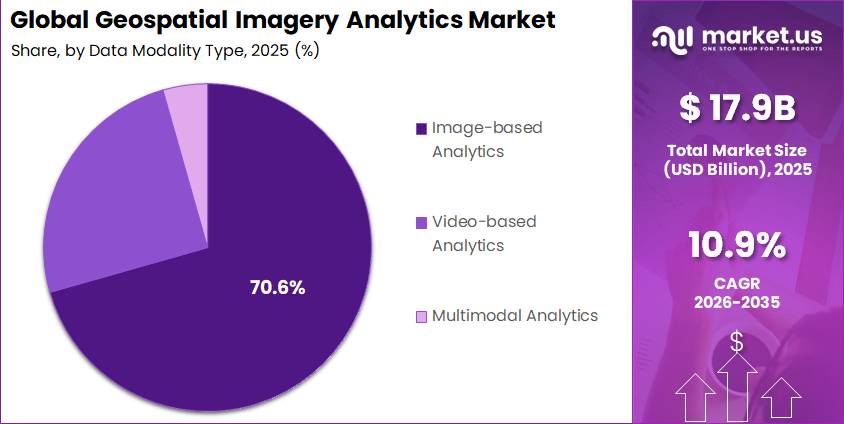
- Image-Based Analytics Segment: In 2025, image-based analytics led the market with more than a 70.6% share.
- Satellite Imagery Segment: In 2025, satellite imagery held the leading position with more than a 32.8% share.
- Surveillance and Monitoring Segment: In 2025, surveillance and monitoring accounted for more than a 21.2% share.
- Government and Defense Segment: In 2025, government and defense led the market with more than a 26.1% share.
- North America led the market in 2025 with a 38.7% share and USD 6.9 billion in revenue.
Market Statistics and Data Insights
- Global military expenditure reached USD 2.887 trillion in 2025, increasing 2.9% in real terms. Spending was 41% higher than in 2016, while military expenditure represented 2.5% of global GDP.
- Copernicus infrastructure handled as many as 1,000 catalogue queries per second and approximately 2 billion queries per month. More than 200 PB of Earth-observation data were made available to users during 2024.
- European users accounted for 77.7% of Copernicus Data Space downloads in 2024. Qualified users could achieve average download speeds of up to 90 MB/s, versus a stable 20 MB/s for general users.
- FAA’s 2024 survey found 56% of surveyed Part 107 operators were Core Part 107 operators conducting non-recreational flights, 36% were recreational-only Part 107 operators, and 8% reported no flights. Core operators averaged 131.3 flights annually, including 95.1 non-recreational flights.
- In the FAA survey, real estate and construction were the most common commercial activity areas, with more than 500 Core Part 107 operators reporting that they were at least somewhat active in each activity.
- 382 Part 107 registrants reported operating UAS for police, fire, search-and-rescue, or other emergency-response organizations. These organizations carried out 45,888 emergency-response drone operations in 2024.
- Around 41% of surveyed emergency-response organizations shared a UAS program with another organization. They averaged 10.9 drone operations per month and 7.0 operators or remote pilots per program.
- Global average temperature in 2024 reached 1.55°C ±0.13°C above the 1850–1900 baseline, making it the warmest year in the 175-year observational record. The 10 years from 2015–2024 were the warmest on record.
By Offering
In 2025, the Software segment held a dominant market position, capturing more than a 64.2% share of the geospatial imagery analytics market. Its leadership is mainly driven by the growing need to convert raw satellite, drone, and aerial images into useful information such as land-cover maps, object detection, flood boundaries, crop-health indicators, route planning, 3D models, and infrastructure-risk alerts.
The European Space Agency reports that Copernicus Sentinel missions generate more than 20 TB of data each day, while the Copernicus Data Space Ecosystem provides access to more than 78 PB of data across over 110 million products. Sentinel-2 also provides global imagery at 10-meter resolution and generates around 1.6 TB of raw data per day.
By Data Modality
In 2025, the Image-based analytics segment held a dominant market position, capturing more than a 70.6% share of the geospatial imagery analytics market. Its leadership is supported by the ability of satellite, aerial, and drone images to monitor physical changes across large areas quickly. These images help identify damaged buildings, flooded land, blocked roads, crop stress, forest loss, and construction activity.
Disaster management is a major factor supporting segment growth. The European Union’s Copernicus Emergency Management Service recorded 81 on-demand mapping activations in 2025, including 69 rapid-mapping activations, and generated 812 rapid-mapping products for floods, storms, wildfires, earthquakes, and other emergencies.
Similarly, the U.S. Geological Survey’s Annual National Land Cover Database provides yearly Landsat-based maps at 30-meter resolution for the contiguous United States covering 1985 to 2024. The growing need for automated image classification, change detection, risk assessment, land planning, asset monitoring, and disaster recovery continues to strengthen demand for image-based analytics.
By Data Source
In 2025, the Satellite Imagery segment held a dominant market position, capturing more than a 32.8% share of the geospatial imagery analytics market. Its leadership is supported by the ability of satellites to monitor very large and remote areas repeatedly with consistent coverage and resolution.
The European Commission reported that registered Copernicus users increased from 385,000 in 2020 to 638,000 in 2022, while Sentinel missions generated around 6,800 TB of data during 2022. This growing data supply supports analytics across agriculture, forestry, land management, mining, water resources, insurance, and climate monitoring. Forest monitoring is a strong example of satellite imagery use.
According to the UN Food and Agriculture Organization, global forest area totals around 4.06 billion hectares, while about 7.8 million hectares were deforested each year during 2010–2018. FAO’s remote-sensing survey analyzed approximately 430,000 satellite-image samples using Sentinel-2 and Landsat mosaics.
By Application
In 2025, the Surveillance and Monitoring segment held a dominant market position, capturing more than a 21.2% share of the geospatial imagery analytics market. Its leadership is supported by the growing need for continuous, location-based monitoring of land, infrastructure, assets, and environmental risks. Unlike one-time mapping, surveillance requires regular image collection and automated comparison to identify changes at an early stage.
This increases demand for analytics platforms that can detect illegal land clearing, infrastructure damage, flood expansion, encroachment, and vegetation loss across large areas. Forest protection is a major example of this demand. According to the UN Food and Agriculture Organization, global forests cover around 4.14 billion hectares, while deforestation averaged 10.9 million hectares annually during 2015–2025.
By Vertical
In 2025, the Government and Defense segment held a dominant market position, capturing more than a 26.1% share of the geospatial imagery analytics market. Its leadership is supported by the need for reliable and continuous information on borders, military activity, maritime routes, critical infrastructure, disasters, and land-use changes.
NATO also reported that European Allies and Canada increased defense expenditure by more than USD 90 billion in 2025, reaching over USD 571 billion in 2021 prices. Geospatial imagery analytics supports intelligence, surveillance, reconnaissance, border security, and infrastructure protection by converting continuous image feeds into maps, alerts, and actionable intelligence.
Key Market Segments
By Offering
- Software
- Image Processing and Enhancement
- Object Tracking and Feature Detection
- Change Detection and Time-Series Analysis
- Predictive Modeling and Pattern Recognition
- AI-based Geospatial Imagery Analytics
- Others
- Services
- Professional Services
- Consulting and Advisory
- Deployment and Integration
- Support and Maintenance
- Managed Services
By Data Modality
- Image-based Analytics
- Video-based Analytics
- Multimodal Analytics
By Data Source
- Satellite Imagery
- Synthetic Aperture Radar (SAR)
- Aerial Imagery
- UAV/Drones
- GIS and Mapping Platforms
- Others
By Application
- Surveillance and Monitoring
- Environmental Monitoring and Climate Change
- Land Use and Land Cover Classification
- Asset and Infrastructure Management
- Insurance Risk Assessment and Claims Validation
- Disaster Management and Emergency Response
- Precision Farming and Crop Monitoring
- Urban Planning and Smart City Design
- Target Detection and Strategic Intelligence
- Supply Chain and Logistics Monitoring
- Disease Outbreak Tracking and Resource Allocation
- Retail Site Selection and Consumer Footfall Mapping
- Others
By Vertical
- Government and Defense
- Insurance
- Agriculture
- Construction and Real Estate
- Mining
- Healthcare and Life Sciences
- Energy and Utilities
- Telecommunications
- Transportation and Logistics
- Media and Entertainment
- Others
Geopolitical Impact Analysis
Geopolitical tensions are increasing supply-chain, energy, and logistics risks across the geospatial imagery analytics market. The industry depends on satellites, drones, optical and radar sensors, infrared detectors, advanced semiconductors, antenna systems, high-performance servers, and cloud infrastructure.
Further restrictions were introduced in April 2025 on tungsten, tellurium, bismuth, indium, molybdenum, and seven medium and heavy rare-earth elements. These materials are important for semiconductors, infrared imaging systems, electronic circuits, precision motors, and communication equipment used in Earth-observation satellites and drones.
Logistics disruptions are creating additional pressure. UNCTAD reported that Suez Canal ship-tonnage transit levels were around 70% below the 2023 average by early May 2025 as vessels avoided the Red Sea and travelled around the Cape of Good Hope. Longer routes increase fuel use, freight costs, insurance expenses, inventory requirements, and delivery uncertainty for aerospace and electronics components.
Energy costs are another concern. The World Bank forecasts a 24% year-on-year increase in energy prices in 2026, with Brent crude expected to average USD 86 per barrel, compared with USD 69 per barrel in 2025. Higher energy and fuel costs can increase spending on aircraft surveys, freight, data centers, launch support, and image processing.
Regional Analysis
In 2025, North America held a dominant market position in the geospatial imagery analytics market, capturing more than a 38.7% share and generating approximately USD 6.9 billion in revenue. The region benefits from a well-developed satellite ecosystem, strong defense and homeland-security spending, advanced cloud infrastructure, and early adoption of artificial intelligence-based spatial analysis.
The United States remains the main demand center, where federal agencies use geospatial data for weather forecasting, border surveillance, disaster response, agriculture, transportation planning, coastal monitoring, and infrastructure protection. NOAA estimates that the U.S. National Spatial Reference System can generate more than USD 2.4 billion in annual economic benefits.
NOAA’s GOES-R satellite program is also expected to deliver total economic benefits of around USD 20 billion to USD 50 billion through better weather intelligence, aviation safety, agriculture, energy planning, and disaster-risk management.
Asia Pacific is expected to be the fastest-growing regional market. Growth is supported by rapid urbanization, large agricultural areas, frequent natural disasters, defense modernization, and expanding domestic satellite programs. Countries such as China, India, Japan, South Korea, Australia, Indonesia, and Southeast Asian nations are increasing Earth-observation investments.
Key Regions and Countries
North America
- US
- Canada
Europe
- Germany
- France
- The UK
- Spain
- Italy
- Rest of Europe
Asia Pacific
- China
- Japan
- South Korea
- India
- Australia
- Rest of APAC
Latin America
- Brazil
- Mexico
- Rest of Latin America
Middle East & Africa
- GCC
- South Africa
- Rest of MEA
Market Dynamics
Drivers
| Driver | (~) % CAGR | Geographic Relevance | Impact Timeline |
|---|---|---|---|
| Defense Earth Intelligence | +2.1% | North America, Europe, Asia Pacific | Short term (2 years or less) |
| Open Satellite Data Scale | +1.8% | Global | Short term (2 years or less) |
| Cloud AI Integration | +1.6% | North America, Europe | Medium term (2 to 4 years) |
| Climate Risk Monitoring | +1.3% | Global | Medium term (2 to 4 years) |
| Infrastructure Asset Digitization | +1.1% | North America, Asia Pacific, Europe | Medium term (2 to 4 years) |
Defense Earth Intelligence
Defense and national-security spending is a major driver for geospatial imagery analytics as governments increase persistent satellite, radar, and aerial monitoring. SIPRI reported global military expenditure of USD 2.71 trillion in 2024, up 9.4% in real terms. In December 2025, the U.S. Space Development Agency also awarded L3Harris up to USD 843 million to build 18 infrared tracking satellites.
Growing sensor networks create more demand for automated geolocation, object detection, change analysis, and alerts. ESA’s Copernicus programme generates more than 20 TB of Sentinel data daily, supporting wider use of cloud analytics and recurring intelligence services. Defense demand could contribute around +2.1% incremental growth within the market’s 10.9% baseline CAGR.
Restraints
| Restraint | (~) % CAGR | Geographic Relevance | Impact Timeline |
|---|---|---|---|
| Critical Mineral Export Controls | -1.7% | Global | Short term (2 years or less) |
| Public Procurement Delays | -1.3% | North America, Europe | Short term (2 years or less) |
| Sovereign Data Localization | -1.2% | Asia Pacific, Middle East, Europe | Medium term (2 to 4 years) |
| High Sensor Replacement Cost | -1.0% | Global | Medium term (2 to 4 years) |
| Restricted Security Clearances | -0.8% | North America, Europe | Long term (4 years or more) |
Critical Mineral Export Controls
Critical-mineral export restrictions are an immediate restraint for the geospatial imagery analytics market because satellites, drones, and sensors depend on gallium, germanium, and rare-earth materials. The IEA reported that China restricted exports of gallium, germanium, and antimony to the United States in December 2024 and added controls on 7 heavy rare-earth elements in April 2025.
Supply pressure is also increased by logistics disruption. UNCTAD reported that Suez Canal tonnage transits were around 70% below the 2023 average by early May 2025. Higher sourcing costs, longer lead times, and delayed equipment investment could reduce the market’s achievable CAGR by an estimated -1.7%.
Challenges
| Challenge | (~) % CAGR | Geographic Relevance | Mitigation Horizon |
|---|---|---|---|
| Skilled Geospatial Talent Gap | -1.4% | Global | Long term (4 years or more) |
| Multisensor Data Interoperability | -1.2% | Global | Medium term (2 to 4 years) |
| Cloud Processing Energy Load | -0.9% | North America, Europe, Asia Pacific | Medium term (2 to 4 years) |
| Ground Truth Data Limits | -0.8% | Emerging Markets | Long term (4 years or more) |
| Model Accuracy Assurance | -0.7% | Global | Medium term (2 to 4 years) |
Skilled Geospatial Talent Gap
The shortage of professionals skilled in remote sensing, GIS, data engineering, and machine learning remains a key operational challenge. The U.S. Bureau of Labor Statistics expects data-scientist employment to rise 33.5%, from 245,900 jobs in 2024 to 328,300 by 2034, adding 82,500 roles. ESA’s Copernicus system also produces more than 20 TB of Sentinel data daily, increasing demand for trained analytics specialists.
Large historical datasets, such as USGS land-cover records covering 1985–2024, also require skilled teams for model training and validation. Companies are responding through automation, reusable models, managed services, and university partnerships. Without these measures, talent shortages and higher labor costs could create around -1.4% friction on the market’s maximum growth potential.
Opportunities
| Opportunity | (~) % CAGR | Geographic Relevance | Execution Window |
|---|---|---|---|
| Parametric Insurance Analytics | +1.9% | Global | Medium term (2 to 4 years) |
| Carbon MRV Data Services | +1.6% | Global | Medium term (2 to 4 years) |
| Autonomous Infrastructure Inspections | +1.4% | North America, Europe, Asia Pacific | Long term (4 years or more) |
| Emerging Market Land Registries | +1.2% | Africa, Latin America, Asia Pacific | Long term (4 years or more) |
| Edge Analytics Licensing | +1.0% | Global | Medium term (2 to 4 years) |
Parametric Insurance Analytics
Parametric insurance is a strong opportunity for geospatial imagery analytics, as most solutions are still sold as data or monitoring services rather than automatic insurance triggers. The World Meteorological Organization confirmed that 2024 was the warmest year on record at 1.55°C above pre-industrial levels, while Copernicus recorded 81 emergency mapping activations in 2025.
Providers can integrate verified event triggers, APIs, and portfolio-risk scores directly into insurance claims and premium workflows. This approach could reduce manual assessment costs by an estimated 20% to 35% per event and improve software gross margins by around 8 to 15 percentage points. Successful adoption of parametric insurance solutions could contribute approximately +1.9% growth above the market’s 10.9% baseline CAGR.
Key Players Analysis
The geospatial imagery analytics market is led by a limited group of Tier-1 technology, mapping, and defense companies, supported by specialized imagery and geospatial-data providers. Google, IBM, Oracle, Hexagon AB, Trimble, Esri, L3Harris Technologies, and Maxar Technologies form the Tier-1 group due to their large customer bases, cloud platforms, mapping technologies, sensor capabilities, and government relationships.
Alphabet generated USD 402.8 billion in revenue in 2025 and invested USD 61.1 billion in R&D, equal to 15% of revenue. Its remaining performance obligations, mainly related to Google Cloud, reached USD 242.8 billion at year-end 2025. IBM reported USD 30.0 billion in software revenue in 2025, increasing 10.6%, while R&D spending reached USD 8.3 billion.
Hexagon, Esri, Trimble, TomTom, and Nearmap represent the main commercial geospatial group. Hexagon’s Geo Systems business generated EUR 363 million in fourth-quarter 2025 revenue. Planet Labs, Maxar, L3Harris, and NV5 Geospatial are more focused on imagery, intelligence, and defense applications. Planet Labs reported fiscal 2026 revenue of USD 307.7 million, up 26% from USD 244.4 million in fiscal 2025.
Its defense and intelligence business added USD 64.0 million, while R&D spending reached USD 80.3 million, or about 26% of revenue. L3Harris generated USD 21.9 billion in fiscal 2025 revenue, including USD 6.95 billion from Space and Airborne Systems. Company-funded R&D reached USD 536 million, while backlog stood at USD 38.7 billion, with 75% of revenue linked to the U.S. Government.
Top Key Players in the Market
- IBM
- Hexagon AB
- TomTom
- Maxar Technologies
- Trimble
- Caliper Corporation
- Planet Labs
- ESRI
- L3Harris Technologies
- Oracle
- NV5 Geospatial
- RMSI
- Maplarge
- Fugro
- Blacksy
- Nearmap
- Supermap
Recent Developments
- In 2026, L3Harris Technologies received a U.S. Space Force contract to produce 18 Accelerated Missile Defense Tranche 3 satellites for the Golden Dome architecture. L3Harris also reported having more than 70 missile-tracking and defense satellites on order, including 5 already in orbit, strengthening its position in space-based sensing and data analytics.
- In 2025, Fugro acquired EOMAP GmbH & Co. KG to strengthen its satellite Earth-observation and water-mapping capabilities. The acquisition added technologies for monitoring marine and freshwater environments through satellite imagery. EOMAP generated around EUR 5 million in revenue in 2024.
Report Scope
| Report Features | Description |
|---|---|
| Market Value (2025) | USD 17.9 Billion |
| Forecast Revenue (2035) | USD 50.2 Billion |
| CAGR (2026-2035) | 10.9% |
| Base Year for Estimation | 2025 |
| Historic Period | 2020-2024 |
| Forecast Period | 2026-2035 |
| Report Coverage | Revenue Forecast, Market Dynamics, Competitive Landscape, Recent Developments |
| Segments Covered | By Offering: Software (Image Processing and Enhancement, Object Tracking and Feature Detection, Change Detection and Time-Series Analysis, Predictive Modeling and Pattern Recognition, AI-based Geospatial Imagery Analytics, Others), Services (Professional Services, Consulting and Advisory, Deployment and Integration, Support and Maintenance, Managed Services); By Data Modality (Image-based Analytics, Video-based Analytics, Multimodal Analytics); By Data Source (Satellite Imagery, Synthetic Aperture Radar (SAR), Aerial Imagery, UAV/Drones, GIS and Mapping Platforms, Others); By Application (Surveillance and Monitoring, Environmental Monitoring and Climate Change, Land Use and Land Cover Classification, Asset and Infrastructure Management, Insurance Risk Assessment and Claims Validation, Disaster Management and Emergency Response, Precision Farming and Crop Monitoring, Urban Planning and Smart City Design, Target Detection and Strategic Intelligence, Supply Chain and Logistics Monitoring, Disease Outbreak Tracking and Resource Allocation, Retail Site Selection and Consumer Football Mapping, Others); By Vertical (Government and Defense, Insurance, Agriculture, Construction and Real Estate, Mining, Healthcare and Life Sciences, Energy and Utilities, Telecommunications, Transportation and Logistics, Media and Entertainment, Others) |
| Regional Analysis | North America – US, Canada; Europe – Germany, France, The UK, Spain, Italy, Rest of Europe; Asia Pacific – China, Japan, South Korea, India, Australia, Singapore, Rest of APAC; Latin America – Brazil, Mexico, Rest of Latin America; Middle East & Africa – GCC, South Africa, Rest of MEA |
| Competitive Landscape | Google, IBM, Hexagon AB, TomTom, Maxar Technologies, Trimble, Caliper Corporation, Planet Labs, ESRI, L3Harris Technologies, Oracle, NV5 Geospatial, RMSI, Maplarge, Fugro, Blacksy, Nearmap, Supermap |
| Customization Scope | Customization for segments and region/country-level will be provided. Moreover, additional customization can be done based on the requirements. |
| Purchase Options | We have three licenses to opt for: Single User License, Multi-User License (Up to 5 Users), Corporate Use License (Unlimited Users and Printable PDF) |





























