


Report Overview
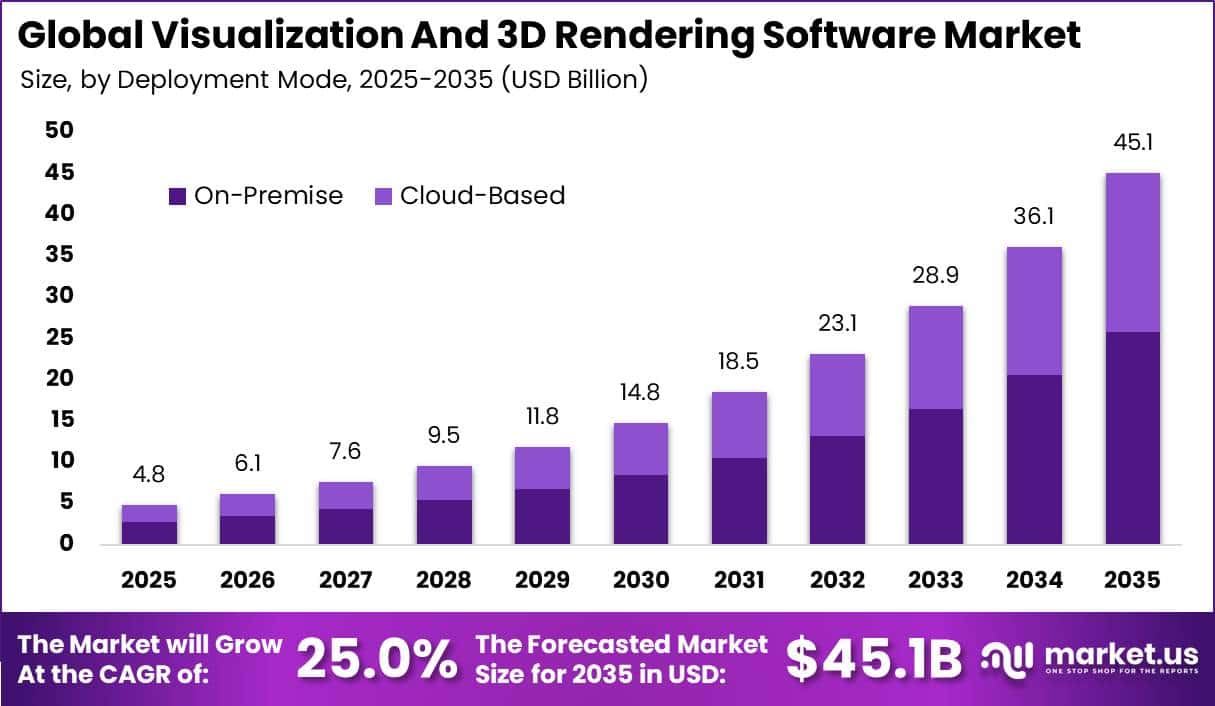
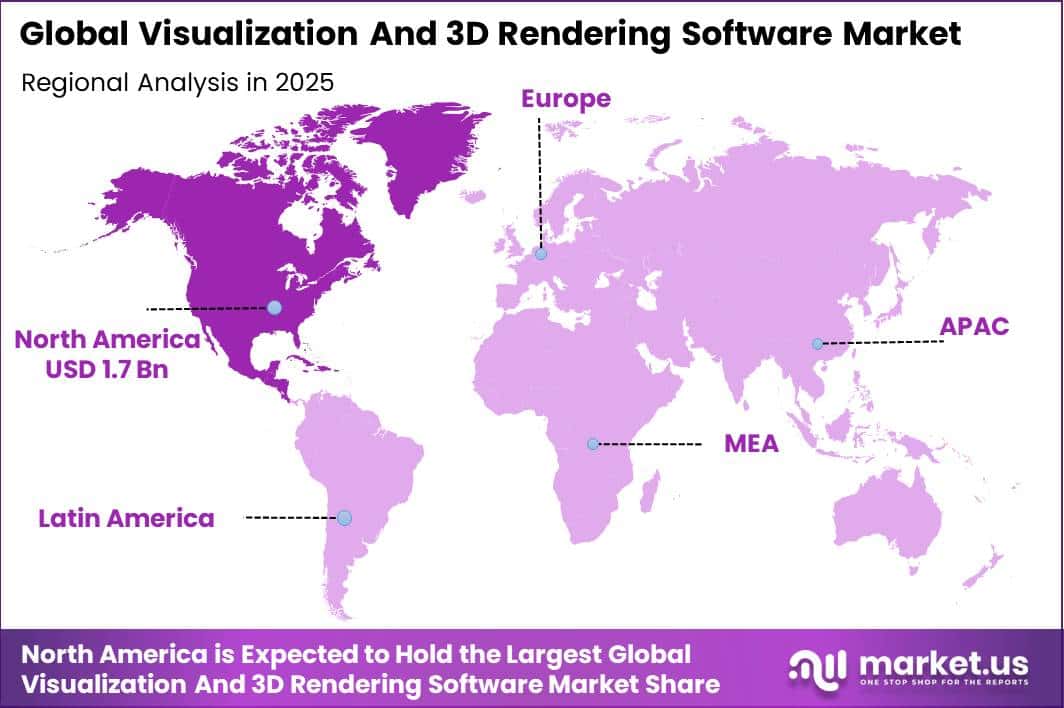
In 2025, the Global Visualization And 3D Rendering Software Market was valued at USD 4.8 billion. The market is projected to grow at a CAGR of 25.0% during 2026–2035, reaching approximately USD 45.1 billion by 2035. North America dominated the global market in 2025, accounting for more than 35.4% of the total market share and generating approximately USD 1.7 billion in revenue.
Growth is supported by the automotive, aerospace, gaming, entertainment, construction, and manufacturing industries. Global vehicle production increased from 92.7 million units in 2024 to 96.4 million units in 2025, up 3.9%. Aircraft production reached around 1,520–1,530 units in 2025, including 600 Boeing commercial jets, its highest level since 2018 and about 72% higher year over year, while Airbus delivered 793 aircraft.
These industries increasingly use 3D visualization for digital prototyping, design testing, and faster product development. Gaming also remains a major demand source, with global revenue exceeding USD 200 billion in 2025, up 9.1%, while PC gaming grew 12% to USD 43.6 billion. Other estimates placed gaming revenue at USD 196.7 billion, up 7.4% from USD 183 billion in 2024.
Global box office revenue reached USD 33.5 billion in 2025, while the visual effects market reached USD 11.4 billion. PwC expects entertainment and media revenue to rise from nearly USD 3 trillion in 2024 to USD 3.5 trillion by 2029. Construction contributes 11–13% of global GDP and nearly 9% of global employment, while manufacturing output increased 0.70% in Q3 2025, further supporting demand for visualization and BIM software.
Key Takeaway
- The Visualization And 3D Rendering Software Market was valued at USD 4.8 billion in 2025 and is projected to reach USD 45.1 billion by 2035, growing at a CAGR of 25.0%.
- On-Premise led the market with a 57.1% share, driven by secure deployment needs across defense, aerospace, and heavy industries.
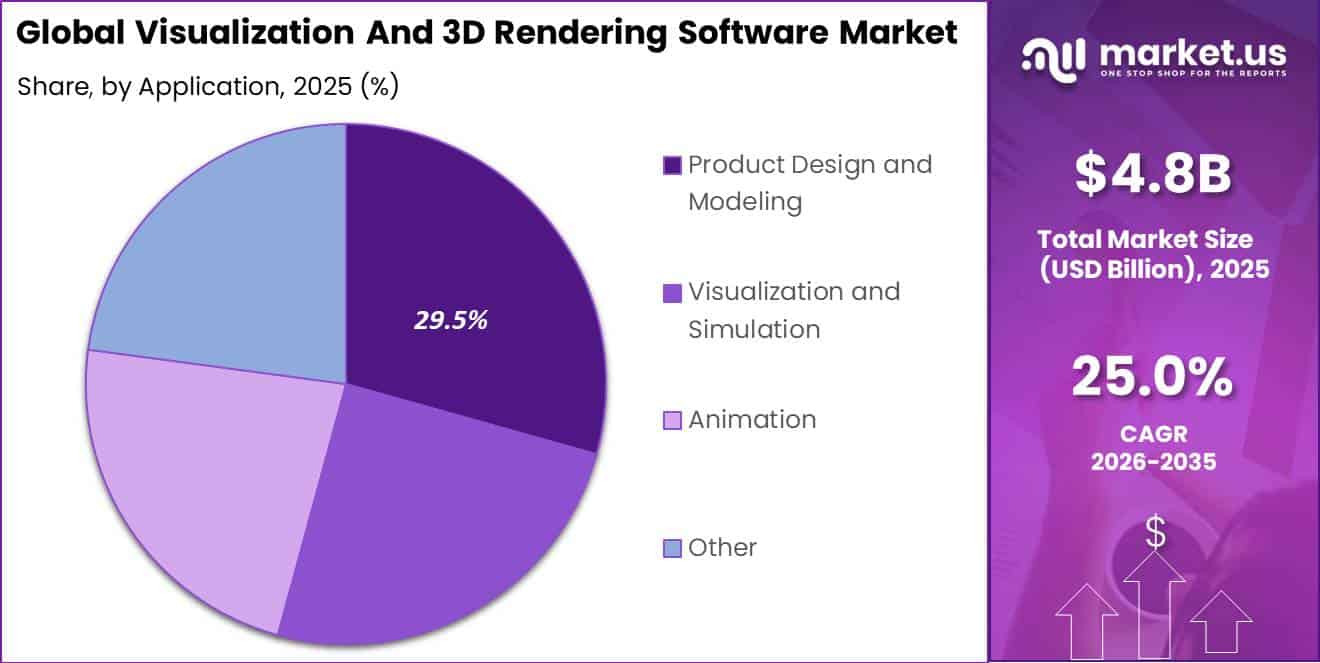
- Product Design and Modeling held a 29.5% share, supported by rising product development activity across manufacturing and consumer sectors.
- AEC captured a 30.1% share, fueled by strong construction activity and growing adoption of digital design and BIM tools.
- North America led the market in 2025 with a 35.4% share, generating about USD 1.7 billion in revenue.
Market Statistics and Data Insights
- Automotive and aerospace digital-prototyping workload: Global motor-vehicle production increased from 92.7 million units to 96.4 million units in 2025, a 3.9% increase, while global vehicle sales reached 99.8 million units, up 4.7%. These production volumes support large CAD, digital-prototyping, simulation, and rendering workloads.
- Aerospace production is also generating a large visualization workload: Boeing delivered 600 commercial aircraft in 2025 versus 348 in 2024, representing 72% growth and its highest annual delivery level since 2018. Airbus separately delivered 793 aircraft, up 4%, and ended 2025 with an order backlog of 8,754 aircraft.
- Product-design activity continues to expand: WIPO recorded approximately 1.22 million industrial-design applications in 2024, up 2.6%, containing around 1.56 million designs, up 2.2%. Designs filed abroad climbed 12.5% to 308,800, indicating increasing international product-development activity.
- Visualization demand is spread across technology and transportation products: WIPO reported that recording and communication equipment represented 12.3% of designs filed through its Hague System in 2024, while means of transport accounted for 11.1%. International Hague applications contained 27,161 designs, up 6.8%.
- Construction maintains a large addressable base for BIM and architectural visualization: U.S. building permits ran at an annualized 1.443 million units in July 2026, 3.1% above July 2025. Permits for buildings with five or more units reached 490,000, while total housing starts were running at 1.239 million units.
- Gaming provides a large consumer base for real-time 3D content. ESA reported 205.1 million Americans regularly playing video games in its 2025 Essential Facts study; 60% of U.S. adults played weekly, 89% of players had played games online, and 55% played with other people at least weekly.
- GPU-based visualization spending is rising sharply: NVIDIA Professional Visualization generated a record USD 3.2 billion in fiscal 2026 revenue, increasing 70%. Fourth-quarter Professional Visualization revenue reached USD 1.3 billion, up 159% year over year.
- Rendering infrastructure is becoming increasingly power-intensive: The IEA estimates that global data-center electricity consumption reached about 485 TWh in 2025 and could rise to approximately 950 TWh by 2030, approaching 3% of global electricity demand. Electricity use by accelerated servers is projected to grow around 30% annually, creating power and infrastructure pressure for GPU-heavy computing.
- Specialized visualization talent remains limited: The U.S. employed approximately 57,100 special-effects artists and animators in 2024. BLS projects employment to reach only about 58,000 by 2034, representing 2% growth, despite approximately 5,000 openings per year.
- Cloud rendering has a substantial enterprise adoption base: In 2025, 52.74% of EU enterprises purchased cloud-computing services, rising to 84.6% among large enterprises. Around 14.8% specifically purchased cloud computing power to run business software, while 13.7% used cloud development, testing, or deployment platforms.
- AI is moving directly into design-and-make workflows: Autodesk’s 2026 AI Pulse found that 98% of surveyed Design and Make leaders use at least one AI tool, 84% said AI improved organizational productivity, and 59% of organizations already use or plan to use agentic AI within one year.
- Blender Foundation’s 2025 survey included 5,102 3D-software users. Blender received an NPS of approximately +82, with 85.6% promoters, 11.3% passive users, and only 3.1% detractors, indicating very high loyalty among active 3D creators.
- Commercial use of accessible 3D tools is substantial: 49.7% of Blender survey participants reported making money using Blender, representing approximately 5% growth from the prior survey. More than half of respondents reported using Blender either daily or weekly.
By Deployment Mode
The On-Premise segment dominated the Visualization and 3D Rendering Software Market with a 57.1% share, supported by strong demand from defense, aerospace, and heavy-industry users that handle sensitive and safety-critical design data. The U.S. Department of Defense’s FY2025 budget authorized USD 878.4 billion for national defense, including USD 167.5 billion for weapons procurement and USD 145.1 billion for platform research and testing.
Large defense programs require secure 3D modeling, simulation, and rendering systems for aircraft, missiles, ships, and other advanced platforms. Security frameworks such as FISMA and FedRAMP also place strict requirements on how government data is stored and processed, increasing the preference for locally controlled infrastructure.
On-premise systems allow organizations to keep confidential design files within secured networks while maintaining greater control over computing resources. Hardware investment also supports this trend, as data center GPU shipments increased 145.5% quarter-over-quarter in Q3 2025. This sharp increase indicates growing investment in dedicated computing capacity for graphics-intensive and simulation workloads.
By Application
The Product Design and Modeling segment dominated the Visualization and 3D Rendering Software Market with a 29.5% share, supported by rising new-product development across manufacturing and consumer industries. According to WIPO, global industrial design filings reached an estimated 1.2 million applications in 2024, increasing 2.6% year over year, and covering around 1.56 million individual designs.
Furniture and household goods represented 16.7% of total filings, while textiles and accessories also accounted for 16.7%. Tools and machines contributed another 11.3%, showing strong product development activity across multiple industries. Before companies invest in physical prototypes, molds, or production equipment, designers use 3D modeling software to define product shape, dimensions, surface details, and overall geometry.
This helps reduce design errors, improve product accuracy, and lower development costs. The growing number of industrial design registrations therefore supports steady demand for advanced visualization and modeling platforms. China remained the largest contributor, filing 906,849 designs in 2024, highlighting the scale of product development activity in major manufacturing markets.
By End-User
The AEC segment dominated the Visualization and 3D Rendering Software Market with a 30.1% share, supported by continued construction activity and growing use of digital design tools before project execution. In the U.S., housing starts reached 1.36 million units in 2025, while multifamily housing starts increased 17.4% year over year, according to the U.S. Census Bureau and HUD.
In addition, around 1.43 million housing units received building permits in 2025, indicating a strong pipeline of future construction projects. Multifamily and commercial developments usually involve complex structural layouts, shared utility systems, and coordination among several construction trades.
This increases the need for 3D Building Information Modeling (BIM) and visualization software to identify design conflicts before construction begins. Architects and engineers can use these tools to check the position of structural, mechanical, electrical, and plumbing systems before materials are installed. This helps reduce costly rework, project delays, and material waste.
Key Market Segments
By Deployment Mode
- Cloud-Based
- On-Premise
By Application
- Product Design and Modeling
- Visualization and Simulation
- Animation
- Other
By End-User
- Architecture, Engineering, and Construction (AEC)
- Media and Entertainment
- Automotive
- Manufacturing
- Healthcare
- Other
Geopolitical Impact Analysis
Rising trade barriers are increasing the cost of hardware and cloud infrastructure used to support 3D rendering and visualization software. In January 2026, the U.S. introduced a 25% Section 232 tariff on advanced computing chips, including Nvidia and AMD data-center GPUs, unless they are used for domestic infrastructure development.
Tariffs on steel and aluminum were also increased from 25% to 50% in June 2025, while a 50% copper tariff was introduced in August 2025. These measures raise the cost of servers, high-performance workstations, networking equipment, and data-center racks used for rendering workloads. By July 2026, the overall U.S. effective tariff rate had reached 12.1%, adding further pressure to imported computing equipment and components.
At the same time, the WTO expects global merchandise trade growth to slow from 4.6% in 2025 to 1.9% in 2026, with growth potentially falling to 1.4% if Middle East energy disruptions continue. Energy costs are creating another challenge. EU wholesale electricity prices averaged USD 90 per megawatt-hour in H1 2025, increasing 30% year over year, while U.S. prices rose 40% to USD 48 per megawatt-hour.
Higher electricity prices directly increase operating costs for GPU-intensive rendering farms and cloud visualization platforms. Despite these pressures, trade in AI-enabling goods, including semiconductors and servers, increased 21.9% to USD 4.18 trillion in 2025, showing that demand for advanced computing infrastructure remains strong despite rising tariffs and energy costs.
Regional Analysis
North America dominated the Visualization and 3D Rendering Software Market with a 35.4% share, generating approximately USD 1.7 billion in revenue in 2025. The region benefits from a strong presence of aerospace, defense, gaming, and advanced manufacturing companies that rely on high-performance 3D rendering for product design, simulation, engineering, and entertainment production.
Asia Pacific is the fastest-growing region, supported by rapid industrial and manufacturing expansion. The region represented approximately 42.7% of global manufacturing output in 2025, with manufacturing value added reaching USD 9.4 trillion. In China, the manufacturing PMI increased to 50.1 in December 2025, while the production sub-index rose by 1.7 points to 51.7, indicating stronger factory activity.
India also recorded strong industrial growth, with industrial production increasing 7.8% year over year in December 2025, its fastest pace in more than 2 years. Manufacturing output rose 8.1%, while computer and electronics production increased 34.9% and motor vehicle production grew 33.5%.
Key Regions and Countries
North America
- US
- Canada
Europe
- Germany
- France
- The UK
- Spain
- Italy
- Rest of Europe
Asia Pacific
- China
- Japan
- South Korea
- India
- Australia
- Rest of APAC
Latin America
- Brazil
- Mexico
- Rest of Latin America
Middle East & Africa
- GCC
- South Africa
- Rest of MEA
Market Dynamics
Drivers
| Driver | (~) % CAGR | Geographic Relevance | Impact Timeline |
|---|---|---|---|
| SaaS/subscription licensing migration | +4.8% | North America, Europe | Short term (2 years or less) |
| GPU-accelerated real-time rendering adoption | +3.9% | Global | Short term (2 years or less) |
| Automotive digital prototyping expansion | +2.6% | Asia Pacific, North America | Medium term (2 to 4 years) |
| Aerospace design simulation demand | +2.1% | North America, Europe | Medium term (2 to 4 years) |
| Gaming and entertainment content production growth | +1.9% | Global | Short term (2 years or less) |
| BIM mandates in construction procurement | +1.4% | Europe, Asia Pacific | Medium term (2 to 4 years) |
SaaS licensing migration reshapes recurring revenue base
The shift from perpetual licenses to subscription-based software is improving vendor economics across the visualization software market. Autodesk reported that recurring revenue represented 97% of total net revenue in fiscal 2026, showing how strongly the industry has moved toward subscription delivery.
Lower upfront costs also make advanced visualization tools more accessible to mid-sized architecture, engineering, and design firms, while customer acquisition payback periods can fall below 18 months. Subscription models also provide vendors with more predictable revenue and stronger customer retention.
Cloud-hosted software tiers can generate gross margins of around 85% to 90%, supported by recurring payments and scalable delivery. Enterprise software spending continued to grow faster than hardware capital expenditure through 2025, supporting continued adoption of cloud-based and subscription visualization platforms.
Restraints
| Restraint | (~) % CAGR | Geographic Relevance | Impact Timeline |
|---|---|---|---|
| High-end GPU hardware allocation bottleneck | -3.2% | Global | Short term (2 years or less) |
| Elevated interest rate financing for enterprise CapEx | -1.6% | North America, Europe | Short term (2 years or less) |
| Semiconductor import tariff cost pass-through | -1.3% | North America | Short term (2 years or less) |
| SME budget constraints on premium licenses | -0.9% | Emerging markets | Medium term (2 to 4 years) |
GPU allocation bottleneck freezes deployment of compute-intensive rendering
High Bandwidth Memory shortages are creating a major hardware bottleneck for advanced 3D rendering. As of mid-2026, lead times for data-center GPUs used in path-traced and AI-assisted rendering were around 36 to 52 weeks, with an estimated global backlog of nearly 3.6 million units. This shortage is delaying on-premises rendering farm upgrades, especially for aerospace and automotive companies that require dedicated infrastructure for security and compliance.
Mid-sized enterprise buyers can be forced to delay purchases by around 2 to 3 quarters as hyperscale customers receive priority allocation. Premium GPU systems can also cost approximately USD 300,000 to USD 350,000 per 8-GPU configuration, increasing capital requirements for rendering infrastructure. These supply and cost pressures are limiting near-term growth in on-premises visualization deployments despite continued demand for advanced rendering software.
Challenges
| Challenge | (~) % CAGR | Geographic Relevance | Mitigation Horizon |
|---|---|---|---|
| 3D graphics talent shortage | -1.8% | Global | Long term (4 years or more) |
| Cross-platform rendering interoperability gaps | -1.2% | Global | Medium term (2 to 4 years) |
| Regulatory compliance documentation burden | -0.9% | Europe | Medium term (2 to 4 years) |
| Legacy on-premises migration friction | -0.7% | North America, Europe | Medium term (2 to 4 years) |
| Cloud rendering data latency constraints | -0.6% | Asia Pacific | Short term (2 years or less) |
Skilled 3D graphics workforce deficit constrains scalable adoption
The market faces a shortage of engineers skilled in real-time rendering, shader programming, and simulation mathematics. This talent gap can slow enterprise adoption of advanced visualization platforms, with implementation schedules sometimes extending by around 4 to 6 months because companies lack sufficient in-house technical expertise.
As a result, vendors such as Autodesk and Dassault Systèmes must invest more in training, certification, technical support, and professional services. These service activities already represent a double-digit percentage of revenue in parts of the enterprise software industry.
Opportunities
| Opportunity | (~) % CAGR | Geographic Relevance | Execution Window |
|---|---|---|---|
| AI-generative rendering monetization | +3.1% | Global | Medium term (2 to 4 years) |
| Emerging-market SME cloud tier expansion | +2.4% | Asia Pacific, Latin America | Medium term (2 to 4 years) |
| Digital twin adjacent-vertical expansion | +1.9% | North America, Europe | Long term (4 years or more) |
| Mid-market M&A consolidation roll-up | +1.5% | Global | Medium term (2 to 4 years) |
| Metaverse and spatial computing content tools | +1.1% | North America, Asia Pacific | Long term (4 years or more) |
Generative AI rendering unlocks new usage-based monetization layer
This opportunity remains largely untapped because diffusion-based and neural rendering technologies are still moving from research and pilot stages toward wider commercial use. Vendors such as NVIDIA continue to invest heavily in AI-assisted graphics and rendering pipelines, but large-scale monetization is still developing.
The main opportunity is to shift from fixed per-seat licensing toward usage-based pricing linked to rendered frames or compute time. This model could improve gross margins by around 5 to 8 percentage points by reducing unused-seat costs. The strongest potential lies among small and mid-sized gaming and architectural visualization studios, where high seat-based pricing often limits adoption of premium rendering tools.
Key Players Analysis
The Visualization and 3D Rendering Software Market has a clear Tier-1 and Tier-2 competitive structure, led by large design-software companies with broad product portfolios. Autodesk remains one of the leading players, reporting USD 7.21 billion in fiscal 2026 revenue, up 18% year over year. Its Design business, including AutoCAD and other 3D modeling solutions, generated USD 6.13 billion, while recurring revenue represented 97% of total sales.
Siemens also maintains a strong position, with its Digital Industries software business increasing annualized recurring revenue by 13% year over year to EUR 5.3 billion. Siemens reported group revenue of EUR 78.9 billion and net income of EUR 10.4 billion in fiscal 2025. Dassault Systèmes and NVIDIA are also part of the Tier-1 group, supported by strong positions in engineering software and high-performance GPU computing for real-time and ray-traced rendering.
Tier-2 companies compete through more specialized applications. Trimble generated USD 3.59 billion in full-year 2025 revenue, while its Architecture, Engineering, Construction and Operations segment contributed USD 1.5 billion, equal to 42% of segment revenue. Trimble also invested USD 630.7 million in R&D, representing 17.6% of revenue.
Adobe, Unity, Enscape, The Foundry, and Lumion compete in focused areas such as architectural visualization, gaming, and film VFX. This creates a market structure where large platform providers compete on scale, while specialized vendors compete through workflow integration and application-specific capabilities.
Top Key Players in the Market
- Autodesk Inc.
- Dassault Systèmes SE
- Trimble Inc.
- Adobe, Inc.
- Unity Technologies
- Siemens AG
- NVIDIA Corporation
- Enscape
- The Foundry Visionmongers Limited
- Lumion
Recent Developments
- In 2026, Autodesk completed its acquisition of MaintainX on August 3 following the merger agreement signed on May 28, 2026. The transaction was valued at approximately USD 3.575 billion and strengthened Autodesk’s strategy to connect design, manufacturing, maintenance, and operational workflows through a unified platform.
- In 2025, Siemens completed the acquisition of Altair Engineering on March 26 for an enterprise value of approximately USD 10 billion. The deal added mechanical and electromagnetic simulation, high-performance computing, data science, and AI capabilities to the Siemens Xcelerator platform, strengthening its digital-twin, engineering simulation, and industrial visualization portfolio.
Report Scope
| Report Features | Description |
|---|---|
| Market Value (2025) | USD 4.8 Billion |
| Forecast Revenue (2035) | USD 45.1 Billion |
| CAGR (2026-2035) | 25.0% |
| Base Year for Estimation | 2025 |
| Historic Period | 2020-2024 |
| Forecast Period | 2026-2035 |
| Report Coverage | Revenue Forecast, Market Dynamics, Competitive Landscape, Recent Developments |
| Segments Covered | By Deployment Mode (Cloud-Based, On-Premise); By Application (Product Design and Modeling, Visualization and Simulation, Animation, Other); By End-User (Architecture, Engineering, and Construction (AEC), Media and Entertainment, Automotive, Manufacturing, Healthcare, Other) |
| Regional Analysis | North America – US, Canada; Europe – Germany, France, The UK, Spain, Italy, Rest of Europe; Asia Pacific – China, Japan, South Korea, India, Australia, Singapore, Rest of APAC; Latin America – Brazil, Mexico, Rest of Latin America; Middle East & Africa – GCC, South Africa, Rest of MEA |
| Competitive Landscape | Autodesk Inc., Dassault Systèmes SE, Trimble Inc., Adobe, Inc., Unity Technologies, Siemens AG, NVIDIA Corporation, Enscape, The Foundry Visionmongers Limited, Lumion |
| Customization Scope | Customization for segments, region/country-level will be provided. Additional customization can be done based on requirements. |
| Purchase Options | We have three licenses to opt for: Single User License, Multi-User License (Up to 5 Users), Corporate Use License (Unlimited Users and Printable PDF) |





































