


Report Overview
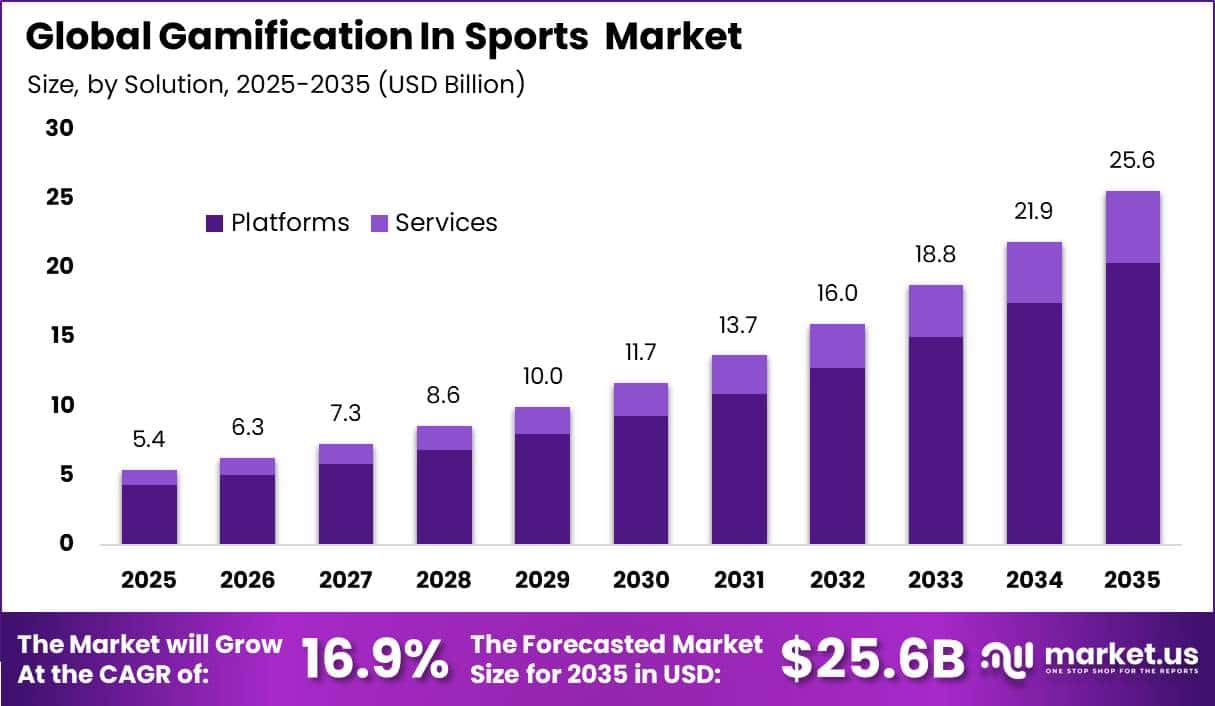
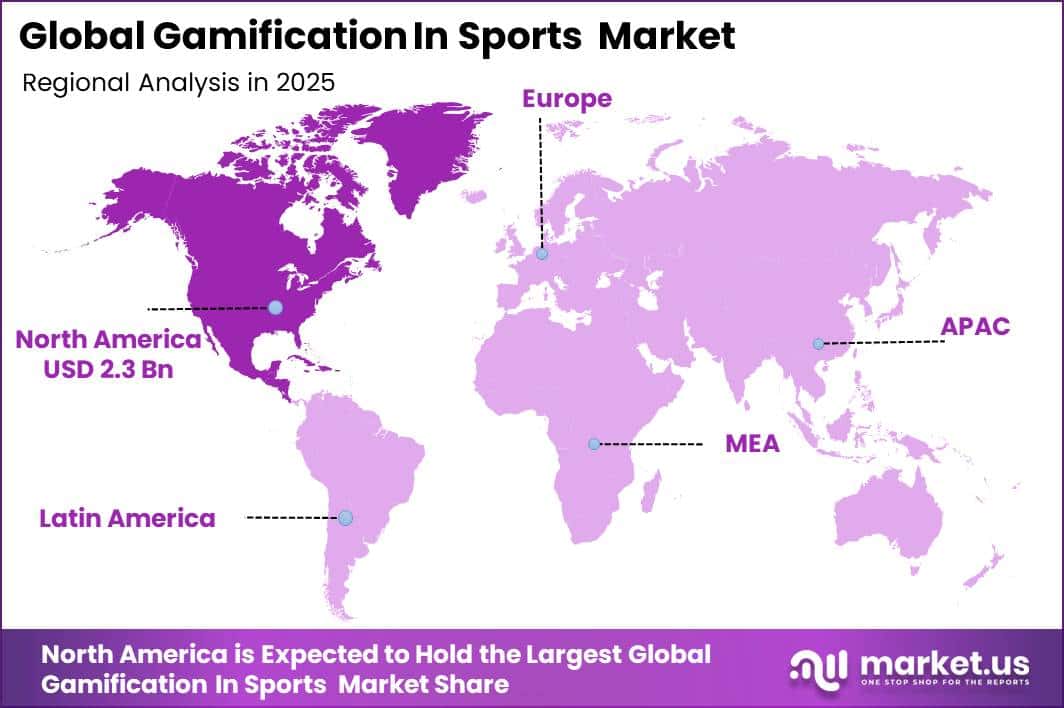
In 2025, the Global Gamification In Sports Market was valued at USD 5.4 billion. The market is projected to grow at a CAGR of 16.9% during 2026–2035, reaching approximately USD 25.6 billion by 2035. North America dominated the global market in 2025, accounting for more than 42.5% of the total market share and generating approximately USD 2.3 billion in revenue.
Growth is supported by increasing participation in sports, fitness, and recreation, which is expanding the user base for platforms using points, rankings, challenges, rewards, virtual badges, prediction games, and social competition. The Sports & Fitness Industry Association reported that 250 million Americans participated in at least one sport, fitness, or leisure activity in 2025, the highest level recorded.
U.S. Bureau of Economic Analysis data also showed that outdoor recreation generated USD 696.7 billion in value added in 2024, equal to 2.4% of U.S. GDP. These trends are encouraging clubs, leagues, fitness operators, brands, and digital platforms to adopt gamification tools that improve engagement and repeat participation.
The U.S. performing arts, spectator sports, museums, and related activities sector generated USD 190.8 billion in GDP in 2024, up from USD 175.4 billion in 2023. In Canada, 55% of people aged 15 years and above participated in at least one sport during 2023. In Mexico, 41.1% of urban adults were physically active in 2024, rising by 1.3 percentage points from the previous year. These strong participation levels support continued demand for gamified sports experiences.
Key Takeaway
- Gamification In Sports Market is valued at USD 5.4 billion in 2025, projected to reach USD 25.6 billion by 2035 at a 16.9% CAGR.
- The Platforms segment dominated the Solution category with a 79.8% share.
- Cloud-based deployment led with a 64.6% share of the Deployment segment.
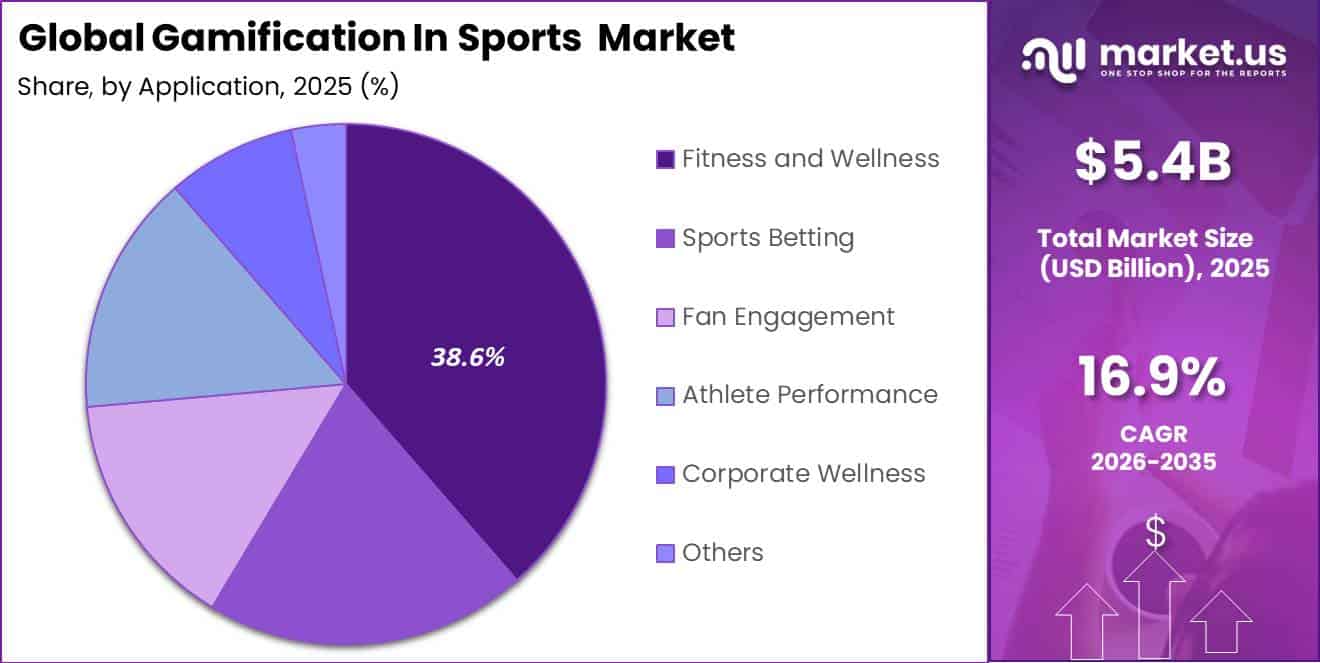
- Fitness and Wellness led applications with a 38.6% share.
- North America led the market in 2025 with a 42.5% share, generating approximately USD 2.3 billion in revenue.
By Solution
The Platforms segment dominated the Gamification in Sports Market with a 79.8% share, mainly because platforms provide the core digital system needed to manage challenges, points, leaderboards, rewards, fan profiles, live scores, content, and performance tracking.
The large size of global sports audiences further supports demand for platform-based gamification. According to the International Olympic Committee, the Olympic website and app reached 325 million monthly unique users during the Paris 2024 Games, while Olympic social channels recorded 16.7 billion engagements, more than twice the Tokyo 2020 level.
FIFA also reported 16 million unique visitors to FIFA.com in June 2025, while its official apps were downloaded one million times during the FIFA Club World Cup period. Managing such high traffic requires strong platforms that can support real-time content, user accounts, rewards, and sponsor campaigns.
By Deployment
The cloud-based segment dominated the Gamification in Sports Market with a 64.6% share, supported by the growing need for flexible and scalable digital systems. Sports organizations require platforms that can manage sudden increases in fan traffic, live-event data, mobile participation, and personalized rewards without investing heavily in in-house IT infrastructure.
During Paris 2024, the Olympic website and app reached 325 million monthly unique users at Games time, while Olympic social channels generated 16.7 billion engagements. Managing this level of activity requires fast processing of user logins, live scores, rankings, challenges, and rewards across multiple countries and devices.
By Application
The fitness and wellness segment led the Gamification in Sports Market with a 38.6% share, supported by the growing need to motivate people to follow regular exercise routines. According to the World Health Organization, 1.8 billion adults, or 31% of the global adult population, did not meet recommended physical activity levels in 2022. If current trends continue, this share could increase to 35% by 2030.
WHO recommends that adults complete 150–300 minutes of moderate physical activity each week, creating strong demand for digital tools that help users set goals, monitor progress, and stay consistent. Gamified fitness apps support these needs through daily step targets, workout streaks, progress dashboards, team challenges, badges, rewards, reminders, and social rankings.
Key Market Segments
-
By Solution
- Platforms
- Services
-
By Deployment
- On-premise
- Cloud-based
-
By Application
- Fitness and Wellness
- Sports Betting
- Fan Engagement
- Athlete Performance
- Corporate Wellness
- Others
Geopolitical Impact Analysis
Geopolitical disruption affects the Gamification in Sports Market mainly by increasing the cost and reducing the availability of digital hardware and cloud infrastructure. Mobile apps, wearables, connected fitness equipment, stadium systems, and data centers depend on semiconductors, sensors, displays, networking equipment, servers, lithium-ion batteries, and other electronics sourced through global supply chains.
According to UNCTAD, disruptions in the Red Sea and Suez Canal between October 2023 and June 2024 contributed 148 percentage points to the cumulative 120% increase in the China Containerized Freight Index, as ships were redirected around the Cape of Good Hope.
Trade-policy uncertainty also creates procurement risks for sports-technology companies. In April 2025, the World Trade Organization estimated that global merchandise trade volume could decline by 0.2% in 2025, nearly 3 percentage points below its low-tariff baseline. Under a worse tariff scenario, the decline could reach 1.5%.
Energy costs add further pressure, as cloud servers, networks, stadium connectivity, and device manufacturing require significant electricity. The World Bank projected average energy prices to rise 24% in 2026, with Brent crude reaching USD 86 per barrel, compared with USD 69 per barrel in 2025.
Regional Analysis
North America led the Gamification in Sports Market in 2025 with a 42.5% share, representing approximately USD 2.3 billion in revenue. The region benefits from a mature digital sports ecosystem, high smartphone and connected fitness device usage, strong spending by professional leagues and clubs, and early adoption of subscription-based fan engagement platforms.
The United States provides a strong base for market growth through major sports leagues, large fitness chains, college sports programs, fantasy sports, sports betting, and corporate wellness programs. Demand is rising for premium digital features such as fitness challenges, loyalty points, live prediction games, rewards, virtual communities, performance dashboards, and in-app purchases.
Asia Pacific is expected to be the fastest-growing regional market, supported by rapid digital adoption and a large mobile-first population. According to GSMA, the region had more than 1.4 billion mobile-internet users at the end of 2023, equal to 51% of its population. This figure is projected to reach 1.8 billion users, or 61% penetration, by 2030.
GSMA also reported that mobile technologies and services contributed USD 950 billion, or 5.6% of Asia Pacific GDP, in 2024. This expanding mobile base supports sports challenges, fitness tracking, esports, fan rewards, and social leaderboards, strengthening the region’s long-term growth outlook.
Key Regions and Countries
North America
- US
- Canada
Europe
- Germany
- France
- The UK
- Spain
- Italy
- Rest of Europe
Asia Pacific
- China
- Japan
- South Korea
- India
- Australia
- Rest of APAC
Latin America
- Brazil
- Mexico
- Rest of Latin America
Middle East & Africa
- GCC
- South Africa
- Rest of MEA
Market Dynamics
Drivers
| Driver | (~) % CAGR | Geographic Relevance | Impact Timeline |
|---|---|---|---|
| Inactive adult engagement gap | +2.4% | Global | Short term (2 years or less) |
| Wearable data integration | +1.8% | North America, Europe, Asia Pacific | Medium term (2 to 4 years) |
| Sports streaming interaction | +1.5% | Global | Short term (2 years or less) |
| Employer wellness adoption | +1.2% | North America, Europe | Medium term (2 to 4 years) |
| Cloud subscription delivery | +1.0% | Global | Short term (2 years or less) |
Inactive Adult Engagement Gap
Rising physical inactivity is increasing demand for engagement-based fitness tools. According to WHO, 31.3% of adults worldwide, or about 1.8 billion people, did not meet recommended activity levels in 2022, up from 23.4% in 2000. If the 2010–2022 trend continues, inactivity could reach 34.7% by 2030, while the World Health Assembly aims for a 15% relative reduction by 2030.
This gap is driving demand for gamified features such as streaks, goals, rewards, social challenges, and progress tracking to improve retention. The International Olympic Committee recorded 325 million monthly unique users across its website and app during Paris 2024, showing the scale of digital sports engagement.
Restraints
| Restraint | (~) % CAGR | Geographic Relevance | Impact Timeline |
|---|---|---|---|
| Consumer subscription fatigue | -2.0% | North America, Europe | Short term (2 years or less) |
| Data privacy compliance cost | -1.6% | Europe, North America | Short term (2 years or less) |
| Budget pressure at clubs | -1.2% | Global | Medium term (2 to 4 years) |
| Fragmented payment access | -0.9% | Emerging markets | Medium term (2 to 4 years) |
| Limited device affordability | -0.8% | Emerging markets | Medium term (2 to 4 years) |
Consumer Subscription Fatigue
Consumer reluctance to maintain multiple paid fitness and sports subscriptions can limit market revenue, as many gamified services depend on recurring app fees, equipment memberships, and premium features. Peloton generated approximately USD 1.67 billion in subscription revenue in fiscal 2025, while paid connected-fitness subscriptions declined 7.6% year on year to 2.66 million in the third quarter of fiscal 2026.
Peloton also increased its All-Access Membership price from USD 44 to USD 49.99 per month in 2025, showing the balance between higher revenue per user and cancellation risk. Continued pressure on household discretionary spending can reduce conversion from free challenges to paid plans, lower customer lifetime value, and slow content, technology, and product investment among smaller providers.
Challenges
| Challenge | (~) % CAGR | Geographic Relevance | Mitigation Horizon |
|---|---|---|---|
| Privacy-safe data interoperability | -1.7% | Global | Medium term (2 to 4 years) |
| Live-event traffic scaling | -1.3% | Global | Short term (2 years or less) |
| Engagement content localization | -1.1% | Asia Pacific, Europe, Latin America | Medium term (2 to 4 years) |
| Wearable data accuracy | -0.9% | Global | Medium term (2 to 4 years) |
| Cybersecurity threat exposure | -0.8% | Global | Long term (4 years or more) |
Privacy-Safe Data Interoperability
Gamified sports platforms must securely manage sensitive data such as activity, location, heart rate, training history, and payment details across apps, wearables, clubs, and cloud systems. WHO’s 2022 assessment covered 507 population-based surveys and 5.7 million participants, highlighting the large scale of health and activity data being analyzed.
Garmin also reported around 20.7 million unit sales in 2025, up from 18.6 million in 2024, further increasing device-generated data volumes. Providers must continuously invest in consent management, security testing, data integration, and system maintenance.
Opportunities
| Opportunity | (~) % CAGR | Geographic Relevance | Execution Window |
|---|---|---|---|
| Preventive health partnerships | +2.7% | Global | Medium term (2 to 4 years) |
| Commercial gym deployment | +2.0% | North America, Europe, Asia Pacific | Medium term (2 to 4 years) |
| Esports reward ecosystems | +1.6% | Asia Pacific, North America, Europe | Long term (4 years or more) |
| Smart-city activity programs | +1.3% | Europe, Asia Pacific, Middle East | Long term (4 years or more) |
| Creator-led coaching marketplaces | +1.1% | Global | Medium term (2 to 4 years) |
Preventive Health Partnerships
Preventive-health partnerships remain a major opportunity, as most sports-gamification solutions are still sold directly to consumers or sports organizations rather than through insurers, employers, and public-health programs.
WHO estimates that around 1.8 billion adults were insufficiently active in 2022 and aims to reduce physical inactivity by 15% by 2030. WHO also recommends 150–300 minutes of moderate aerobic activity per week for adults, supporting structured activity challenges and rewards.
A business-to-business-to-consumer model could reduce customer-acquisition costs per active user by around 20–40% through employer or insurer enrollment. Partner-funded rewards may also improve retention and increase software gross margins by approximately 3–6 percentage points through lower sales and marketing costs.
Key Players Analysis
The Gamification in Sports Market is led by Tier-1 players including Nike, adidas, Garmin, Peloton, and Under Armour. Their strong positions in sportswear, connected fitness, wearables, digital communities, and membership programs provide an advantage over software-only companies. These players are estimated to influence around 45–55% of commercially monetized gamification activity.
Nike reported fiscal 2025 revenue of USD 46.3 billion and spent USD 4.69 billion on demand creation, up 9% year on year. adidas generated EUR 24.8 billion in 2025 net sales and spent EUR 3.08 billion, or 12.4% of sales, on marketing and point-of-sale activities. Its North American revenue reached EUR 5.09 billion, supporting its presence in a region representing 42.5% of the market.
Garmin’s Fitness segment generated USD 2.36 billion in 2025 revenue, up 33%, compared with total company revenue of USD 7.25 billion. Unit sales reached 20.7 million, rising 11%. Peloton reported fiscal 2025 subscription revenue of USD 1.67 billion, representing 67.2% of its USD 2.49 billion total revenue, although subscription revenue declined 2.1%.
Tier-2 players include Strava, MyFitnessPal, Zwift, Fitbit, Jogo Health, Sportle, CoachMePlus, Gametize, Fitocracy, and MIRROR. Together, these companies are estimated to account for 20–30% of addressable software-led gamification revenue. However, limited public financial disclosure means company-level market shares remain analytical estimates.
Top Key Players in the Market
- Nike
- Adidas
- Strava
- Peloton
- Under Armour
- Garmin
- Fitbit
- MyFitnessPal
- Zwift
- Fitocracy
- Jogo Health
- Sportle
- CoachMePlus
- Gametize
- MIRROR
Recent Developments
- In 2026, Garmin acquired TrainingPeaks and TrainHeroic in July, expanding its fitness ecosystem with endurance, strength-training, and coaching platforms. Financial terms were not disclosed. Garmin’s second-quarter 2026 Fitness revenue reached USD 756.8 million, up 25% year on year, while operating income reached USD 277 million.
- In 2025, Peloton launched Peloton IQ and the Cross Training Series in October, representing the first complete refresh of its connected-fitness product portfolio. Peloton also increased its All-Access Membership price from USD 44 to USD 49.99 per month and App+ pricing from USD 24 to USD 28.99, strengthening recurring revenue opportunities from digital coaching and engagement features.
Report Scope
| Report Features | Description |
|---|---|
| Market Value (2025) | USD 5.4 Billion |
| Forecast Revenue (2035) | USD 25.6 Billion |
| CAGR (2026-2035) | 16.9% |
| Base Year for Estimation | 2025 |
| Historic Period | 2020-2024 |
| Forecast Period | 2026-2035 |
| Report Coverage | Revenue Forecast, Market Dynamics, Competitive Landscape, Recent Developments |
| Segments Covered | By Solution (Platforms, Services); By Deployment (On-premises, Cloud-based); By Application (Fitness and Wellness, Sports Betting, Fan Engagement, Athlete Performance, Corporate Wellness, Others) |
| Regional Analysis | North America – US, Canada; Europe – Germany, France, The UK, Spain, Italy, Rest of Europe; Asia Pacific – China, Japan, South Korea, India, Australia, Singapore, Rest of APAC; Latin America – Brazil, Mexico, Rest of Latin America; Middle East & Africa – GCC, South Africa, Rest of MEA |
| Competitive Landscape | Nike, adidas, Garmin, Peloton, Under Armour, Strava, MyFitnessPal, Zwift, Fitbit, Jogo Health, Sportle, CoachMePlus, Gametize, Fitocracy, MIRROR |
| Customization Scope | Customization for segments and region/country-level will be provided. Additional customization can be done based on requirements. |
| Purchase Options | We have three licenses to opt for: Single User License, Multi-User License (Up to 5 Users), Corporate Use License (Unlimited Users and Printable PDF) |





























