


Report Overview
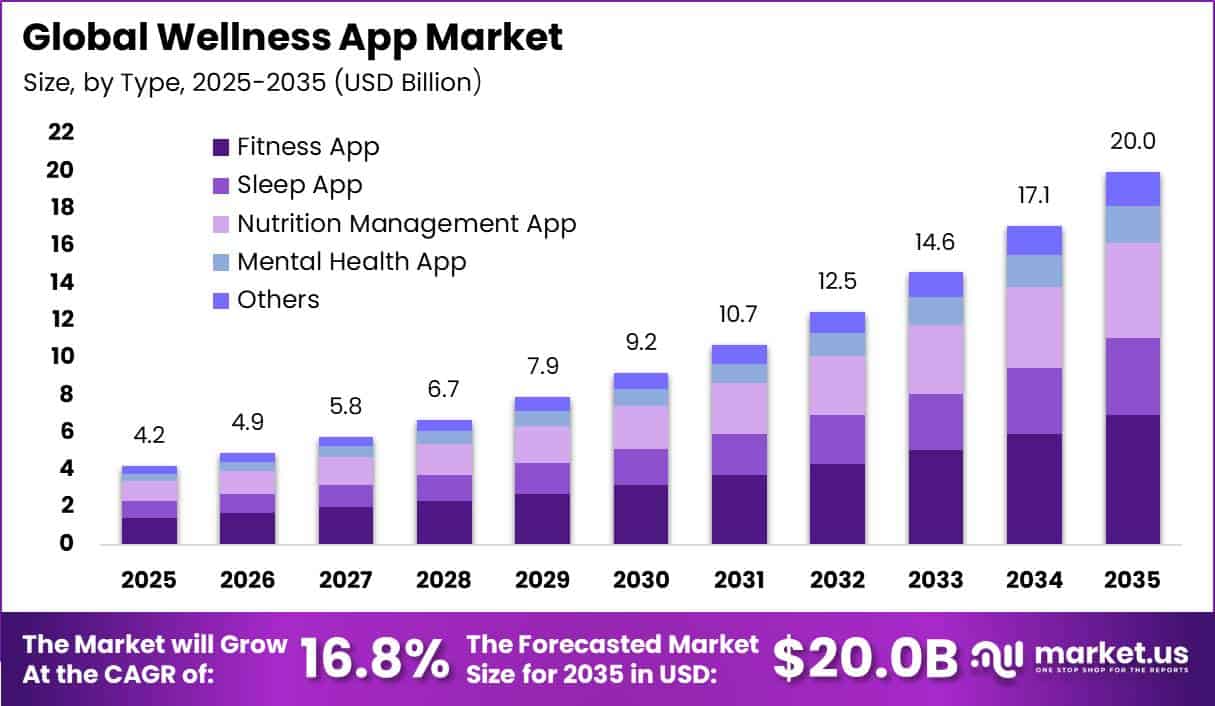
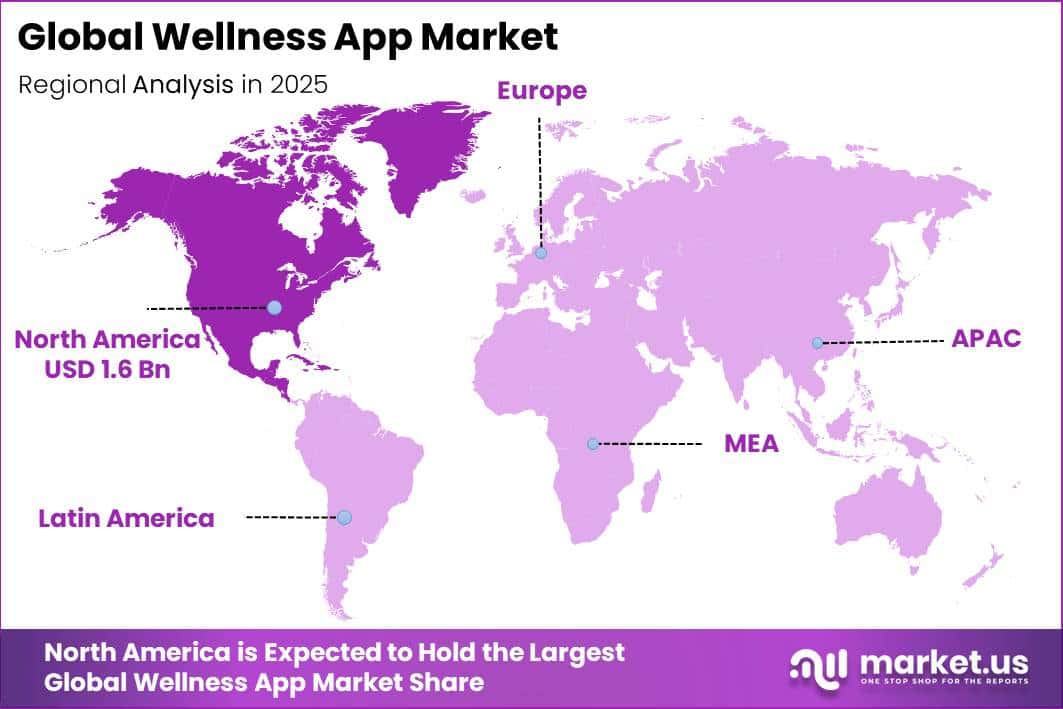
In 2025, the Global Wellness App Market was valued at USD 4.2 billion. The market is projected to grow at a CAGR of 16.8% during 2026–2035, reaching approximately USD 20.0 billion by 2035. North America dominated the global market in 2025, accounting for more than 38.1% of the total market share and generating approximately USD 1.6 billion in revenue.
Growth is supported by rising interest in preventive healthcare, daily health monitoring, and affordable self-care solutions. According to the World Health Organization, non-communicable diseases caused at least 43 million deaths in 2021, representing 75% of all non-pandemic-related deaths worldwide. Cardiovascular diseases accounted for at least 19 million deaths.
These health concerns are increasing the need for digital tools that help people manage exercise, nutrition, sleep, stress, and weight. Wellness apps support these needs through reminders, personalized plans, progress tracking, and wearable-device integration. Digital access is also expanding, with the ITU reporting 5.5 billion internet users in 2024, equal to 68% of the global population, after an increase of 227 million users within one year.
The CDC reports that 90% of the United States’ USD 5.3 trillion annual healthcare expenditure is linked to people with chronic and mental health conditions. Meanwhile, only 48.0% of U.S. adults met recommended aerobic activity levels in 2024, supporting wider adoption of fitness, nutrition, sleep, mental wellness, digital coaching, and wearable-connected wellness apps.
Key Takeaway
- The Wellness App Market was valued at USD 4.2 billion in 2025 and is projected to reach USD 20.0 billion by 2035 at a 16.8% CAGR.
- Fitness apps held the largest type-segment share at 34.7%, driven by demand for activity tracking and weight management.
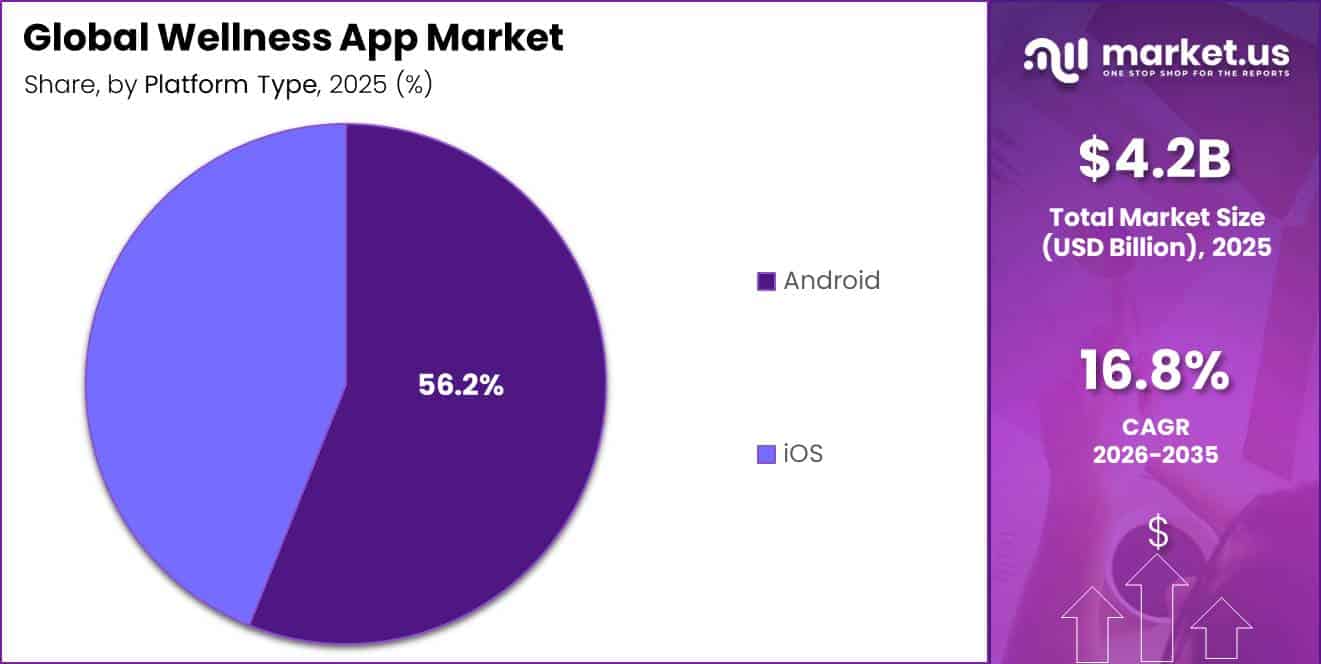
- Android dominated the platform segment with a 56.2% share, supported by its broad global device base.
- North America led the market in 2025 with a 38.1% share, generating approximately USD 1.6 billion in revenue.
By Type
Fitness apps held a leading position in the wellness app market, accounting for a 34.7% share, supported by growing demand for physical activity tracking, weight management, and regular exercise. According to the World Health Organization, 1.8 billion adults, or 31% of the global adult population, did not meet recommended physical-activity levels in 2022.
This rate increased by 5 percentage points from 2010, highlighting the growing need for tools that encourage active lifestyles. WHO recommends at least 150 minutes of moderate physical activity per week. Fitness apps help users achieve this target through workout plans, step goals, activity records, reminders, and progress tracking.
Weight-related health concerns further support adoption, as 2.5 billion adults were overweight in 2022, including 890 million people living with obesity. Fitness apps provide a convenient and low-cost way to monitor calories, exercise duration, heart rate, distance, and body-weight changes. Integration with smartwatches and fitness bands also allows users to convert activity data into practical health actions, supporting frequent engagement, paid subscriptions, and continued app usage.
By Platform Type
Android held a dominant position in the wellness app market with a 56.2% share, supported by its large global user base and strong presence across affordable smartphone categories. Google reported that Android was running on more than 3 billion active devices in 2024, giving wellness app developers broad access to users of fitness, nutrition, sleep, and mental-wellness applications.
The platform supports smartphones across different price ranges and allows developers to use free, advertising-supported, and low-cost subscription models. This is especially important in cost-sensitive markets. According to GSMA, around 4.6 billion people, representing 57% of the global population, used mobile internet on their own device in 2023.
However, entry-level internet-enabled handsets still accounted for about 18% of average monthly income in low- and middle-income countries. Android’s strong availability on lower-priced smartphones therefore helps expand wellness app access beyond premium device users. Its compatibility with mobile sensors, smartwatches, fitness bands, and health-data functions also supports step tracking, workout monitoring, calorie measurement, and personalized health alerts.
Key Market Segments
By Type
- Fitness App
- Sleep App
- Nutrition Management App
- Mental Health App
- Others
By Platform Type
- Android
- iOS
Geopolitical Impact Analysis
The wellness app market is largely software-based, so geopolitical conflicts have less direct impact on app production than on physical products. However, conflicts can increase the cost and delay the supply of smartphones, wearable sensors, batteries, displays, and network equipment that support fitness tracking, sleep monitoring, and other wellness services.
According to UN Trade and Development, Red Sea shipping disruptions increased the Shenzhen-to-Rotterdam voyage from about 31 days to 41 days. The China Containerized Freight Index also increased by 120% between October 2023 and June 2024, with the Red Sea disruption contributing 148 percentage points to the increase.
Higher freight, fuel, insurance, and inventory costs can raise prices for smartphones and wearable health devices, which may slow adoption in price-sensitive markets.
Trade fragmentation creates another challenge for the electronics supply chain. UNCTAD reported that the average effective U.S. tariff rate increased from around 2.6% in 2024 to 17.9% by September 2025. This can increase uncertainty around semiconductors, displays, printed circuit boards, and other components used in connected wellness devices.
Energy-market volatility also affects chip production, cloud infrastructure, device manufacturing, and transportation. The World Bank estimated that a conflict-related reduction of 2 million barrels per day in oil supply could increase average Brent crude prices to USD 84 per barrel in 2025, around 15% above its baseline forecast.
Regional Analysis
North America dominated the wellness app market in 2025, accounting for 38.1% of global revenue and generating approximately USD 1.6 billion. The region benefits from high consumer spending on digital health services, strong adoption of smartphones and wearable devices, and widespread use of paid fitness, meditation, sleep, and nutrition applications.
The United States remains the major revenue contributor, supported by growing demand for personalized workout plans, calorie tracking, stress-management tools, sleep monitoring, and virtual coaching. Employers and health insurers are also integrating wellness platforms into employee-benefit programs, supporting subscription revenue and enterprise contracts.
Asia Pacific is expected to record the fastest regional growth, supported by expanding smartphone ownership, wider mobile-internet access, and increasing awareness of preventive healthcare. According to GSMA, the region had around 2.6 billion mobile-internet subscribers in 2023, creating a large user base for wellness applications.
Key Regions and Countries
North America
- US
- Canada
Europe
- Germany
- France
- The UK
- Spain
- Italy
- Rest of Europe
Asia Pacific
- China
- Japan
- South Korea
- India
- Australia
- Rest of APAC
Latin America
- Brazil
- Mexico
- Rest of Latin America
Middle East & Africa
- GCC
- South Africa
- Rest of MEA
Market Dynamics
Drivers
| Driver | (~) % CAGR | Geographic Relevance | Impact Timeline |
|---|---|---|---|
| Physical-activity deficit | +2.1% | Global | Short term (2 years or less) |
| Wearable-linked tracking | +1.7% | North America, Europe, East Asia | Short term (2 years or less) |
| Employer wellbeing purchasing | +1.3% | North America, Europe | Medium term (2 to 4 years) |
| Subscription content bundles | +1.0% | Global urban markets | Short term (2 years or less) |
| Local-language app delivery | +0.8% | Asia Pacific, Latin America | Medium term (2 to 4 years) |
Physical-activity deficit
The physical-activity gap remains a strong demand driver for wellness apps because it creates a regular need for measurable health tracking. WHO reported that around 1.8 billion adults, or 31% of adults globally, did not meet recommended activity levels in 2022. Physical inactivity also increased by about 5 percentage points between 2010 and 2022.
WHO recommends at least 150 minutes of moderate physical activity per week for adults, while only 48.0% of U.S. adults met the aerobic guideline in 2024. This gap supports continued use of workout plans, reminders, nutrition logs, and progress dashboards, while encouraging subscription, digital coaching, and employer-based wellness models.
Restraints
| Restraint | (~) % CAGR | Geographic Relevance | Impact Timeline |
|---|---|---|---|
| Health-data compliance costs | -1.8% | Europe, North America | Short term (2 years or less) |
| Consumer subscription pressure | -1.2% | Global | Short term (2 years or less) |
| Clinical-claim restrictions | -0.9% | United States, Europe | Medium term (2 to 4 years) |
| App-store fee exposure | -0.7% | Global | Short term (2 years or less) |
| Reimbursement limits | -0.6% | North America, Europe | Medium term (2 to 4 years) |
Health-data compliance costs
Health-data compliance is an immediate restraint for wellness app providers because it increases the cost and time required to launch and manage platforms handling sensitive information. The European Health Data Space Regulation entered into force on 26 March 2025, with initial primary-use and electronic health record requirements applying from 26 March 2029 and additional data categories from 26 March 2031.
The EU Data Act became applicable on 12 September 2025, increasing requirements for secure and interoperable wearable-data handling. In the U.S., the FDA issued final cybersecurity guidance on 27 June 2025 and final general-wellness guidance on 6 January 2026. These rules increase spending on legal compliance, cybersecurity, quality assurance, and documentation, which can pressure margins and delay higher-risk wellness features.
Challenges
| Challenge | (~) % CAGR | Geographic Relevance | Mitigation Horizon |
|---|---|---|---|
| Data interoperability gaps | -1.5% | Global | Long term (4 years or more) |
| User retention volatility | -1.2% | Global | Short term (2 years or less) |
| Algorithm validation burden | -1.0% | North America, Europe | Medium term (2 to 4 years) |
| Wearable ecosystem fragmentation | -0.8% | Global | Medium term (2 to 4 years) |
| Digital-skills inequality | -0.7% | Emerging markets | Long term (4 years or more) |
Data interoperability gaps
Data interoperability remains a major challenge for wellness apps because platforms must combine activity, sleep, nutrition, clinical, and wearable data across different devices and software systems. Under the European Health Data Space, patient summaries and e-prescriptions are expected to become exchangeable across EU Member States by 2029, followed by medical images, laboratory results, and hospital-discharge reports by 2031.
The EHDS entered into force in 2025 but will be applied in stages, creating a long transition period for providers. WHO also reported that 31% of adults were insufficiently active in 2022, increasing the need for reliable health data and accurate recommendations. As a result, app providers must continue investing in APIs, consent management, data standardisation, and cybersecurity, which can raise development costs and slow international feature launches.
Opportunities
| Opportunity | (~) % CAGR | Geographic Relevance | Execution Window |
|---|---|---|---|
| Regulated care integration | +2.0% | Europe, North America | Long term (4 years or more) |
| Outcome-based employer contracts | +1.5% | North America, Europe | Medium term (2 to 4 years) |
| Women’s health specialisation | +1.2% | Global | Medium term (2 to 4 years) |
| Emerging-market micropricing | +1.0% | Asia Pacific, Africa, Latin America | Medium term (2 to 4 years) |
| AI health navigation | +0.9% | Global | Short term (2 years or less) |
Regulated care integration
Regulated care integration remains a future growth opportunity, as Europe’s health-data framework is still being introduced. Under the European Health Data Space, key primary-use and electronic health record rules will apply from 26 March 2029, with additional priority data categories following from 26 March 2031. The framework is expected to support secure exchange of patient summaries and electronic prescriptions across EU Member States.
The European Commission’s Data Act became applicable on 12 September 2025, strengthening consumer control over connected-device data. In the U.S., the FDA issued its final general-wellness policy on 6 January 2026, clarifying requirements for lower-risk wellness products. Companies investing ahead of these milestones may expand from consumer subscriptions into care navigation, referrals, and clinician partnerships, supporting higher-value recurring revenue.
Key Players Analysis
Tier-1 competition in the wellness app market is led by Apple Health, Google Fit/Fitbit, Samsung Health, Nike Training Club, and Peloton, mainly because these companies control large device ecosystems, app distribution channels, health-data access, and recurring digital content. Apple reported USD 416.2 billion in FY2025 revenue and USD 34.6 billion in R&D spending, equal to 8% of sales.
Alphabet generated USD 402.8 billion in 2025 revenue, including USD 314.7 billion from Google Services and USD 54.7 billion from Google Cloud, while R&D spending reached USD 61.1 billion. These resources support large-scale Android distribution, cloud infrastructure, AI development, and wearable integration.
Peloton represents a more directly monetized wellness platform. In FY2025, the company generated USD 2.4 billion in total revenue, including USD 1.7 billion from subscriptions and USD 790.8 million from connected-fitness products. Its R&D spending reached USD 234.2 million, while its platform served around 5.5 million members.
Tier-2 players such as MyFitnessPal, Headspace, Calm, Noom, Strava, Lifesum, BetterMe, Asana Rebel, and Clue compete through focused subscriptions, coaching, nutrition, mindfulness, women’s health, and social-fitness features. Most are privately held, so individual market-share estimates are not financially reliable.
Top Key Players in the Market
- MyFitnessPal
- Headspace
- Calm
- Fitbit
- Noom
- Strava
- Nike Training Club
- Apple Health
- Google Fit
- Peloton
- Lifesum
- Samsung Health
- BetterMe
- Asana Rebel
- Clue
Recent Developments
- In 2025, Samsung Health partnered with iFIT to expand premium fitness content within its wellness platform. The November integration introduced expert-led workouts across seven categories, including HIIT, Pilates, yoga, strength, recovery, barre, and mindfulness. Premium access was priced at USD 9.9 per month or USD 99.9 per year, strengthening Samsung Health’s subscription-based fitness offering.
- In 2025, Headspace expanded its direct-to-consumer mental health services by launching insurance-covered therapy access in June. The company stated that the service could reach around 90 million Americans nationwide, significantly widening access beyond its traditional meditation and self-guided wellness content. The development strengthened Headspace’s position across consumer, employer, insurer, and clinical mental-health channels.
Report Scope
| Report Features | Description |
|---|---|
| Market Value (2025) | USD 4.2 Billion |
| Forecast Revenue (2035) | USD 20.0 Billion |
| CAGR (2026-2035) | 16.8% |
| Base Year for Estimation | 2025 |
| Historic Period | 2020-2024 |
| Forecast Period | 2026-2035 |
| Report Coverage | Revenue Forecast, Market Dynamics, Competitive Landscape, Recent Developments |
| Segments Covered | By Type – (Fitness App, Sleep App, Nutrition Management App, Mental Health App, Others); By Platform Type – (Android, iOS) |
| Regional Analysis | North America – US, Canada; Europe – Germany, France, The UK, Spain, Italy, Rest of Europe; Asia Pacific – China, Japan, South Korea, India, Australia, Singapore, Rest of APAC; Latin America – Brazil, Mexico, Rest of Latin America; Middle East & Africa – GCC, South Africa, Rest of MEA |
| Competitive Landscape | MyFitnessPal, Headspace, Calm, Fitbit, Noom, Strava, Nike Training Club, Apple Health, Google Fit, Peloton, Lifesum, Samsung Health, BetterMe, Asana Rebel, Clue |
| Customization Scope | Customization for segments and region/country-level will be provided. Moreover, additional customization can be done based on the requirements. |
| Purchase Options | We have three licenses to opt for: Single User License, Multi-User License (Up to 5 Users), Corporate Use License (Unlimited Users and Printable PDF) |





























