


Report Overview
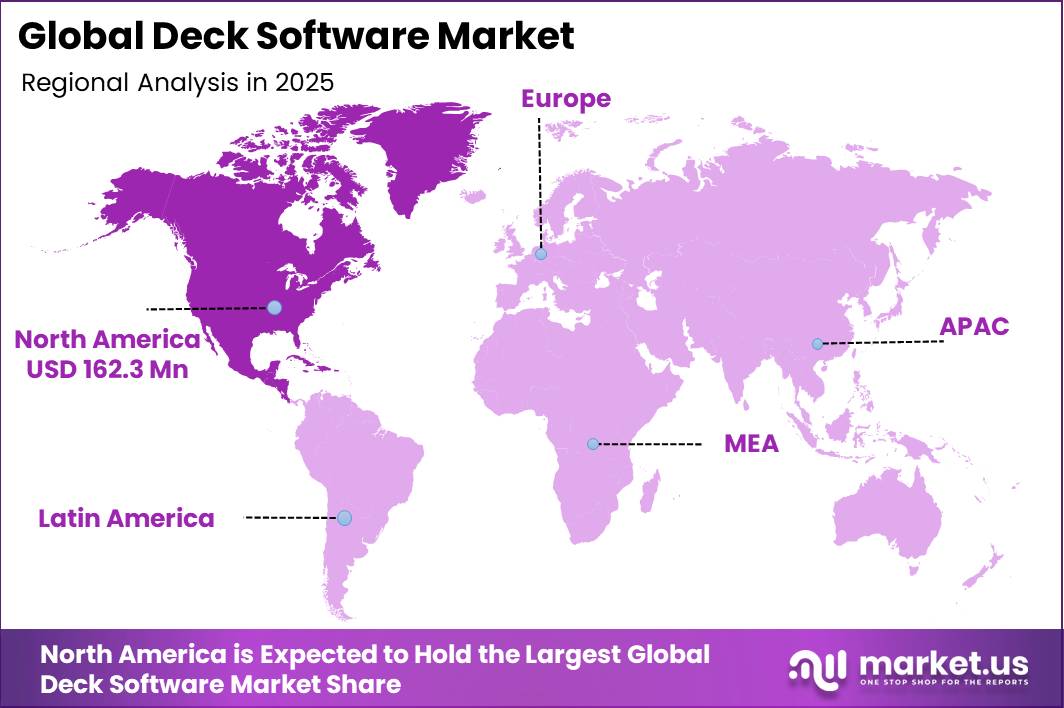
In 2025, the Global Deck Software Market was valued at USD 373.0 million. The market is projected to grow at a CAGR of 12.1% during 2026–2035, reaching approximately USD 1,168.7 million by 2035. North America dominated the global market in 2025, accounting for more than 43.5% of the total market share and generating approximately USD 162.3 million in revenue.
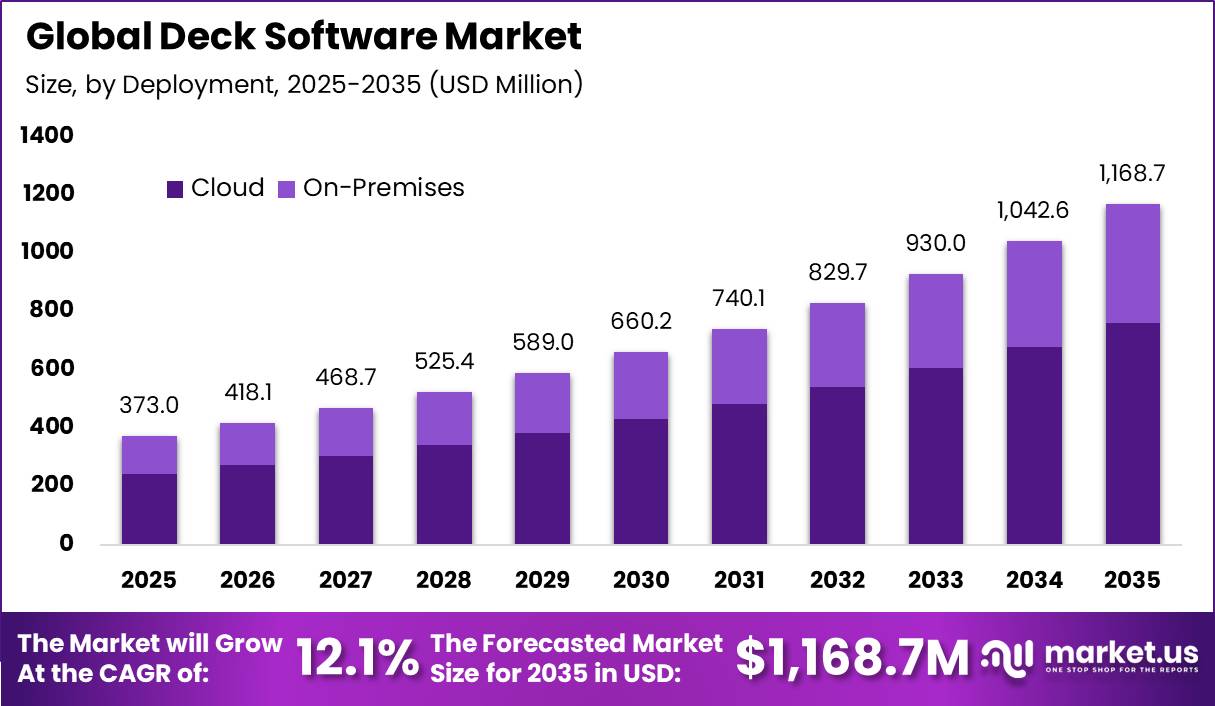
This growth is strongly supported by rising construction and home renovation activity. In the United States, construction spending reached a seasonally adjusted annual rate of USD 2,136.2 billion in mid-2025, including USD 883.1 billion in residential construction. During 2025, around 1,425,200 housing units were authorized through building permits, while 1,497,800 housing units were completed.
Growing residential activity increases the need for digital tools that help contractors and homeowners design decks, estimate project costs, calculate material requirements, and prepare accurate layouts before construction begins. As outdoor living spaces become an important part of residential improvement projects, the use of deck design and planning software is expected to rise steadily through 2035.
In 2025, the United States recorded more than 1.3 million new housing starts, while private residential construction spending exceeded USD 880 billion annually. This large volume of new and existing homes creates steady demand for deck construction, replacement, and renovation projects.
Key Takeaway
- The Deck Software Market was valued at USD 373.0 million in 2025 and is projected to reach USD 1,168.7 million by 2035, at a CAGR of 12.1%.
- Cloud deployment held a dominant 65.2% share of the market.
- The commercial application segment held a dominant 54.7% share.
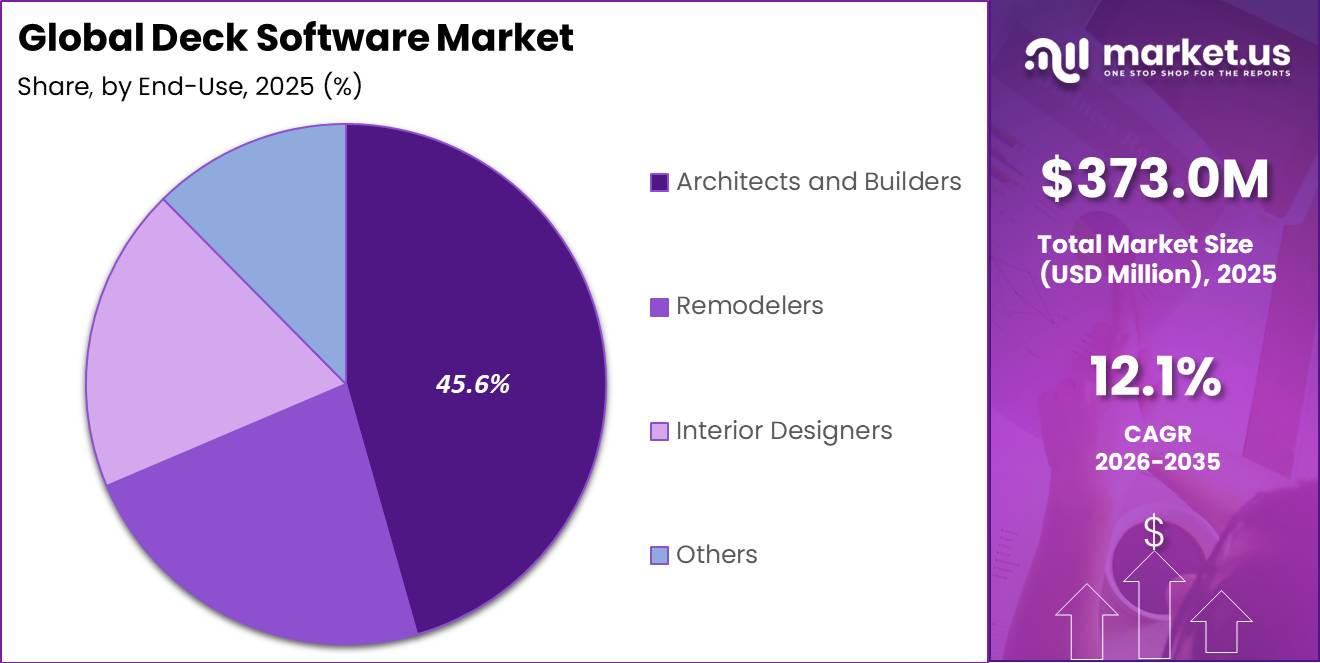
- Architects and builders held a dominant 45.6% share of the end-use segment.
- North America led the market in 2025 with a 43.5% share, generating approximately USD 162.3 million in revenue.
Market Statistics and Data Insights
- U.S. construction spending reached USD 2,136.2 billion at a seasonally adjusted annual rate in June 2025. Private residential construction alone accounted for USD 883.1 billion, while private non-residential construction reached USD 738.8 billion. This provides a large project base for design, visualization, estimating, and material-planning software.
- U.S. building authorities issued permits for 1,431,616 privately owned housing units in 2025, with a total construction valuation of USD 378.99 billion. Although permits declined 3.1% from 2024, the project volume remains substantial for residential design software users.
- An estimated 1,497,800 U.S. housing units were completed in 2025. This included more than 1 million new single-family homes, creating a continuing base for deck additions, outdoor-space planning, and contractor estimating.
- Deck-related outdoor features are already standard in U.S. new housing. Of 1,005,000 single-family homes completed in 2025, 921,000 had a deck, porch, or patio. Among 678,000 new single-family homes sold, 630,000 included at least one of these outdoor features.
- In the U.S. Northeast, 24% of newly completed owner-built homes had a porch only, 11% had a deck only, and 4% included both a patio and deck in 2025. This shows that deck-specific planning remains a measurable part of new-home design.
- Canada recorded an 8.5% increase in total building-construction investment in 2025, reaching CAD 272.1 billion. Residential investment reached CAD 178.0 billion, including CAD 98.4 billion in multi-unit construction and CAD 79.6 billion in single-family construction.
- Australia recorded AUD 22.86 billion of new residential building work in the September quarter of 2025, up 8.2% year over year. Residential alterations and additions reached AUD 3.74 billion, increasing 8.0%. Renovation activity is particularly relevant to deck redesign and extension software.
- Houzz’s survey of 1,537 U.S. residential renovation businesses found that 84% of architects, 57% of design-build firms, and 51% of landscaping and outdoor-service businesses used drafting or rendering software. In addition, 37% of specialty contractors and 33% of general contractors used software for estimating costs or bids.
- The same Houzz survey found that 42% of specialty contractors, 40% of architects, and 40% of design-build firms invested in improving efficiency and productivity. This supports demand for software that reduces estimating and design time.
- NADRA estimates that the United States has more than 60 million decks, including approximately 50 million residential and 10 million commercial decks. About 30 million are estimated to be past their useful life and require repair or replacement. This creates a major opportunity for redecking, inspection, renovation, and redesign software modules.
- A 2026 NADRA survey of 37 professional deck builders found that 49% had five employees or fewer, yet 44% built 51 or more decks per year. This supports demand for software designed for small teams managing high project volumes.
- Professional involvement in outdoor renovations increased to 71% of homeowners in 2026, up from 65% in 2024. General contractors were hired by 17%, landscape contractors by 26%, and landscape architects/designers by 15%. This shift increases the professional user base for digital deck design and customer-presentation tools.
By Deployment
Cloud Deployment held a dominant 65.2% share of the Deck Software Market, supported by the growing need for faster coordination among sales teams, designers, estimators, installers, suppliers, and customers. In 2025, 52.74% of EU enterprises with at least 10 employees used paid cloud services, increasing by 7.42 percentage points from 2023.
Around 47% of enterprises also used advanced cloud services, including accounting, CRM, database hosting, security software, and application development platforms. This broader shift toward cloud technology supports the adoption of cloud-based deck software, which allows users to manage project drawings, 3D models, material lists, pricing updates, and customer approvals through a single online platform.
Cloud systems also help field teams update deck designs during site visits while office staff can quickly revise estimates and purchasing details. In addition, 42% of EU construction businesses used advanced or intermediate cloud services in 2025, showing growing digital readiness among contractors.
By Application
The Commercial Application segment held a dominant 54.7% share of the Deck Software Market, supported by strong demand for professionally designed outdoor spaces across hotels, restaurants, retail properties, offices, event venues, and multi-unit buildings. In June 2025, U.S. private non-residential construction spending reached an annualized USD 738.8 billion.
This included USD 104.1 billion for office construction, USD 119.1 billion for commercial buildings, and USD 23.6 billion for lodging facilities. These projects often include rooftop decks, outdoor dining areas, pool surrounds, walkways, entry platforms, and seating spaces.
By End-Use
Architects and Builders held a dominant 45.6% share of the Deck Software Market, supported by their key role in project design, planning, costing, and construction. In 2025, the number of licensed architects in the United States increased by 6% to 123,398 professionals, while 146,322 reciprocal licenses allowed architects to work across different states.
The U.S. construction and extraction workforce also included 6.43 million workers in May 2025, including 812,210 first-line supervisors responsible for managing daily construction activities. This large professional workforce creates strong demand for software that can prepare accurate layouts, calculate material requirements, verify dimensions, and produce 3D project designs.
Key Market Segments
By Deployment
- Cloud
- On-Premises
By Application
- Residential
- Commercial
By End-Use
- Architects and Builders
- Remodelers
- Interior Designers
- Others
Geopolitical Impact Analysis
Geopolitical risks are increasing cost and supply uncertainty across the Deck Software Market by affecting imported hardware, cloud infrastructure, and deck-material supply chains. UNCTAD reported that Red Sea shipping diversions increased the China Containerized Freight Index by about 120% between October 2023 and June 2024.
During the same period, Shanghai–South Africa container rates increased 199.6% to USD 5,426 per TEU, while Shanghai–West Africa rates rose 137%. A 20,000–24,000 TEU vessel rerouted from the Far East to Europe around the Cape of Good Hope also faced an estimated additional USD 0.4 million per voyage in carbon-related costs.
Energy-market disruption is creating additional pressure. The International Energy Agency reported that Middle East conflict and tanker restrictions through the Strait of Hormuz reduced global oil supply by 10.1 million barrels per day to 97 million barrels per day in March 2026, while North Sea Dated crude increased by USD 55 per barrel during the month.
The IEA later projected global oil supply to decline by 3.9 million barrels per day to 102.4 million barrels per day in 2026. Higher fuel and energy costs can increase material production, transportation, and installation expenses. While these pressures may delay some discretionary deck projects, they also strengthen demand for deck software that supports cost control, material optimization, design revisions, and delivery planning.
Regional Analysis
North America held a dominant 43.5% share of the global Deck Software Market in 2025, generating approximately USD 162.3 million in revenue. The region benefits from a well-developed contractor network, strong adoption of digital design tools, and high spending on residential and commercial outdoor construction.
The United States remains the major revenue contributor due to its large housing stock and active home-improvement market. According to the 2023 American Housing Survey, 123.8 million occupied housing units in the United States had a porch, deck, balcony, or patio.
Canada also supports regional growth through strong construction investment. Total building-construction investment increased 8.5% in 2025 to CAD 272.1 billion, while residential investment reached CAD 178.0 billion. Multi-unit residential construction accounted for CAD 98.4 billion, while single-family construction reached CAD 79.6 billion. These investments create steady demand for digital design and quoting tools among builders, architects, dealers, and installers.
Asia Pacific is expected to be the fastest-growing regional market, supported by urban development, rising housing demand, commercial construction, and growing cloud-software adoption. Australia, Japan, China, India, and Southeast Asia are seeing wider use of digital visualization and cost-estimation tools as contractors move away from manual planning and adopt more efficient digital workflows.
Key Regions and Countries
- North America
- US
- Canada
- Europe
- Germany
- France
- The UK
- Spain
- Italy
- Rest of Europe
- Asia Pacific
- China
- Japan
- South Korea
- India
- Australia
- Rest of APAC
- Latin America
- Brazil
- Mexico
- Rest of Latin America
- Middle East & Africa
- GCC
- South Africa
- Rest of MEA
Market Dynamics
Drivers
| Driver | (~) % CAGR | Geographic Relevance | Impact Timeline |
|---|---|---|---|
| Residential improvement demand | +2.1% | North America | Short term (2 years or less) |
| Cloud workflow adoption | +1.7% | North America and Europe | Short term (2 years or less) |
| Commercial outdoor upgrades | +1.3% | North America and Asia Pacific | Medium term (2 to 4 years) |
| Digital material estimation | +1.1% | Global | Short term (2 years or less) |
| Builder visualization demand | +0.9% | North America and Europe | Medium term (2 to 4 years) |
Residential improvement demand
Residential improvement activity is the largest active demand driver because decks are commonly funded through renovation budgets rather than only through new-home construction. U.S. Census Bureau data placed private residential construction at an annualized USD 892.8 billion in April 2025, including spending on private residential improvements.
The Census Bureau’s American Housing Survey recorded 123.8 million occupied U.S. housing units with a porch, deck, balcony, or patio in 2023, creating a large installed base for repair, replacement, extension, and redesign. Statistics Canada reported total building-construction investment of CAD 24.5 billion in November 2025, including CAD 17.6 billion in residential construction.
Restraints
| Restraint | (~) % CAGR | Geographic Relevance | Impact Timeline |
|---|---|---|---|
| Small contractor budget limits | -1.8% | Global | Short term (2 years or less) |
| Discretionary project deferrals | -1.4% | North America and Europe | Short term (2 years or less) |
| Fragmented permitting requirements | -1.1% | North America | Medium term (2 to 4 years) |
| Legacy desktop dependence | -0.9% | North America and Europe | Medium term (2 to 4 years) |
| Low software renewal rates | -0.7% | Asia Pacific and Latin America | Medium term (2 to 4 years) |
Small contractor budget limits
Budget constraints among small contractors remain the most immediate barrier because deck-design software competes directly with tools, labour, insurance, vehicles, material deposits, and working-capital needs.
The U.S. Bureau of Labor Statistics recorded 305,000 construction job openings in July 2025, while construction hires totalled 333,000; labour scarcity raises payroll costs and leaves less cash for non-essential technology purchases.
The U.S. Census Bureau reported private construction spending declined 0.7% month-on-month in April 2025, reflecting a softer near-term spending environment. The World Bank projected global commodity prices to decline by about 12% in 2025, but this relief does not immediately remove financing and cash-flow pressures for small builders.
Challenges
| Challenge | (~) % CAGR | Geographic Relevance | Mitigation Horizon |
|---|---|---|---|
| Material data volatility | -1.5% | Global | Short term (2 years or less) |
| Interoperability gaps | -1.2% | Global | Medium term (2 to 4 years) |
| Cybersecurity compliance burden | -1.0% | North America and Europe | Medium term (2 to 4 years) |
| Field connectivity limits | -0.8% | Asia Pacific and rural markets | Medium term (2 to 4 years) |
| Skilled user training | -0.6% | Global | Long term (4 years or more) |
Material data volatility
Material-data volatility is the main operational challenge because accurate deck estimates require frequent changes to board prices, freight charges, fastener costs, supplier availability, and delivery dates.
UNCTAD reported that the Shanghai–South Africa container freight rate increased 199.6% from January to July 2024, reaching USD 5,426 per TEU, while the Shanghai–West Africa rate rose 137% over the same period.
The International Energy Agency reported global oil supply fell by 10.1 million barrels per day to 97 million barrels per day in March 2026 amid Middle East disruption and restrictions affecting tanker movements. The World Bank forecast a 24% year-on-year rise in its energy price index during 2026.
Opportunities
| Opportunity | (~) % CAGR | Geographic Relevance | Execution Window |
|---|---|---|---|
| Dealer-integrated material marketplaces | +2.3% | North America and Europe | Medium term (2 to 4 years) |
| AI-assisted deck configuration | +1.9% | Global | Medium term (2 to 4 years) |
| Permit automation modules | +1.5% | North America | Medium term (2 to 4 years) |
| Property manager subscriptions | +1.2% | North America, Europe and Asia Pacific | Long term (4 years or more) |
| Manufacturer software partnerships | +1.0% | Global | Short term (2 years or less) |
Dealer-integrated material marketplaces
Dealer-integrated material marketplaces are an untapped opportunity because most deck platforms still stop at design and quotation rather than converting approved layouts into live supplier orders.
The U.S. Census Bureau reported 1,497,800 housing completions in 2025, while the U.S. Department of Housing and Urban Development and Census Bureau recorded 1,425,200 permitted housing units during the same year, creating a large potential flow of material-selection and contractor-order transactions.
Eurostat reported that 52.74% of EU enterprises used paid cloud services in 2025, and 47% used intermediate or sophisticated cloud services, showing that the digital base for supplier-connected transactions is already established.
A platform that captures a modest 1% to 3% transaction fee on material orders can add high-margin recurring revenue beyond subscriptions, reduce contractor ordering time, and improve customer retention through integrated design-to-purchase workflows.
Key Players Analysis
The Deck Software Market remains fragmented, with specialist vendors focusing on deck-specific design workflows, while larger construction and design software companies compete through broader digital platforms. Tier-1 companies include Autodesk, Trimble, Dassault Systèmes, Trex, AZEK, Simpson Strong-Tie, and Deckorators.
These companies benefit from strong contractor networks, established software ecosystems, and the ability to combine deck planning with CAD, visualization, estimating, materials, and construction tools. Autodesk generated USD 7.21 billion in fiscal 2026 revenue, increasing 18%, while research and development spending reached USD 1.48 billion, equal to about 20.6% of revenue. Around 97% of its sales were recurring.
Trimble reported USD 3.58 billion in 2025 revenue and USD 2.39 billion in annualized recurring revenue, while R&D spending reached USD 630.7 million, representing 17.6% of revenue. However, these companies do not separately disclose deck-software revenue, limiting accurate market-share comparisons.
Trex, AZEK, Deckorators, MoistureShield, and Simpson Strong-Tie also benefit from their ability to connect deck-design tools with product catalogues and contractor networks. Trex reported 2025 net sales of USD 1,174.3 million, increasing by USD 22.8 million, or 2.0%, from 2024.
Tier-2 companies, including Chief Architect, Idea Spectrum, RoomSketcher, SmartDraw, Cedreo, Delta Software International, and Drafix, compete through easier interfaces, residential visualization, lower costs, and focused customer solutions. Future competition is expected to center on cloud access, live material pricing, supplier integration, permit-ready plans, and faster design-to-quote workflows.
Top Key Players in the Market
- Autodesk Inc.
- Delta Software International LLC.
- Chief Architect, Inc.
- Dassault Systemes
- Deckorators, Inc.
- Drafix Software, Inc.
- Trimble Inc.
- Idea Spectrum, Inc.
- MoistureShield
- RoomSketcher AS
- Simpson Strong-Tie Company, Inc.
- SmartDraw, LLC
- Cedreo
- Trex Company, Inc.
- The AZEK Company Inc.
Recent Developments
- In 2026, Trimble completed the acquisition of Document Crunch on April 4 for USD 246.4 million, acquiring 100% of the company. Document Crunch provides construction-focused AI for document analysis, compliance, and project-risk management.
- In 2025, James Hardie completed its acquisition of AZEK on July 1 in a cash-and-stock transaction with an implied value of USD 8.4 billion. AZEK shareholders received USD 26.45 in cash plus 1.0340 James Hardie shares for each AZEK share, representing USD 54.18 per share at closing.
Report Scope
| Report Features | Description |
|---|---|
| Market Value (2025) | USD 373.0 million |
| Forecast Revenue (2035) | USD 1,168.7 million |
| CAGR (2026-2035) | 12.1% |
| Base Year for Estimation | 2025 |
| Historic Period | 2020-2024 |
| Forecast Period | 2026-2035 |
| Report Coverage | Revenue Forecast, Market Dynamics, Competitive Landscape, Recent Developments |
| Segments Covered | By Deployment – (Cloud, On-Premises); By Application – (Residential, Commercial); By End-Use – (Architects and Builders, Remodelers, Interior Designers, Others) |
| Regional Analysis | North America – US, Canada; Europe – Germany, France, The UK, Spain, Italy, Rest of Europe; Asia Pacific – China, Japan, South Korea, India, Australia, Singapore, Rest of APAC; Latin America – Brazil, Mexico, Rest of Latin America; Middle East & Africa – GCC, South Africa, Rest of MEA |
| Competitive Landscape | Autodesk Inc., Trimble Inc., Dassault Systemes, Trex Company Inc., The AZEK Company Inc., Simpson Strong-Tie Company Inc., Deckorators Inc., Chief Architect Inc., Idea Spectrum Inc., RoomSketcher AS, SmartDraw LLC, Cedreo, Delta Software International LLC., Drafix Software Inc., MoistureShield |
| Customization Scope | Customization for segments, region/country-level will be provided. Moreover, additional customization can be done based on the requirements. |
| Purchase Options | We have three licenses to opt for: Single User License, Multi-User License (Up to 5 Users), Corporate Use License (Unlimited Users and Printable PDF) |





























