


Report Overview
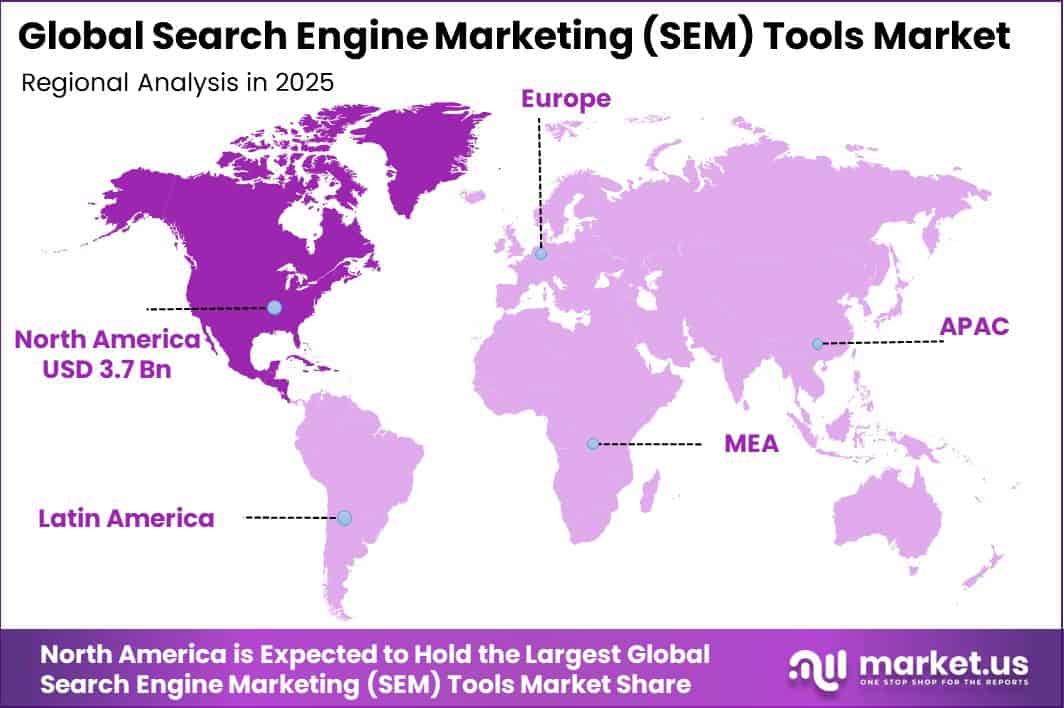
In 2025, the Global Search Engine Marketing (SEM) Tools Market was valued at USD 9.5 billion. The market is projected to grow at a CAGR of 15.6% during 2026–2035, reaching approximately USD 40.4 billion by 2035. North America dominated the global market in 2025, accounting for more than 38.4% of the total market share and generating approximately USD 3.7 billion in revenue.
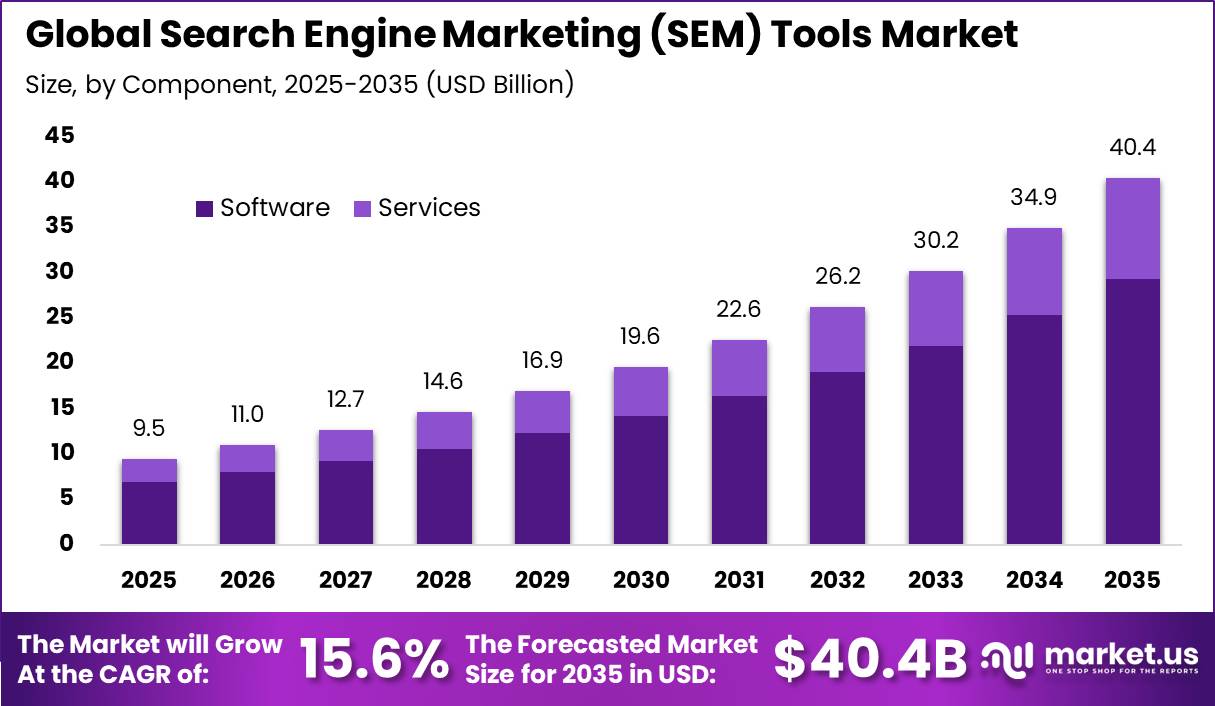
Market growth is supported by the rapid shift of businesses toward online channels, where companies increasingly rely on paid search campaigns, keyword tracking, bid management, competitor analysis, and advertising performance measurement. According to the Interactive Advertising Bureau (IAB), U.S. digital advertising revenue reached nearly USD 300 billion in 2025.
Search advertising remained the largest category, generating USD 114.2 billion, accounting for 38.8% of total digital advertising revenue, after increasing 11.0% from 2024. This large advertising base is increasing demand for SEM tools that automate campaign management, control budgets, monitor keywords, and connect advertising spending with leads and revenue.
The expansion of e-commerce is also strengthening market demand. U.S. Census Bureau data showed retail e-commerce sales of USD 317.9 billion in the fourth quarter of 2025, representing 16.7% of total U.S. retail sales. Online retailers increasingly use SEM platforms to find profitable keywords, reduce wasted clicks, improve ad quality, and measure conversions.
Key Takeaway
- SEM Tools Market was valued at USD 9.5 billion in 2025, projected to reach USD 40.4 billion by 2035 at a CAGR of 15.6%.
- Software was the dominant component segment, capturing 72.6% of total market share in 2025.
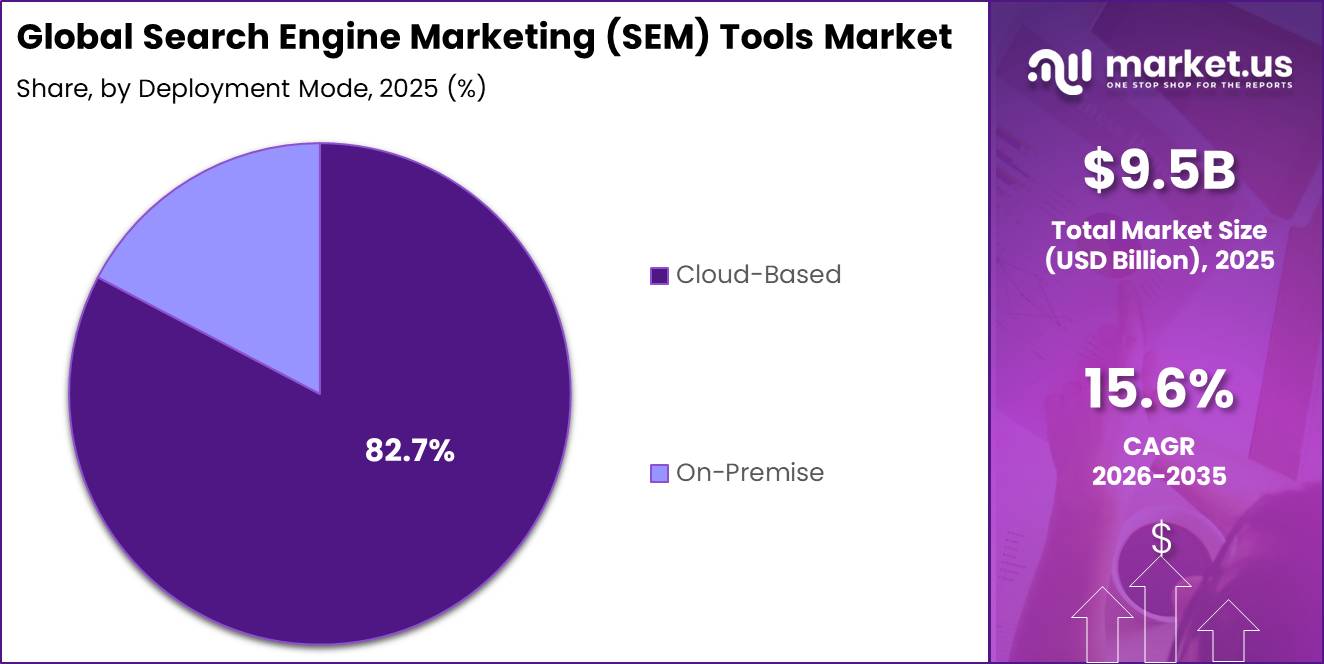
- Cloud-Based deployment led with an 82.7% share, driven by demand for continuous, collaborative access to campaign data.
- Large Enterprises accounted for 58.6% of the market, reflecting the need for centralized, multi-market SEM platforms.
- Retail and E-Commerce was the leading end-use industry, holding 26.2% of market share.
- North America led the market with 38.4% share (approximately USD 3.7 billion) in 2025.
Market Statistics and Data Insights
- In 2025, around 6.0 billion people, equal to 74% of the global population, were using the internet. The online population increased by more than 240 million people during the year, while 2.2 billion people remained offline.
- Google reported that campaigns using Smart Bidding Exploration generated an average 18% increase in unique search-query categories producing conversions and a 19% increase in conversions. The data covered global campaigns.
- U.S. retail e-commerce sales reached USD 1.2337 trillion in 2025, increasing 5.4% from 2024. E-commerce represented 16.4% of total retail sales, compared with 16.1% in 2024.
- U.S. retail e-commerce sales increased 12.4% year over year in Q2 2026, while total retail sales grew 6.6%. E-commerce accounted for 16.4% of total retail sales during the quarter.
- In 2025, 52.7% of EU enterprises used paid cloud computing services, increasing 7.4 percentage points from 2023 and up from 17.8% in 2014.
- Among EU enterprises using paid cloud services in 2025, 85.15% used cloud email, 71.69% used office software, 71.53% used file storage, 58.16% used financial or accounting applications, and 45.52% hosted enterprise databases in the cloud. Around 30.12% used ERP applications, and 27.91% used CRM applications.
- In 2025, 78% of EU internet users bought or ordered goods or services online, compared with 62% in 2015. Online purchasing reached 84% among people aged 16–24, 81% among those aged 25–64, and 55% among users aged 65–74.
- In 2025, 24% of EU businesses reported conducting e-sales. Around 21% used websites or apps to sell goods or services, while 9% sold through e-commerce marketplaces. The share of large businesses conducting e-sales reached 48%, compared with 23% among SMEs.
- Google reported that Performance Max was used by more than 1 million advertisers by April 2025. During 2024, Google introduced more than 90 quality improvements to Performance Max, which collectively increased conversions and conversion value by more than 10% for advertisers.
- Google reported in 2026 that Search campaigns using Smart Bidding Exploration generated an average of 27% more unique converting users. The company also stated that it made more than 20 improvements to Search and Shopping bidding strategies between January 2025 and March 2026.
- Microsoft reported that search and news advertising revenue excluding traffic-acquisition costs increased 20% in fiscal 2025. During the same year, Azure and other cloud-services revenue increased 34%, while Dynamics 365 revenue increased 19%. These results show the increasing scale of digital advertising and cloud infrastructure supporting SEM platforms.
By Component
In 2025, the Software segment held a dominant position in the SEM tools market, capturing 72.6% of the total market share. According to the International Telecommunication Union (ITU), around 6 billion people, or 74% of the global population, were online in 2025, an increase of more than 240 million users in just one year.
This rising internet population creates more search queries and increases the need for software that can track keywords, manage bids, control advertising budgets, test ads, and measure conversions in real time. The business impact of search-based software is also significant. Google reported that its Search, advertising, and related tools supported around USD 947 billion in economic activity for millions of U.S. businesses in 2025.
More than 19.5 million businesses also received customer connections through Google tools during the year. SEM software helps advertisers respond quickly to changes in search demand, competitor bidding, and customer behavior. While services support planning and campaign execution, software provides the scalable technology used daily for automation, reporting, lead tracking, and performance optimization.
By Deployment Mode
In 2025, the Cloud-Based segment held a dominant position in the SEM tools market, capturing 82.7% of the total market share. Its strong position is supported by the need for continuous access to live campaign data, faster processing, and easier collaboration between marketing, sales, finance, and agency teams.
Cloud platforms allow users to access SEM tools through a browser without installing or maintaining local servers, which helps reduce upfront IT costs and makes it easier to add users, campaigns, storage, and computing capacity. According to Eurostat, 52.7% of EU enterprises used paid cloud services in 2025, increasing by 7.4 percentage points from 2023. Adoption was even higher among large enterprises, where 84.7% used paid cloud services.
Cloud deployment also fits the technical needs of SEM platforms, which must process keyword, advertising, and conversion data continuously. It supports real-time reporting, automated bid changes, AI-based recommendations, software updates, and security patches from a central system. Eurostat also reported that 40.9% of EU enterprises used at least one sophisticated cloud service.
By Enterprise Size
In 2025, the Large Enterprises segment held a dominant position in the SEM tools market, capturing 58.6% of the total market share. Large companies manage broader product portfolios, more customer groups, multiple countries, and higher advertising budgets, which increases the need for centralized SEM platforms. According to UN Trade and Development (UNCTAD), business e-commerce sales across 45 economies reached USD 28 trillion in 2024.
Eurostat reported that 84.67% of EU large enterprises used paid cloud services in 2025, compared with 52.74% of enterprises with at least 10 employees. Cloud-based SEM platforms allow large companies to give shared access to internal teams and external agencies, apply approval controls, manage user roles, combine campaign data, and identify weak-performing keywords quickly.
By End-Use Industry
In 2025, the Retail and E-Commerce segment held a dominant position in the SEM tools market, capturing 26.2% of the total market share. According to Eurostat, 78% of EU internet users aged 16–74 purchased or ordered goods and services online in 2025, compared with 62% in 2015, representing an increase of 16 percentage points.
UN Trade and Development (UNCTAD) estimated that e-commerce sales across 43 economies reached nearly USD 27 trillion in 2022, up from about USD 17 trillion in 2016. This increase of around USD 10 trillion shows the growing commercial importance of online sales and supports stronger demand for SEM tools that connect advertising spending directly with orders and revenue.
Key Market Segments
By Component
- Software
- Keyword Research Tools
- Campaign Management Tools
- Bid Management Tools
- Ad Tracking and Analytics Tools
- A/B Testing Tools
- Others
- Services
- Professional Services
- Consulting
- Integration
- Managed Services
- Support and Maintenance
By Deployment Mode
- Cloud-Based
- On-Premise
By Enterprise Size
- Large Enterprises
- Small and Medium Enterprises (SMEs)
By End-Use Industry
- Retail and E-commerce
- IT and Telecom
- Media and Entertainment
- BFSI
- Travel and Hospitality
- Healthcare
- Education
- Others
Geopolitical Impact Analysis
Geopolitical risk affects the Search Engine Marketing (SEM) tools market mainly through cloud infrastructure costs, energy availability, and technology supply chains. SEM platforms depend on data centres, servers, semiconductors, networking equipment, cooling systems, and stable electricity to process search data, keyword auctions, campaign reports, and AI-based bid optimization.
According to the International Energy Agency, global data-centre electricity demand is expected to increase from 485 TWh in 2025 to 950 TWh by 2030, reaching around 3% of total global electricity demand. This growing power requirement increases the exposure of cloud-based SEM providers to electricity-price increases, grid shortages, and regional energy disruptions.
Trade tensions also affect the hardware supply chain supporting SEM platforms. The World Trade Organization reported that new tariffs and import measures introduced between mid-October 2024 and mid-October 2025 affected USD 2.64 trillion of global imports, equal to 11.1% of world imports. Since 2009, such measures have affected around 19.7% of global imports.
These restrictions can increase the cost and delivery time of processors, memory chips, servers, storage systems, and networking equipment. Energy risks are also rising, as the Strait of Hormuz carries about 35% of global seaborne crude-oil trade, while the World Bank projected average energy prices to increase 24% in 2026.
Regional Analysis
North America held a dominant position in the Search Engine Marketing (SEM) Tools Market, capturing 38.4% of global revenue, equal to approximately USD 3.7 billion. The region benefits from a mature digital advertising, e-commerce, cloud, and enterprise software environment. According to the Interactive Advertising Bureau (IAB) and PwC, U.S. internet advertising revenue reached USD 294.6 billion in 2025, increasing 13.9% year over year.
Search advertising generated USD 114.2 billion, creating strong demand for SEM tools that support keyword research, bid management, budget control, campaign reporting, conversion tracking, and return-on-ad-spend measurement. The large U.S. e-commerce sector also supports market growth. Retail e-commerce sales reached USD 1.23 trillion in 2025, rising 5.4% from 2024 and accounting for 16.4% of total retail sales.
Asia Pacific is expected to be the fastest-growing regional market. ESCAP reported that digitally deliverable services exports in Asia Pacific grew 1.6 percentage points faster than the global average between 2015 and 2023. Rising internet use, mobile-first behavior, cross-border e-commerce, and SME digitalization are expected to increase demand for cloud-based SEM tools with local-language analysis and multi-market campaign management.
Key Regions and Countries
North America
- US
- Canada
Europe
- Germany
- France
- The UK
- Spain
- Italy
- Rest of Europe
Asia Pacific
- China
- Japan
- South Korea
- India
- Australia
- Rest of APAC
Latin America
- Brazil
- Mexico
- Rest of Latin America
Middle East & Africa
- GCC
- South Africa
- Rest of MEA
Market Dynamics
Drivers
| Driver | (~) % CAGR | Geographic Relevance | Impact Timeline |
|---|---|---|---|
| AI-led search automation | +2.4% | Global | Short term (2 years or less) |
| Retail search monetization | +1.8% | North America and Europe | Short term (2 years or less) |
| Agency workflow digitization | +1.3% | Global | Medium term (2 to 4 years) |
| Cross-border seller expansion | +1.1% | Asia Pacific and Middle East | Medium term (2 to 4 years) |
| Cloud data integration | +0.9% | Global | Medium term (2 to 4 years) |
AI-led search automation
AI-led automation is a major driver of the SEM tools market because it allows platforms to manage bids, match search queries, generate advertising assets, and identify conversion opportunities automatically. Google introduced AI Max for Search in 2025, while Google Search & other revenue increased by USD 26.4 billion year over year.
Alphabet reported that more than 70% of its 2025 revenue came from online advertising, showing the large commercial base for AI-driven search optimization. Microsoft also reported that search and news advertising revenue excluding traffic-acquisition costs increased 20% in fiscal 2025. These developments are increasing demand for SEM platforms that provide continuous monitoring, spending controls, conversion tracking, and audit trails for AI-generated campaign actions.
Restraints
| Restraint | (~) % CAGR | Geographic Relevance | Impact Timeline |
|---|---|---|---|
| Search-platform regulatory intervention | -2.1% | European Union | Short term (2 years or less) |
| Privacy-based data restrictions | -1.6% | Europe and North America | Short term (2 years or less) |
| SME advertising-budget cuts | -1.2% | Global | Short term (2 years or less) |
| Platform API access limits | -0.9% | Global | Medium term (2 to 4 years) |
| Procurement approval delays | -0.6% | North America and Europe | Medium term (2 to 4 years) |
Search-platform regulatory intervention
Regulatory intervention is a major restraint for the SEM tools market because these platforms depend on stable search-result formats, data access, and traffic flows. In July 2026, the European Commission fined Google €890 million under the Digital Markets Act.
Google was given 60 days to comply, while continued non-compliance could lead to penalties of up to 5% of worldwide turnover. Such regulatory changes can affect search placement, product visibility, reporting, and attribution. SEM vendors may therefore face higher compliance costs and slower product updates, especially in Europe, while global advertisers may also require consistent campaign measurement across different markets.
Challenges
| Challenge | (~) % CAGR | Geographic Relevance | Mitigation Horizon |
|---|---|---|---|
| Attribution signal fragmentation | -1.8% | Global | Medium term (2 to 4 years) |
| AI output quality control | -1.4% | Global | Short term (2 years or less) |
| Data-centre power pressure | -1.1% | North America, Europe and Asia Pacific | Long term (4 years or more) |
| Multi-platform workflow complexity | -0.9% | Global | Medium term (2 to 4 years) |
| Specialist talent scarcity | -0.7% | Global | Medium term (2 to 4 years) |
Attribution signal fragmentation
Attribution signal fragmentation remains a major challenge for SEM tool providers because advertisers must connect paid-search activity with customer actions across websites, mobile apps, retail platforms, call centres, and offline channels. Google reported around USD 9.9 billion in advertising and promotional expenses in 2025, highlighting the scale of commercial activity that depends on accurate performance measurement.
The International Energy Agency expects data-centre electricity use to exceed 1,000 TWh by 2030, up from about 460 TWh in 2024, increasing the cost of processing large conversion datasets. SEM vendors therefore need privacy-safe first-party data connectors, server-side tracking, modelled conversions, and reconciliation tools. Without these systems, inconsistent return-on-ad-spend results may slow renewals and limit wider automation adoption.
Opportunities
| Opportunity | (~) % CAGR | Geographic Relevance | Execution Window |
|---|---|---|---|
| AI-search visibility analytics | +2.2% | North America and Europe | Medium term (2 to 4 years) |
| Retail media integration | +1.7% | Global | Medium term (2 to 4 years) |
| Mid-market self-service suites | +1.3% | Asia Pacific and Latin America | Short term (2 years or less) |
| Cross-border language optimization | +1.0% | Asia Pacific, Middle East and Africa | Medium term (2 to 4 years) |
| Agency platform consolidation | +0.8% | Global | Long term (4 years or more) |
AI-search visibility analytics
AI-search visibility analytics represents an emerging opportunity for SEM tool providers as AI-generated search results create new needs for tracking brand mentions, source selection, product recommendations, and conversions. Google expanded AI Max for Search in 2025 and planned the automatic migration of legacy Dynamic Search Ads to AI Max from September 2026, creating new demand for monitoring and optimization tools.
Alphabet increased technical infrastructure investment in 2025 and indicated further investment growth in 2026, supporting wider AI-search adoption. The European Commission’s €460 million Google Search DMA decision in 2026 also increases the need to track search-result visibility. SEM vendors offering AI-search dashboards and automated analysis could improve account-level service margins by an estimated 5% to 10%.
Key Players Analysis
The SEM tools market has a clear two-tier competitive structure. Tier-1 leaders, including Google Ads, Microsoft Advertising, and Adobe Advertising Cloud, benefit from strong advertising platforms, first-party search data, and large enterprise customer networks. Google remains the leading ecosystem player.
Alphabet generated USD 402.8 billion in total revenue in 2025, while Google Services revenue reached USD 342.7 billion and Google Search & other revenue increased by USD 26.4 billion. Alphabet also invested USD 61.1 billion in research and development and USD 91.4 billion in capital expenditure, mainly supporting technical infrastructure, AI, automation, and cloud processing.
Microsoft reported FY2025 revenue of USD 281.7 billion, while search and news advertising revenue increased by USD 1.6 billion, or 13%. Revenue excluding traffic-acquisition costs increased 20%. Google and Microsoft together likely account for more than 45% of SEM-tool economic influence, although audited standalone market-share figures are not publicly available.
Tier-2 specialists, including Semrush, Skai, Marin Software, Optmyzr, WordStream, SpyFu, Ahrefs, Moz, Serpstat, AdEspresso, and AdRoll, compete through keyword intelligence, cross-platform management, agency tools, and affordable subscriptions. Semrush generated USD 443.6 million in revenue in 2025, up 18%, while annual recurring revenue reached USD 471.4 million.
Its R&D spending was USD 97.2 million, equal to 22% of revenue. Google also expanded AI Max for Search globally in beta during 2025, while Microsoft recorded 20% growth in search and news advertising revenue excluding traffic-acquisition costs.
Top Key Players in the Market
- Google (Google Ads)
- Semrush
- Microsoft Advertising
- AdEspresso
- Skai
- SpyFu
- WordStream
- Optmyzr
- AdRoll
- Marin Software
- Adobe Advertising Cloud
- Serpstat
- Ahrefs
- Moz
Recent Developments
- In 2026, Adobe completed its acquisition of Semrush in April, strengthening Adobe’s position in search visibility, brand discovery, analytics, and customer experience software. The all-cash transaction was originally valued at approximately USD 1.9 billion, with Adobe agreeing to pay USD 12.00 per Semrush share.
- In 2026, Microsoft made AI Max for Search available to all Microsoft Advertising customers in August. Ads within Copilot experiences delivered 101% higher engagement, while Copilot-assisted purchase journeys recorded a 53% increase in purchases within 30 minutes.
- Early AI Max tests showed at least an 8% rise in conversions, while 44 A/B experiments produced about a 13.6% spend-weighted conversion uplift, with 10 experiments showing statistically significant positive results.
Report Scope
| Report Features | Description |
|---|---|
| Market Value (2025) | USD 9.5 Billion |
| Forecast Revenue (2035) | USD 40.4 Billion |
| CAGR (2026-2035) | 15.6% |
| Base Year for Estimation | 2025 |
| Historic Period | 2020-2024 |
| Forecast Period | 2026-2035 |
| Report Coverage | Revenue Forecast, Market Dynamics, Competitive Landscape, Recent Developments |
| Segments Covered | By Component (Software, Services); By Deployment Mode (Cloud-Based, On-Premise); By Enterprise Size (Large Enterprises, Small and Medium Enterprises); By End-Use Industry (Retail and E-commerce, IT and Telecom, Media and Entertainment, BFSI, Travel and Hospitality, Healthcare, Education, Others) |
| Regional Analysis | North America – US, Canada; Europe – Germany, France, The UK, Spain, Italy, Rest of Europe; Asia Pacific – China, Japan, South Korea, India, Australia, Singapore, Rest of APAC; Latin America – Brazil, Mexico, Rest of Latin America; Middle East & Africa – GCC, South Africa, Rest of MEA |
| Competitive Landscape | Google (Google Ads), Semrush, Microsoft Advertising, AdEspresso, Skai, SpyFu, WordStream, Optmyzr, AdRoll, Marin Software, Adobe Advertising Cloud, Serpstat, Ahrefs, Moz |
| Customization Scope | Customization for segments and region/country-level will be provided. Moreover, additional customization can be done based on the requirements. |
| Purchase Options | We have three licenses to opt for: Single User License, Multi-User License (Up to 5 Users), Corporate Use License (Unlimited Users and Printable PDF) |





























