


Report Overview
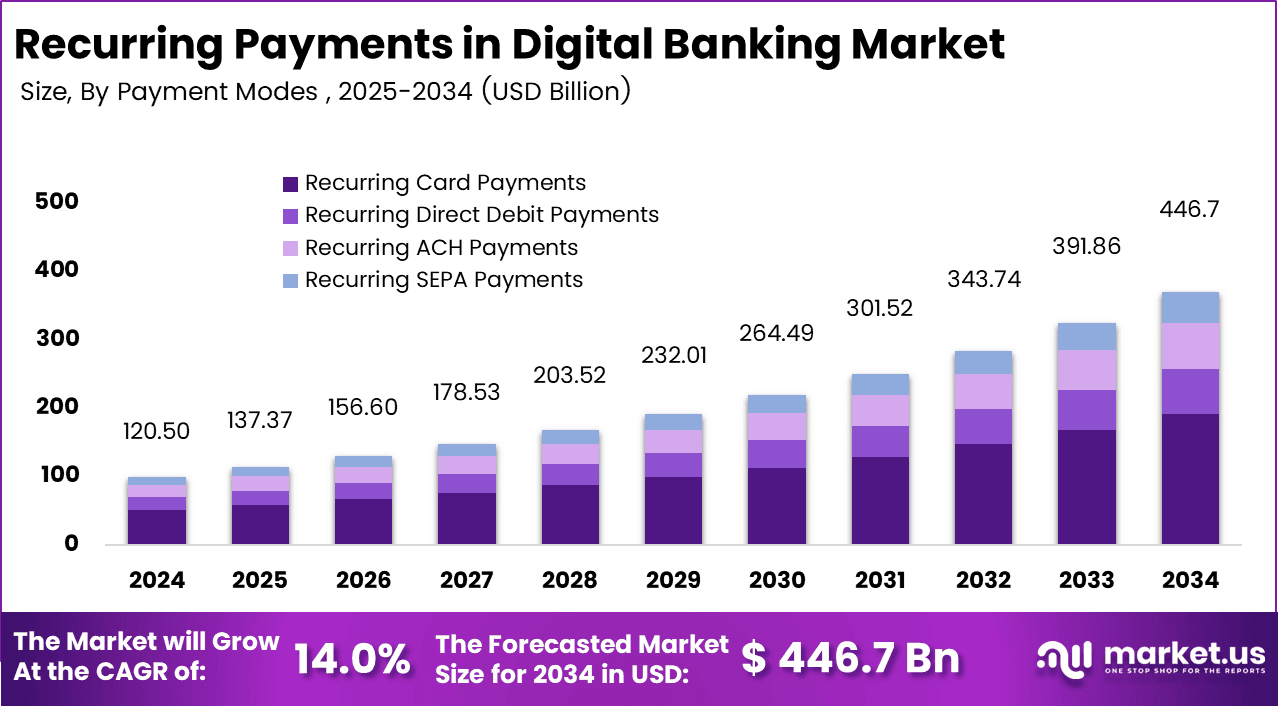
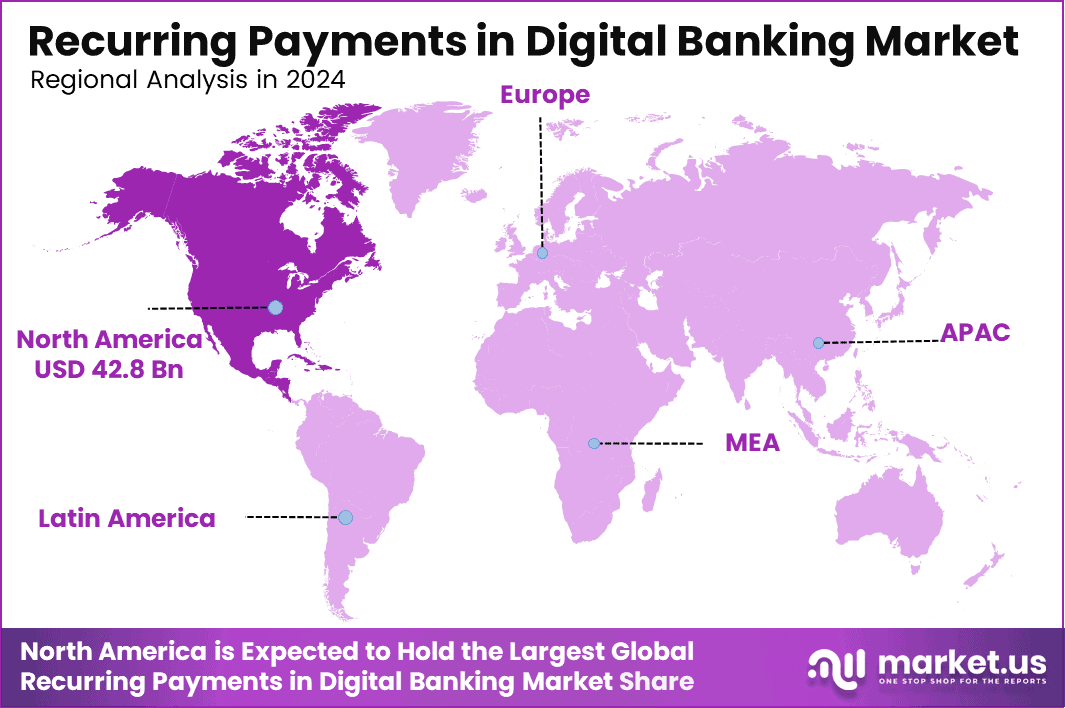
The Global Recurring Payments in Digital Banking Market holds a value of USD 120.5 billion in 2024 and will reach USD 446.7 billion by 2034. The market grows at a CAGR of 14.0% during the forecast period 2025 to 2034. North America leads with a 35.6% share and USD 42.9 billion in revenue.
Bill payments and subscription transactions continue to support recurring payment infrastructure growth. Nacha reported that the ACH Network processed 35.2 billion payments worth USD 93 trillion in 2025, with payment volume increasing 4.9% and value rising 7.9% from 2024.
Online consumer payments reached 11.4 billion in 2025, representing a 6% annual increase. These transactions include mortgages, insurance premiums, utilities, and loan instalments, which generate predictable monthly payment volumes and increase demand for automated recurring payment systems.
Subscription commerce provides an additional growth engine. Stripe reported that businesses using its platform managed 200 million active subscriptions and generated USD 1.9 trillion in total payment volume in 2025, up 34% from 2024. This scale increases the need for mandate management, payment retries, and dunning capabilities to reduce failed transactions and protect recurring revenue.
The World Bank Global Findex 2025 reported that 79% of adults worldwide held an account, expanding the addressable base for direct debit and recurring payments. Nacha also recorded nearly 8.1 billion business-to-business ACH payments, with healthcare volume rising 7.3%. ACH volume reached a monthly record of 3.22 billion payments, supported by recurring activity across insurance, healthcare, utilities, and other bill-payment categories.
Key Takeaways
- The Recurring Payments in Digital Banking Market stands at USD 120.5 billion in 2025. market will reach USD 446.7 billion by 2035. grows at a CAGR of 14.0% from 2026 to 2035.
- Recurring Card Payments lead the payment modes segment with a 42.7% share.
- Fixed Recurring Payments lead the usage segment with a 60.6% share.
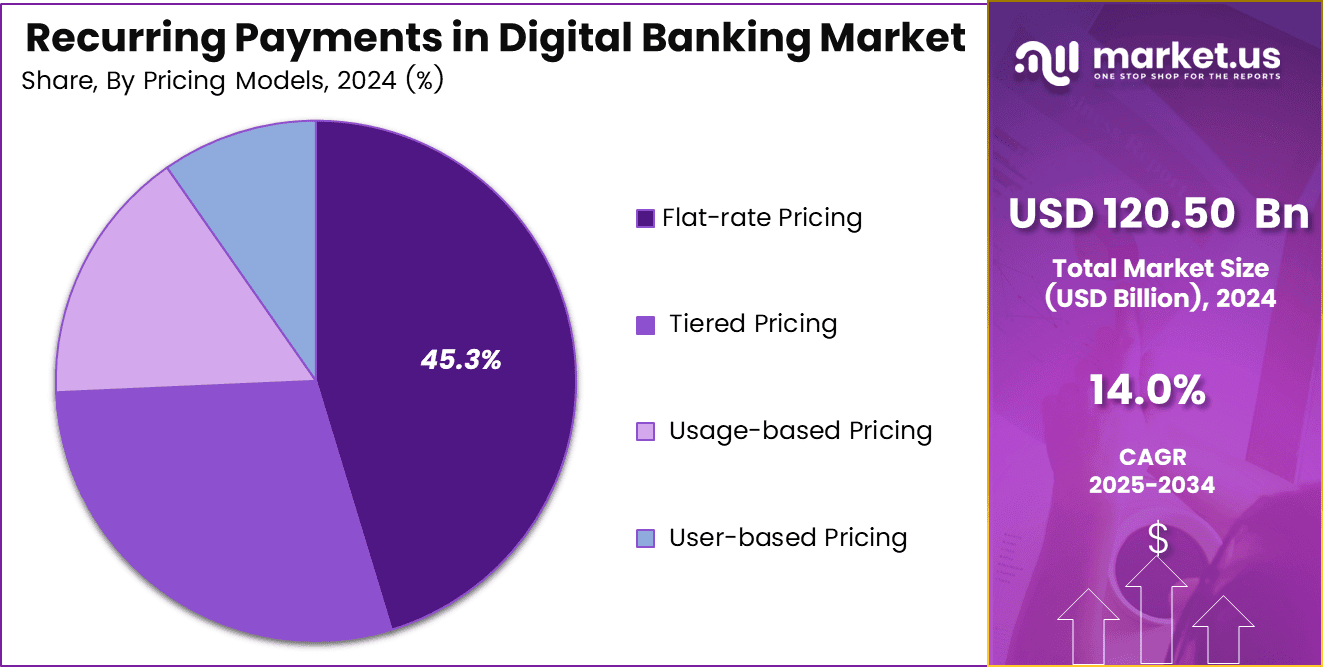
- Flat-rate Pricing leads the pricing models segment with a 45.3% share.
- Banking, Financial Services, and Insurance (BFSI) leads the industry segment with a 36.8% share.
- North America dominates with a 35.6% share and USD 42.9 billion in revenue.
Role of generative AI
Generative AI is reshaping the recurring payments landscape in digital banking by enhancing automation, personalization, and risk management. Through predictive analytics, AI anticipates potential payment failures—such as expired cards or insufficient funds—and proactively initiates reminders or alternative routing, improving transaction success rates.
AI-driven fraud detection models continuously monitor recurring transaction patterns to identify unusual activities, safeguarding both consumers and financial institutions. Generative AI also powers conversational interfaces, enabling users to interact naturally through chatbots to manage subscriptions, review billing histories, or adjust payment settings seamlessly. AI automates reconciliation, renewal tracking, and compliance reporting, significantly reducing manual workloads for banks.
Furthermore, AI-generated insights help financial service providers design smarter pricing models and target customer segments with personalized offers. Overall, Gen AI transforms recurring payments into a more reliable, adaptive, and customer-centric process, strengthening digital trust and long-term engagement in the financial ecosystem.
By Payment Modes
Recurring Card Payments dominate with 42.7% due to universal issuance and card-on-file tokenisation.
Cards lead recurring payments because banks issue them at scale and merchants accept them widely. The Federal Reserve recorded 236.6 billion noncash payments in the United States in 2024, with cards representing about four-fifths of transactions by number. Tokenised card storage, automated card updates, and retry mechanisms help merchants maintain long-running subscriptions.
Recurring ACH payments are growing faster because they offer lower transaction costs and suit higher-value payments such as rent, tuition, and loan instalments. Nacha reported 35.2 billion ACH Network payments in 2025, while Same Day ACH volume increased 16.7% to 1.4 billion payments. Faster settlement and lower processing costs are encouraging more billers to shift recurring transactions from cards to bank-to-bank debits.
By Usage
Fixed Recurring Payments dominate with 60.6% due to predictable amounts needing no repeat authorisation.
Fixed payment plans dominate because predictable amounts simplify billing and reduce disputes. Pay.UK processed 5.03 billion Direct Debit items through the Bacs system in 2025, alongside 1.83 billion Direct Credit items, highlighting the scale of scheduled payment instructions used for insurance, memberships, and household bills.
Variable recurring payments are growing rapidly as utilities, travel, energy, and usage-based services require changing payment amounts. The Financial Conduct Authority reported that variable recurring payments account for 16% of all open banking transactions. Customer-defined limits, flexible mandates, and expanding regulatory support are helping these payment models gain wider adoption.
By Pricing Models
Flat-rate Pricing dominates with 45.3% due to one simple price aiding subscriber retention.
Flat-rate pricing holds the largest share because it is simple for customers and easy for banks to process on a fixed schedule. Netflix reported USD 45.2 billion in revenue in 2025, up 16% year on year. Fixed pricing improves revenue visibility, reduces billing errors, and makes customer support and churn management easier.
Usage-based pricing is growing faster as AI and cloud workloads vary each month. Snowflake reported a net revenue retention rate of 125% at the end of fiscal 2026, while quarterly product revenue increased 30%. Metered plans lower entry costs and allow spending to rise with usage, supported by flexible mandates and better billing data.
By Industry
BFSI dominates with 36.8% due to bank-owned mandates covering loans and premiums.
Financial services lead recurring payments because banks and insurers control customer accounts, mandates, and payment infrastructure. The European Central Bank recorded 11.4 billion direct debits worth €5.4 trillion in the euro area during the second half of 2024, with volume increasing 3.9%. Recurring loan repayments, insurance premiums, pensions, and card payments sustain long-term transaction volumes.
Healthcare is emerging as the fastest-growing end-use sector as providers adopt automated instalments and digital collection. Nacha reported nearly 548 million healthcare claim payments in 2025, up 7.3% year on year. Growth in telehealth subscriptions, patient payment plans, and recurring medical programmes is further increasing demand for automated payment solutions.
Key Market Segments
By Payment Modes
- Recurring Card Payments
- Recurring Direct Debit Payments
- Recurring ACH Payments
- Recurring SEPA Payments
By Usage
- Fixed Recurring Payments
- Variable Recurring Payments
By Pricing Models
- Flat-rate Pricing
- Tiered Pricing
- Usage-based Pricing
- User-based Pricing
By Industry
- Banking, Financial Services, and Insurance (BFSI)
- Media and Entertainment
- Healthcare
- Government and Education
- Travel and Hospitality
- Others
Geopolitical Impact Analysis
Trade friction is increasingly affecting the cost structure of recurring payment platforms. The WTO reduced its world merchandise trade growth forecast for 2026 to 0.5%, down from 1.8%, following growth of 2.4% in 2025. Tariff shocks and tighter financial conditions were identified as key pressures, while the average United States tariff rate was estimated at between 9% and 11.4%, depending on the trade-weighting method.
Payment providers are exposed through imported hardware such as card readers, payment terminals, secure-element chips, HSM appliances, and data-centre servers. Higher electronics duties increase equipment replacement costs for banks, acquirers, and billers. This encourages longer device refresh cycles and supports greater use of account-to-account debits and tokenised card mandates that require less physical payment infrastructure.
Shipping disruptions add further pressure. UNCTAD reported that rerouting vessels around the Cape of Good Hope adds about 12 days to Asia-Europe voyages, increases transit times by around 30%, and reduces effective global container capacity by roughly 9%. More than 300 container vessels, representing over 20% of global container capacity, were diverted away from the Suez route during the disruption.
Longer delivery times can delay POS terminals, servers, and other infrastructure required for payment migration projects across Europe and Africa. Providers may therefore hold higher device inventories or shift more migration activity toward cloud-based mandate platforms. Rising demand for AI-related semiconductors, servers, and telecom equipment is increasing competition for the same hardware components used by payment firms, keeping procurement costs under pressure.
Regional Analysis
North America leads the Recurring Payments in Digital Banking Market with a 35.6% share and revenue of USD 42.9 billion. The region benefits from mature banking infrastructure and rapid settlement systems. In 2025, Same Day ACH processed 1.4 billion payments worth USD 3.9 trillion, with transaction volume rising 16.7% and value increasing 21.4% from the previous year.
Asia Pacific is emerging as the fastest-growing regional market, supported by rapid adoption of automated digital mandates. UPI Autopay processed around 926 million transactions in November 2025, compared with 530.5 million a year earlier, representing a reported increase of 100%.
Europe maintains a strong position due to the widespread use of mandate-based direct debits for household and business payments. In the second half of 2025, the euro area recorded 11.7 billion direct debits worth EUR 5.6 trillion, with volume growing 1.8% and value increasing 3.4% year on year. Direct debits represented 14% of all transactions.
US Market Size
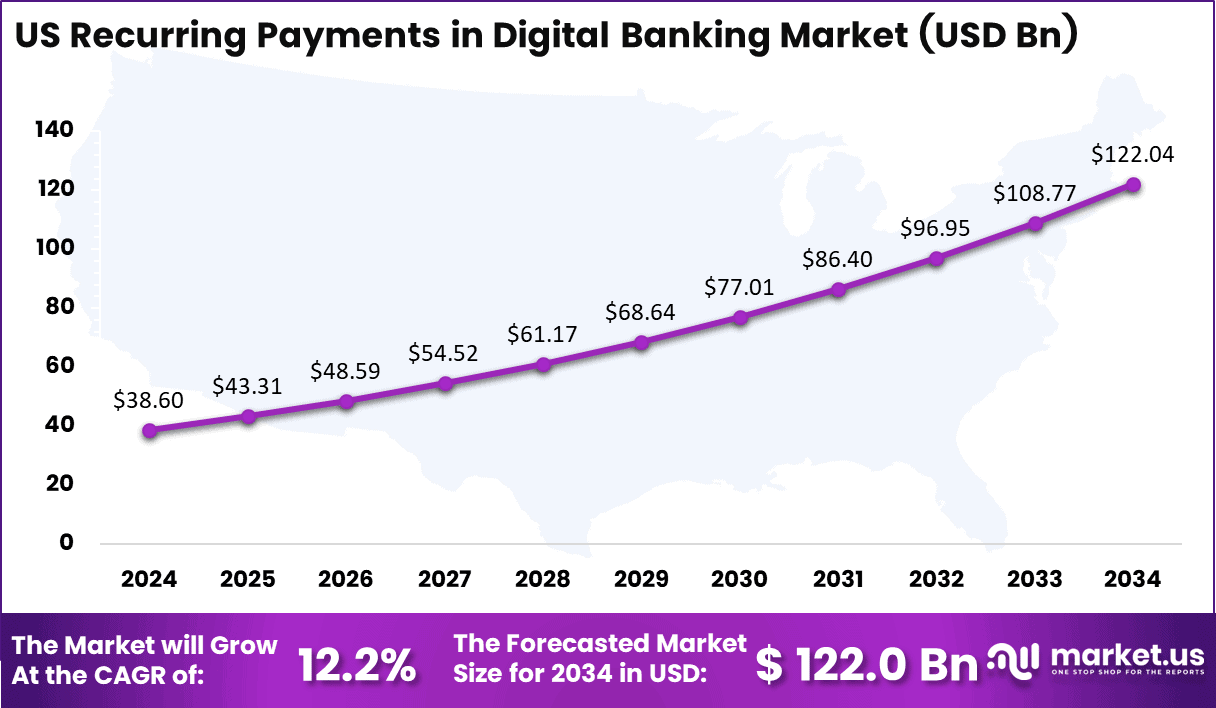
The US recurring payments in digital banking market is showing steady and sustainable expansion. In 2024, it reached an estimated USD 38.6 billion, supported by rapid digital transformation in banking, strong e-commerce penetration, and rising consumer preference for automated billing and subscription services.
The market is projected to grow at a CAGR of 12.2% from 2025 to 2034, achieving a forecasted value of USD 122.04 billion by 2034. This growth is fueled by increasing adoption of fintech APIs, mobile banking platforms, and digital wallets that simplify recurring payments for services like streaming, insurance, and utilities. Banks and payment providers are investing in AI-powered analytics and blockchain-based systems to enhance payment reliability and transparency.
Key Regions and Countries
North America
- US
- Canada
Europe
- Germany
- France
- The UK
- Spain
- Italy
- Rest of Europe
Asia Pacific
- China
- Japan
- South Korea
- India
- Australia
- Rest of APAC
Latin America
- Brazil
- Mexico
- Rest of Latin America
Middle East and Africa
- GCC
- South Africa
- Rest of MEA
Market Dynamics
Drivers
| Driver | (~) % Impact on CAGR Forecast | Geographic Relevance | Impact Timeline |
|---|---|---|---|
| Instant-payment mandate expansion | +2.4% | Europe, Brazil, India, Asia-Pacific | Short term (2 years or less) |
| Subscription billing digitization | +1.8% | North America, Europe, Asia-Pacific | Short term (2 years or less) |
| Mobile-bank primary-account adoption | +1.5% | Global, strongest in emerging markets | Medium term (2 to 4 years) |
| Embedded finance adoption | +1.2% | North America, Europe, Southeast Asia | Medium term (2 to 4 years) |
| Account-to-account payment migration | +1.1% | Europe, India, Brazil, Australia | Medium term (2 to 4 years) |
| Digital biller connectivity | +0.8% | Global urban banking markets | Medium term (2 to 4 years) |
Instant-payment mandate expansion
The shift toward always-on bank payment rails is a major growth driver for recurring payments, enabling banks to move from card-dependent collections toward real-time account-to-account services. Regulation (EU) 2024/886, adopted on 13 March 2024, requires euro-area providers to receive instant transfers from 9 January 2025 and send them from 9 October 2025, with funds available within 10 seconds.
India is also supporting this transition through its e-mandate framework across cards, prepaid instruments, and UPI, with the general authentication-free threshold raised to ₹15,000 per transaction. These developments strengthen demand for API orchestration, consent management, and fraud controls, potentially contributing around +2.4% to the 14.0% baseline CAGR.
Restraints
| Restraint | (~) % Impact on CAGR Forecast | Geographic Relevance | Impact Timeline |
|---|---|---|---|
| Mandate authentication thresholds | -1.9% | India, selected regulated markets | Short term (2 years or less) |
| Uneven bank API availability | -1.5% | Europe, North America, emerging markets | Medium term (2 to 4 years) |
| Interchange-funded incumbent economics | -1.3% | North America, Europe, Asia-Pacific | Medium term (2 to 4 years) |
| Cross-border mandate fragmentation | -1.1% | Global cross-border corridors | Medium term (2 to 4 years) |
| Small-merchant integration budgets | -0.9% | Emerging markets, smaller enterprises | Short term (2 years or less) |
| Consumer switching inertia | -0.7% | North America, Western Europe, Japan | Medium term (2 to 4 years) |
Mandate authentication thresholds
Mandatory step-up authentication is a key sales restraint for high-value recurring payments because it interrupts frictionless renewals. RBI rules require additional authentication for general recurring transactions above ₹15,000, while a higher limit of ₹100,000 applies only to selected insurance, mutual fund, and credit-card bill payments. The e-mandate framework was introduced in 2019, with the standard threshold later increased from ₹5,000 to ₹15,000.
This requirement can increase payment failures and involuntary churn across subscriptions, insurance, and repayment services. Banks and billers must invest in retry workflows, routing logic, and alternative payment options, raising renewal costs. In markets with frequent re-authentication, these constraints could create an estimated -1.9% drag on the baseline CAGR.
Challenges
| Challenge | (~) % CAGR Friction Drag | Geographic Relevance | Mitigation Horizon |
|---|---|---|---|
| Real-Time Fraud Control | -1.7% | Global, especially instant-payment markets | Medium term (2 to 4 years) |
| Consent Lifecycle Management | -1.3% | Europe, India, Brazil, United Kingdom | Medium term (2 to 4 years) |
| Legacy Core Integration | -1.2% | North America, Europe, Asia-Pacific | Long term (4 years or more) |
| Data Localization Complexity | -1.0% | India, Southeast Asia, Middle East, Europe | Medium term (2 to 4 years) |
| Exception Handling Automation | -0.9% | Global | Medium term (2 to 4 years) |
| Payment Data Skills | -0.7% | Global | Long term (4 years or more) |
Real-Time Fraud Control
Real-time fraud control remains a major growth restraint as recurring account-to-account payments require continuous risk monitoring and near-instant settlement decisions. Faster payment rails reduce the time available for fraud checks, while verification-of-payee requirements introduced from 9 October 2025 increase the need for accurate identity and beneficiary validation.
Banks must therefore invest in behavioral analytics, device intelligence, fraud models, and case management systems. Without adequate controls, higher fraud losses, reimbursement exposure, and excessive payment declines could weaken customer adoption and create an estimated -1.7% drag on achievable recurring-payment growth.
Opportunities
| Opportunity | (~) % Potential CAGR Upside | Geographic Relevance | Execution Window |
|---|---|---|---|
| Commercial variable-recurring APIs | +2.2% | United Kingdom, Europe, Australia | Medium term (2 to 4 years) |
| SME cash-flow automation | +1.7% | Global, especially emerging markets | Medium term (2 to 4 years) |
| Utility collection modernization | +1.5% | Latin America, Asia-Pacific, Africa | Medium term (2 to 4 years) |
| Cross-border treasury recurrence | +1.3% | Europe, Gulf markets, Asia-Pacific | Long term (4 years or more) |
| Personalized savings sweeps | +1.1% | United Kingdom, Europe, North America | Medium term (2 to 4 years) |
| Consent-data monetization tools | +0.9% | Europe, India, Brazil, Southeast Asia | Long term (4 years or more) |
Commercial variable-recurring APIs
Commercial variable-recurring payment APIs remain a major untapped opportunity, as current bank-enabled APIs mainly support account sweeping rather than merchant-led subscriptions, utilities, and repayments. In the UK, 9 major banks were required to enable sweeping APIs, while broader non-sweeping recurring payments remain outside the mandate. Proposed legislation expected in 2026 could support wider adoption.
A commercial API model could shift recurring payments toward lower-cost account-to-account processing while improving consent, mandate updates, and retry management. These capabilities could reduce failed-payment handling costs by around 20% to 35% per recovered payment and potentially add about +2.2% above the 14.0% baseline CAGR.
Key Players Analysis
Tier 1 companies lead the recurring payments market through large transaction ecosystems, strong revenue bases, and sustained cash generation. Stripe increased revenue by about 33% to USD 6.8 billion in 2025, while free cash flow rose 52% to USD 3.2 billion. This represented its fastest revenue growth since 2021.
Worldline S.A. reported FY 2025 revenue of EUR 4,030 million, down 2.7% from 2024. Merchant Services remained its largest business, generating EUR 3,238 million, although revenue declined 1.4% year on year. In India, Paytm reported FY26 operating revenue of INR 8,437 crore, up 22%, alongside profit after tax of INR 552 crore. Payment services revenue reached INR 1,284 crore in the December 2025 quarter, while net payment revenue increased 25% to INR 613 crore.
Tier 2 companies compete through regional strength, specialised payment capabilities, and expansion funding. Razorpay Software Limited raised USD 375 million in its Series F funding round at a valuation of USD 7.5 billion. Cashfree Payments India Private Limited has raised USD 93.92 million and was valued at USD 700 million during its Series C round.
Cashfree is also targeting a funding round of more than USD 100 million in FY27 to support cross-border payments, AI capabilities, and international expansion. Specialist providers compete more through billing depth than overall payment volume.
Top Key Players in the Market
- Cashfree Payments India Private Limited
- Worldline S.A.
- Paycorp Solutions Pvt. Ltd.
- Razorpay Software Limited
- Paytm Payments Services Limited, Inc.
- Stripe, Inc.
- Paytently
- Dateio
- Chargebee Inc.
- Instantpay
Recent Developments
- In February 2025, Cashfree Payments raised USD 53 million, or INR 450 crore, in a round led by KRAFTON with existing investor Apis Growth Fund II, at a valuation of USD 700 million.
- In June 2025, Razorpay invested USD 30 million, about INR 259 crore, to take a majority stake of more than 50% in UPI consumer payments platform POP, which closed on 17 June 2025.
- In July 2025, Worldline entered exclusive talks to divest its Mobility and e-Transactional Services business and selected Financial Services activities to Magellan Partners Group for an enterprise value of up to EUR 410 million, covering about EUR 450 million of 2024 turnover and 3,800 employees.
- In June 2026, Worldline completed the EUR 400 million sale of its Mobility and e-Transactional Services unit to Magellan Partners Group, generating about EUR 280 million in net cash proceeds within a wider divestment programme of EUR 590 million to EUR 640 million.
Report Scope
| Report Features | Description |
|---|---|
| Market Value (2024) | USD 120.5 billion |
| Forecast Revenue (2034) | USD 446.7 billion |
| CAGR (2025-2034) | 14.0% |
| Base Year for Estimation | 2025 |
| Historic Period | 2020-2023 |
| Forecast Period | 2025-2034 |
| Report Coverage | Revenue Forecast, Market Dynamics, Competitive Landscape, Recent Developments |
| Segments Covered | By Payment Modes (Recurring Card Payments, Recurring Direct Debit Payments, Recurring ACH Payments, Recurring SEPA Payments); By Usage (Fixed Recurring Payments, Variable Recurring Payments); By Pricing Models (Flat-rate Pricing, Tiered Pricing, Usage-based Pricing, User-based Pricing); By Industry (Banking, Financial Services, and Insurance (BFSI), Media and Entertainment, Healthcare, Government and Education, Travel and Hospitality, Others) |
| Regional Analysis | North America – US, Canada; Europe – Germany, France, The UK, Spain, Italy, Rest of Europe; Asia Pacific – China, Japan, South Korea, India, Australia, Singapore, Rest of APAC; Latin America – Brazil, Mexico, Rest of Latin America; Middle East & Africa – GCC, South Africa, Rest of MEA |
| Competitive Landscape | Cashfree Payments India Private Limited, Worldline S.A., Paycorp Solutions Pvt. Ltd., Razorpay Software Limited, Paytm Payments Services Limited, Inc., Stripe, Inc., Paytently, Dateio, Chargebee Inc., Instantpay |
| Customization Scope | Customization for segments and region/country-level will be provided. Additional customization can be done based on requirements. |
| Purchase Options | We have three licenses to opt for: Single User License, Multi-User License (Up to 5 Users), Corporate Use License (Unlimited Users and Printable PDF) |





































