


Report Overview
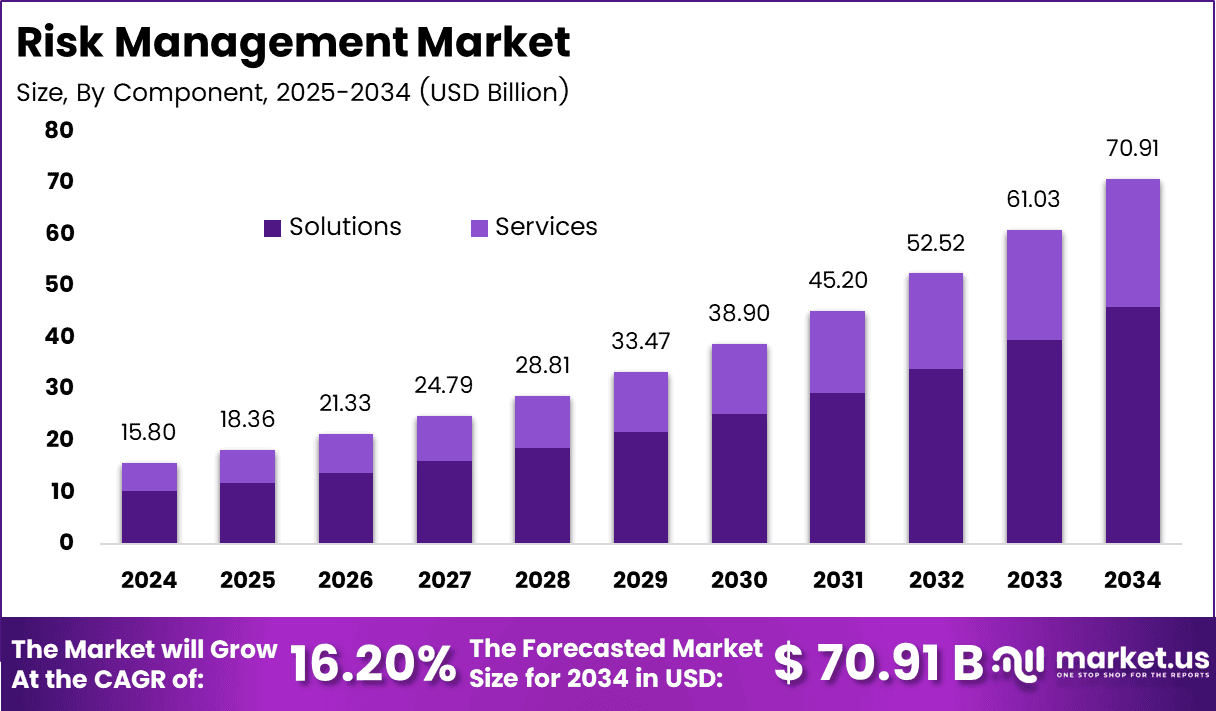
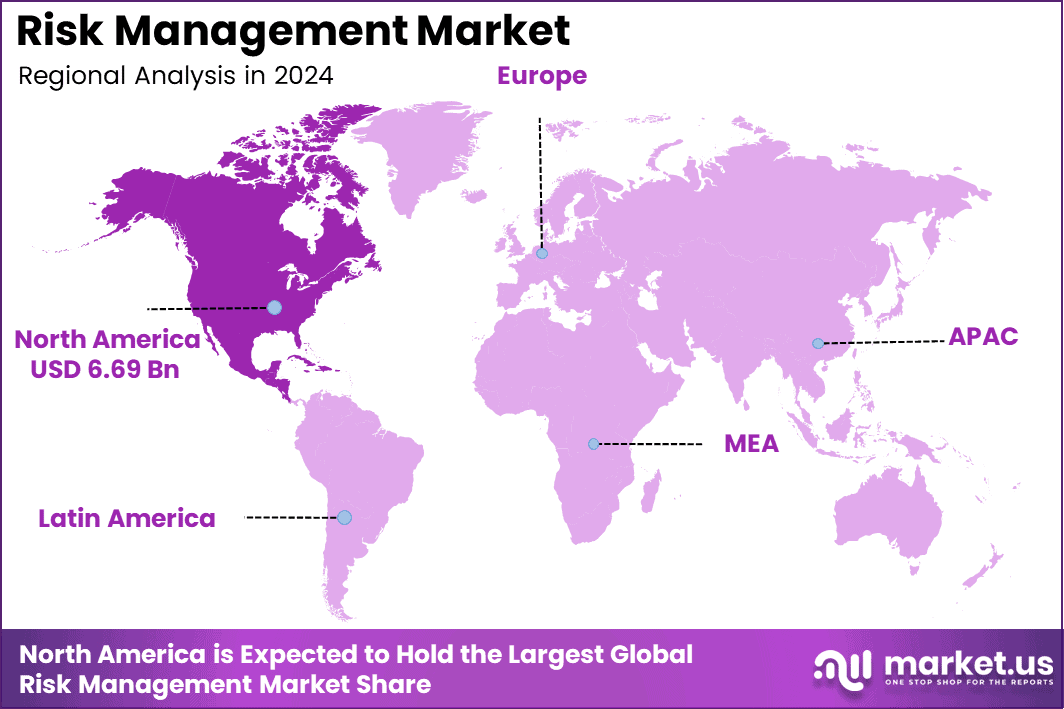
The Global Risk Management Market reached USD 15.8 billion in 2024 and will climb to USD 70.9 billion by 2034, growing at a CAGR of 16.2% across the 2025 to 2034 forecast period. North America holds a 43.1% share and USD 6.7 billion in revenue.
The International Telecommunication Union reports that about 6 billion people, roughly three-quarters of the world population, used the internet in 2025, after the online population grew by more than 240 million people that year. More users, more payment rails, and more cloud workloads mean more risk to measure, so buyers keep replacing spreadsheets with platforms.
The Deposit Insurance Fund balance stood at $153.9 billion at 31 December 2025, which shows the scale of supervised assets behind that control spending. Compute growth adds a second push. The International Energy Agency expects data centre electricity use to roughly double from 485 TWh in 2025 to 950 TWh in 2030, about 3% of world demand, and every new facility brings fresh operational and vendor risk.
The North America region leads because its financial system is large, tightly supervised, and heavily audited. The Federal Deposit Insurance Corporation reported that 4,338 insured banks and savings institutions filed results for the fourth quarter of 2025, earning quarterly net income of $77.7 billion, while 60 institutions sat on the Problem Bank List. Each of those firms must run credit, liquidity, and compliance controls.
Key Takeaways
- The market stood at USD 15.8 billion in 2024 and will reach USD 70.9 billion by 2034. Revenue will grow at a CAGR of 16.2% from 2025 to 2034.
- Solutions lead the Component segment with a 64.8% share, and Services grow fastest.
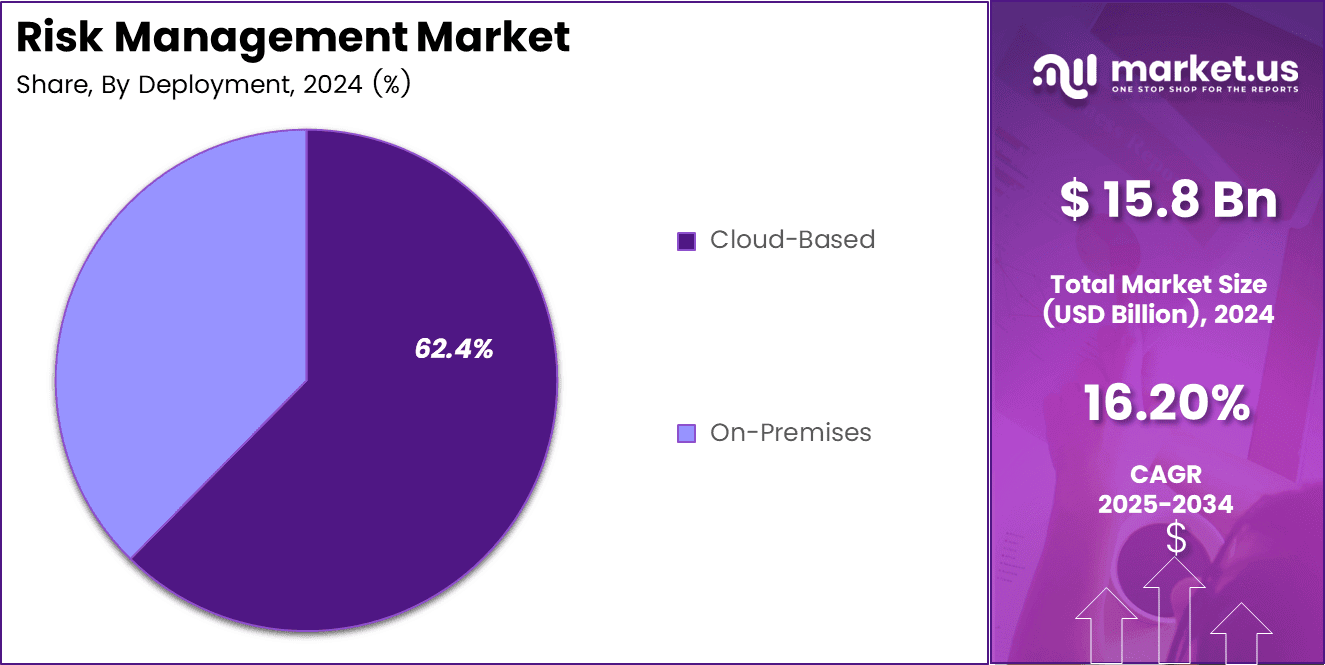
- Cloud-Based deployment leads with a 62.4% share, and it also grows fastest against On-Premises.
- Financial Risk Management leads the Risk Type segment with a 38.1% share, and Cybersecurity Risk Management grows fastest.
- Large Enterprises lead by Organization Size with a 71.6% share, and Small and Medium-Sized Enterprises grow fastest.
- BFSI leads End Use with a 27.3% share, and Healthcare and Life Science grows fastest.
- North America leads with a 43.1% share and USD 6.7 billion in revenue.
Role of Generative AI
The role of generative AI in the risk management market is expanding rapidly as organizations integrate AI-driven insights into strategic decision-making and operational resilience. Generative AI enhances predictive accuracy by analyzing vast, unstructured datasets to simulate potential risk scenarios and generate real-time mitigation strategies. Around 40–45% of enterprises are already adopting generative AI models for fraud detection, compliance automation, and financial forecasting.
These systems help create adaptive risk models that evolve with market fluctuations and regulatory changes, improving decision-making speed by nearly 30%. Furthermore, generative AI supports intelligent risk reporting by auto-generating narratives from complex data, reducing manual workload by up to 50% for risk analysts.
Its ability to identify hidden interdependencies across financial, cybersecurity, and operational domains empowers enterprises to transition from reactive to proactive risk management. As AI governance frameworks mature, generative AI is expected to become a core enabler of enterprise-wide resilience and compliance optimization by the end of this decade.
By Component
Solutions dominate with 64.8% due to built-in controls replacing manual risk tracking.
Solutions lead because risk teams need continuous control testing, monitoring, and reporting that manual processes cannot manage at scale. The ISO Survey 2024 recorded 96,709 valid ISO/IEC 27001 certificates covering 179,877 sites worldwide, compared with 36,362 certificates in the 2019 edition, supporting demand for centralized risk-management platforms.
Managed Services are growing fastest as organizations struggle to maintain specialist expertise internally. The ITU Global Cybersecurity Index 2024 assessed 194 countries, with Tier 1 requiring a score of at least 95 out of 100. This skills gap is increasing demand for outsourced monitoring, threat management, reporting, and platform administration.
By Deployment
Cloud-Based dominates with 62.4% due to fast rollout across multi-site enterprise operations.
Cloud-based platforms lead because they offer faster deployment and lower infrastructure requirements. In 2025, 52.7% of EU enterprises used paid cloud services, up from 17.8% in 2014. This supports wider adoption of hosted risk-management platforms that provide centralized access and automatic compliance updates.
Cloud adoption is also growing fastest among smaller firms. In 2023, usage reached about 78% among large enterprises, 59% among medium-sized firms, and 42% among small businesses. Lower upfront costs, subscription pricing, and hybrid deployment models are helping close this gap.
By Risk Type
Financial Risk Management dominates with 38.1% due to strict bank capital and reporting rules.
Financial risk management leads because Basel rules require banks to hold capital against regulated exposures. The output floor rises to 72.5% of the standardized calculation, while impact studies indicate an average 18% increase in Tier 1 capital requirements for large international banks.
Operational risk capital estimates have also shifted from around USD 112 billion to USD 99 billion, reinforcing demand for modelling and stress-testing tools. Cybersecurity risk management is growing fastest as disclosure deadlines tighten. The SEC requires material cyber incidents to be reported on Form 8-K, Item 1.05, within 4 business days of determining materiality.
By Organization Size
Large Enterprises dominate with 71.6% due to wide operations needing formal risk governance.
Large enterprises lead adoption because their complex operations require centralized risk management. Companies with more than 249 employees represent only 0.2% of EU enterprises but account for 37% of the workforce and 51% of total turnover, supporting higher spending on integrated platforms and dedicated risk teams.
SMEs are growing fastest from a smaller base. They represent around 99% of firms across OECD countries and contribute roughly 50% to 60% of value added. SMEs also generated 61% of new jobs among non-micro firms during 2016 to 2019, while affordable subscription tools are making compliance and risk management easier to adopt.
By End Use
BFSI dominates with 27.3% due to supervised capital, fraud, and resilience duties.
BFSI leads risk management spending as regulations make operational resilience mandatory. The EU Digital Operational Resilience Act became applicable on 17 January 2025, covering about 22,000 financial entities across 20 categories.
Healthcare and life sciences are growing fastest due to rising data-breach risks. US providers must report breaches affecting 500 or more individuals, while 7,418 major healthcare breaches were recorded between 2009 and 2025, exposing more than 1 billion records. This is increasing spending on monitoring, security, and incident-response systems.
Key Market Segments
By Component
- Solutions
- Risk Assessment and Analysis
- Risk Control and Monitoring
- Risk Reporting and Analytics
- Others
- Services
- Professional Services
- Managed Services
By Deployment
- On-Premises
- Cloud-Based
By Risk Type
- Financial Risk Management
- Compliance Risk Management
- Cybersecurity Risk Management
- Enterprise Risk Management
- Operational Risk Management
- Others
By Organization Size
- Large Enterprises
- Small and Medium-Sized Enterprises
By End Use
- BFSI
- IT and Telecom
- Government, Defense, and Aerospace
- Healthcare and Life Science
- Retail and Consumer Goods
- Manufacturing
- Energy and Utilities
- Others
Geopolitical Impact Analysis
Trade policy is increasing hardware costs for risk management platforms. The White House imposed a 25% Section 232 tariff on certain advanced computing chips and derivative products from 15 January 2026, with exemptions for selected US data centre, research, and public-sector uses. Higher server and GPU costs can therefore feed into risk analytics and subscription pricing.
The wider trade environment is also weakening. The WTO projected merchandise trade volume growth of only 1.9% in 2026, down from 4.6% in 2025, while goods and services trade growth is expected to slow to 2.7% from 4.7%. By the end of February 2026, only 72% of global trade was still moving under most-favoured-nation terms.
Logistics disruption adds further pressure. Asia-to-Europe shipping diversions around the Cape of Good Hope add roughly 3,000 to 3,500 nautical miles and 10 to 14 days per voyage. Maersk again shifted vessels toward the Cape route in February 2026 after nearly 800 days of disruption, delaying delivery of data centre and network equipment.
These conditions strengthen demand for cloud-based risk platforms over capital-intensive on-premises installations. Higher energy prices linked to Middle East tensions also increase hosting costs for analytics workloads, while fragmented supply chains increase supplier screening, third-party risk assessment, and operational risk management requirements.
Regional Analysis
North America dominates the Risk Management Market, holding a 43.1% share and generating USD 6.7 billion in revenue. Supervisory density explains the lead. The Federal Deposit Insurance Corporation counted 4,379 insured commercial banks and savings institutions in the third quarter of 2025, when the industry posted net income of $79.3 billion and a return on assets of 1.27%, and 42 institutions left the count that quarter as four sold to uninsured buyers and 38 merged.
Asia Pacific ranks as the fastest-growing region in the Risk Management Market. Payment scale drives it. The National Payments Corporation of India recorded 23.66 billion UPI transactions worth about ₹29.88 trillion in July 2026 across 741 live banks, so fraud and operational risk engines must run at very high volume.
Europe holds second place because rules bite hardest here. The Digital Operational Resilience Act now applies directly across all member states, and roughly 22,000 regulated financial entities and their ICT suppliers must meet uniform standards, with more than 3,600 companies affected in Germany alone.
US Market Size
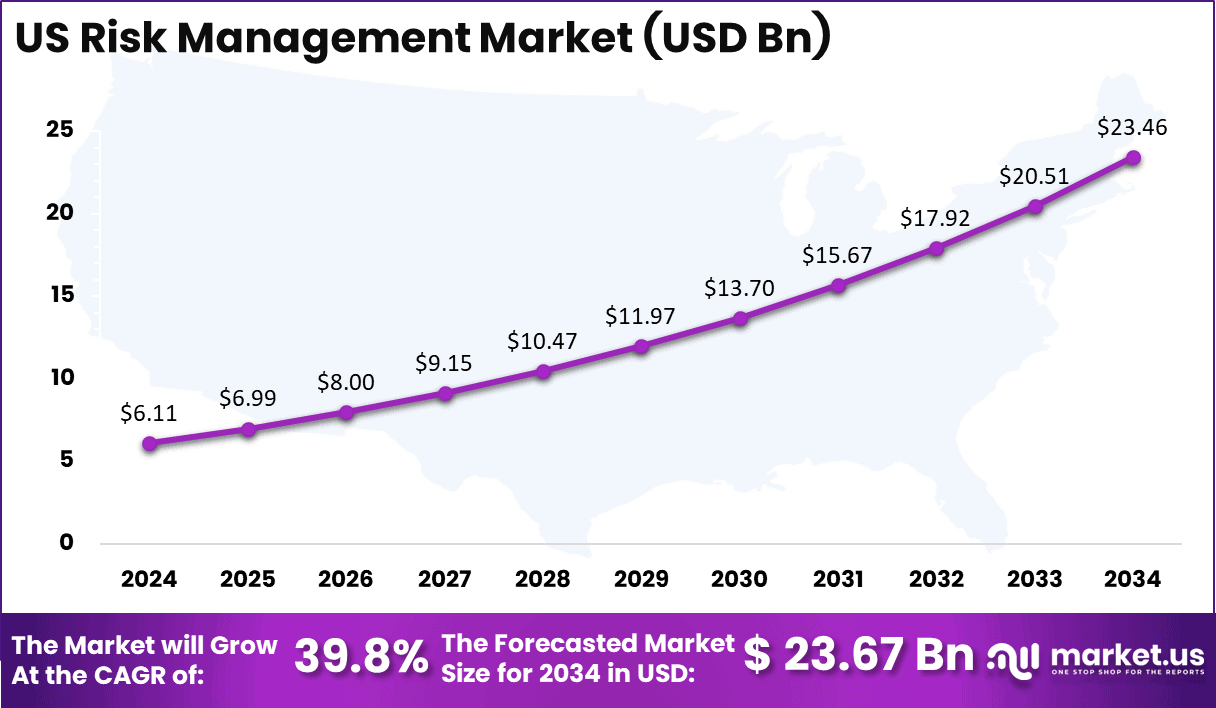
The US risk management market is witnessing robust growth, expanding rapidly across financial institutions, IT enterprises, and manufacturing sectors. It is projected to record an impressive growth rate of around 39.8%, reaching approximately USD 23.67 billion by 2034. This surge is primarily driven by the rising demand for AI-based predictive analytics, cloud security frameworks, and regulatory compliance tools across American enterprises.
Financial institutions and insurance firms are particularly increasing their technology spending to mitigate operational, cybersecurity, and compliance risks. Additionally, the growing integration of data-driven platforms and digital ecosystems has amplified the need for advanced governance and risk visibility solutions.
Key Regions and Countries
North America
- US
- Canada
Europe
- Germany
- France
- The UK
- Spain
- Italy
- Rest of Europe
Asia Pacific
- China
- Japan
- South Korea
- India
- Australia
- Rest of APAC
Latin America
- Brazil
- Mexico
- Rest of Latin America
Middle East and Africa
- GCC
- South Africa
- Rest of MEA
Market Dynamics
Drivers
| Driver | (~) % Impact on CAGR Forecast | Geographic Relevance | Impact Timeline |
|---|---|---|---|
| Cyber-resilience compliance mandates | +2.4% | North America and Europe | Short term (2 years or less) |
| Third-party risk oversight | +1.9% | Global enterprise markets | Short term (2 years or less) |
| Cloud control expansion | +1.7% | Global | Medium term (2 to 4 years) |
| Board-level risk accountability | +1.5% | Listed-company markets | Short term (2 years or less) |
| Insurance underwriting digitization | +1.2% | North America, Europe and Asia-Pacific | Medium term (2 to 4 years) |
| Operational resilience modernization | +1.0% | Financial services and critical infrastructure | Medium term (2 to 4 years) |
Cyber-resilience compliance mandates
Mandatory cyber-resilience reporting is turning risk management into a recurring operating requirement. The SEC’s 2023 rules require material cyber incidents to be disclosed within 4 business days, while DORA became applicable on 17 January 2025 after entering into force on 16 January 2023. These rules increase demand for continuous control monitoring, incident workflows, resilience testing, and third-party risk management.
SEC annual cybersecurity disclosures apply to fiscal years ending on or after 15 December 2023, with Inline XBRL tagging beginning for fiscal years ending on or after 15 December 2024. Together with DORA requirements, these mandates could contribute around +2.4% to the market’s 16.2% baseline CAGR by increasing recurring software, integration, and managed-service spending.
Restraints
| Restraint | (~) % Impact on CAGR Forecast | Geographic Relevance | Impact Timeline |
|---|---|---|---|
| Fragmented data residency rules | -2.1% | Europe, Asia-Pacific and Middle East | Short term (2 years or less) |
| Risk-platform budget compression | -1.7% | Global mid-market | Short term (2 years or less) |
| Legacy-system replacement costs | -1.5% | Global regulated industries | Medium term (2 to 4 years) |
| Procurement security restrictions | -1.2% | Government and critical infrastructure | Medium term (2 to 4 years) |
| Small-enterprise implementation barriers | -1.0% | Emerging markets and global mid-market | Short term (2 years or less) |
| Vendor concentration concerns | -0.8% | Europe and North America | Medium term (2 to 4 years) |
Fragmented data residency rules
Fragmented data-residency and cross-border rules restrict centralized risk-platform deployments by forcing enterprises to use regional hosting, local legal reviews, and separate data environments. India’s Digital Personal Data Protection Act was enacted in 2023, while GDPR continues to require safeguards for transfers of personal data outside the EEA.
GDPR fines can reach the higher of €20 million or 4% of global annual turnover, while India allows penalties of up to ₹250 crore for certain security failures. These compliance risks can delay multinational deployments and reduce initial project scope, creating an estimated -2.1% drag on the market’s 16.2% baseline CAGR.
Challenges
| Challenge | (~) % CAGR Friction Drag | Geographic Relevance | Mitigation Horizon |
|---|---|---|---|
| Risk data quality gaps | -1.8% | Global | Medium term (2 to 4 years) |
| Cybersecurity talent scarcity | -1.6% | Global | Medium term (2 to 4 years) |
| Model explainability demands | -1.3% | North America, Europe and Asia-Pacific | Medium term (2 to 4 years) |
| Supply-chain visibility limits | -1.1% | Global manufacturing and retail | Long term (4 years or more) |
| Control taxonomy fragmentation | -0.9% | Global regulated industries | Medium term (2 to 4 years) |
| Continuous threat volatility | -0.8% | Global | Long term (4 years or more) |
Risk data quality gaps
Risk-data quality remains a major operational constraint because enterprises must reconcile inconsistent asset records, supplier data, control evidence, and incident classifications before analytics can produce reliable results. NIST Cybersecurity Framework 2.0, released in 2024, also reinforces governance as an enterprise-wide responsibility, increasing the need for accurate ownership, lineage, and reporting data.
Poor data quality increases manual validation, weakens risk scoring, and forces companies to maintain spreadsheets and point solutions alongside new platforms. NIST includes Govern as 1 of 6 core framework functions, while Basel requirements emphasize timely and accurate risk reporting during stress. These challenges could create an estimated -1.8% drag on maximum market growth until organizations strengthen data governance and stewardship models.
Opportunities
| Opportunity | (~) % Potential CAGR Upside | Geographic Relevance | Execution Window |
|---|---|---|---|
| AI-native risk decisioning | +2.2% | Global enterprise markets | Medium term (2 to 4 years) |
| SME embedded risk services | +1.8% | Emerging markets and global mid-market | Medium term (2 to 4 years) |
| Climate scenario monetization | +1.6% | Europe, North America and Asia-Pacific | Long term (4 years or more) |
| Supply-chain risk exchanges | +1.4% | Global trade corridors | Medium term (2 to 4 years) |
| Insurance-linked risk APIs | +1.2% | North America and Europe | Medium term (2 to 4 years) |
| Managed resilience subscriptions | +1.0% | Global mid-market | Short term (2 years or less) |
AI-native risk decisioning
AI-native risk decisioning remains an untapped opportunity because many organizations still use AI only for narrow productivity tasks rather than governed risk decisions. Platforms that combine model monitoring, audit trails, human approval, and workflow automation could reduce analyst handling time per risk case by around 20% to 40%.
Higher automation and lower rework could improve gross margins by roughly 3 to 7 percentage points where data quality and governance are mature. Successful productization could add approximately +2.2% above the market’s 16.2% baseline CAGR by expanding risk platforms into higher-value operational, cyber, credit, supplier, and climate-risk decisioning.
Key Players Analysis
Tier 1 leaders combine broad platform scale with heavy engineering investment. ServiceNow increased 2025 subscription revenue to US$12,883 million and spent US$2,960 million on R&D, equal to 22% of revenue and US$417 million more than 2024, mainly due to higher headcount.
Microsoft also invested around US$80 billion in fiscal 2025 in AI-enabled data centres, while IBM acquired HashiCorp. Moody’s Corporation generated record 2025 revenue of US$7.7 billion, with Moody’s Analytics contributing US$3,599 million, up 9%. Decision Solutions generated US$1,692 million, while recurring revenue represented 97% of segment sales, reinforcing the strength of subscription-based risk analytics.
Tier 2 challengers compete through focused GRC, cyber-risk, and compliance capabilities. FIS Global agreed to acquire Global Payments’ Issuer Solutions business, with a US$12 billion net price after US$1.5 billion of tax assets, and completed the deal in January 2026.
Qualys guided fiscal 2025 revenue to US$656 million to US$662 million after reporting US$164.1 million in the second quarter. BitSight exceeded US$200 million in ARR and acquired Cybersixgill for US$115 million, while LogicGate raised US$113 million in Series C funding, taking total funding to US$156 million. NAVEX Global serves 13,000 customers and 88 million employees.
Top Key Players in the Market
- NAVEX Global
- Riskonnect, Inc.
- ServiceNow
- Oracle Corporation
- MetricStream
- SAS Institute Inc.
- Qualys, Inc.
- BitSight
- FIS Global
- Fiserv
- IBM Corporation
- LogicGate, Inc.
- Microsoft Corporation
- Moody’s Corporation
Recent Developments
- In February 2025, IBM Corporation closed its acquisition of HashiCorp for $35 per share in cash, a $6.4 billion enterprise value, and folded Terraform and Vault into IBM Software for hybrid cloud security and infrastructure automation.
- In March 2025, ServiceNow signed a definitive agreement to buy Moveworks for $2.85 billion in cash and stock, more than 20 times Moveworks’ 2024 revenue, and completed the deal on 15 December 2025.
- In April 2025, FIS Global agreed to acquire 100% of Global Payments’ Issuer Solutions business for a $13.5 billion enterprise value, a $12 billion net purchase price, and sold its 45% Worldpay stake for $6.6 billion at about 10.5 times expected 2025 EBITDA.
- In December 2025, Microsoft Corporation committed US$17.5 billion over CY 2026 to 2029 to India’s cloud and AI infrastructure, its largest Asia investment, expanding data centre regions in Chennai, Hyderabad and Pune on top of a US$3 billion 2025 commitment.
- In June 2026, Oracle Corporation reported fiscal 2026 capital spending of $55.66 billion against a $50 billion plan, raised $43 billion in debt and $5 billion in equity, and guided fiscal 2027 capital expenditure up to $95 billion for AI cloud capacity.
Report Scope
| Report Features | Description |
|---|---|
| Market Value (2024) | USD 15.8 billion |
| Forecast Revenue (2034) | USD 70.9 billion |
| CAGR (2025-2034) | 16.2% |
| Base Year for Estimation | 2024 |
| Historic Period | 2020-2023 |
| Forecast Period | 2025-2034 |
| Report Coverage | Revenue Forecast, Market Dynamics, Competitive Landscape, Recent Developments |
| Segments Covered | By Component (Solutions, Risk Assessment and Analysis, Risk Control and Monitoring, Risk Reporting and Analytics, Others, Services, Professional Services, Managed Services); By Deployment (On-Premises, Cloud-Based); By Risk Type (Financial Risk Management, Compliance Risk Management, Cybersecurity Risk Management, Enterprise Risk Management, Operational Risk Management, Others); By Organization Size (Large Enterprises, Small and Medium-Sized Enterprises); By End Use (BFSI, IT and Telecom, Government, Defense, and Aerospace, Healthcare and Life Science, Retail and Consumer Goods, Manufacturing, Energy and Utilities, Others) |
| Regional Analysis | North America – US, Canada; Europe – Germany, France, The UK, Spain, Italy, Rest of Europe; Asia Pacific – China, Japan, South Korea, India, Australia, Singapore, Rest of APAC; Latin America – Brazil, Mexico, Rest of Latin America; Middle East & Africa – GCC, South Africa, Rest of MEA |
| Competitive Landscape | NAVEX Global, Riskonnect, Inc., ServiceNow, Oracle Corporation, MetricStream, SAS Institute Inc., Qualys, Inc., BitSight, FIS Global, Fiserv, IBM Corporation, LogicGate, Inc., Microsoft Corporation, Moody’s Corporation |
| Customization Scope | Customization for segments and region/country-level will be provided. Additional customization can be done based on requirements. |
| Purchase Options | We have three licenses to opt for: Single User License, Multi-User License (Up to 5 Users), Corporate Use License (Unlimited Users and Printable PDF) |





























