


Report Overview
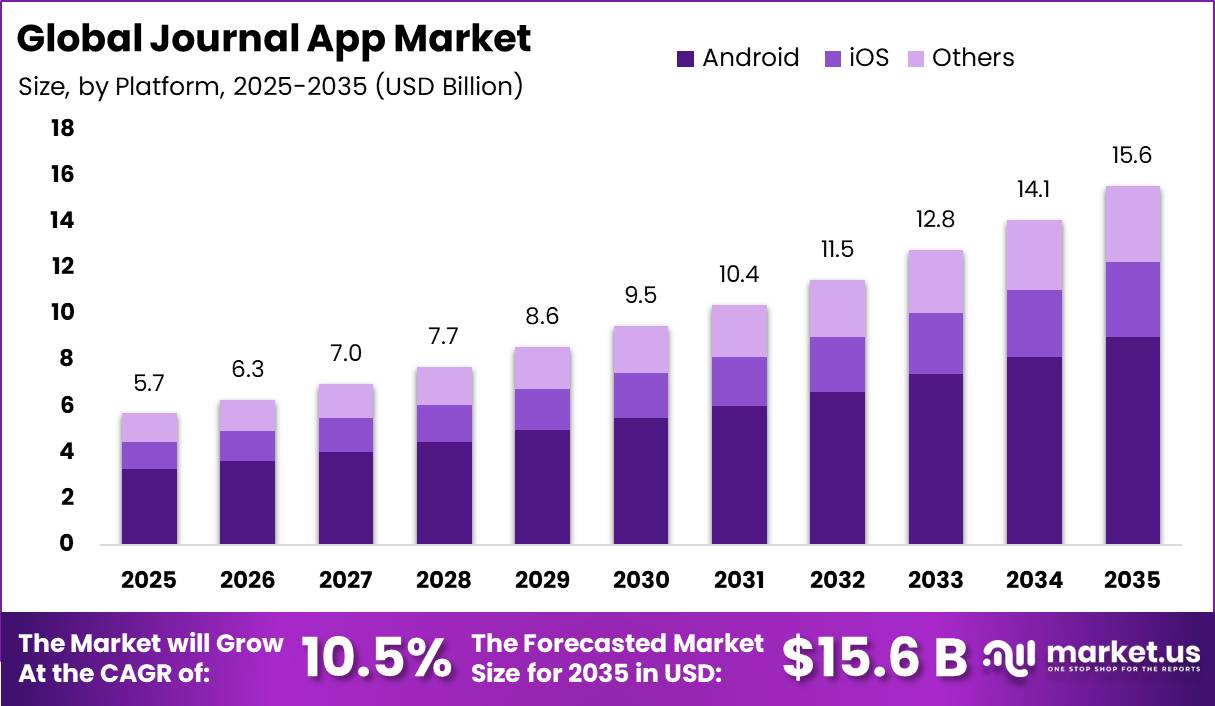
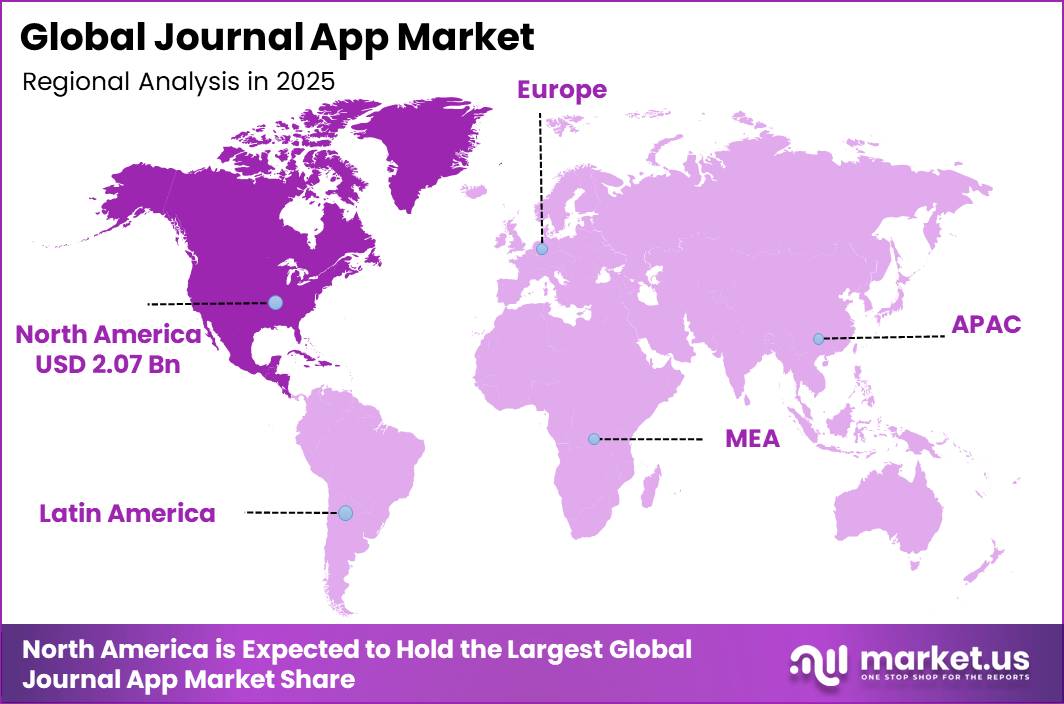
In 2025, the Global Journal App Market was valued at USD 5.7 billion. The market is projected to grow at a CAGR of 10.5% during 2026–2035, reaching approximately USD 15.6 billion by 2035. North America dominated the global market in 2025, accounting for more than 36.4% of the total market share and generating approximately USD 2.07 billion in revenue.
More than 1 billion people worldwide live with a mental health condition, while depression and anxiety cause nearly USD 1 trillion in lost productivity and around 12 billion working days every year. However, mental health receives only about 2% of average government health budgets.
Spending ranges from just USD 0.04 per person in low-income countries to nearly USD 65 in high-income countries, while the global median is only 13 mental health workers per 100,000 people. This gap is encouraging people to use affordable self-care tools such as journal apps. Evidence also shows that every USD 1 invested in depression and anxiety treatment can generate about USD 4 in health and productivity benefits.
Digital access supports this strong position. Around 5.5 billion people were online in 2024, representing 68% of the global population and an increase of 227 million users. Mobile subscriptions reached 9.1 billion, or 112 per 100 people. Internet penetration exceeds 93% in high-income economies, compared with only 27% in low-income countries. Global internet-user growth also increased from 2.7% in 2023 to 3.4% in 2024.
Key Takeaway
- The Journal App Market was valued at USD 5.7 billion in 2025 and is projected to reach USD 15.6 billion by 2035, growing at a CAGR of 10.5%.
- Android led the Journal App Market with a 57.8% share, supported by its broad global smartphone reach.
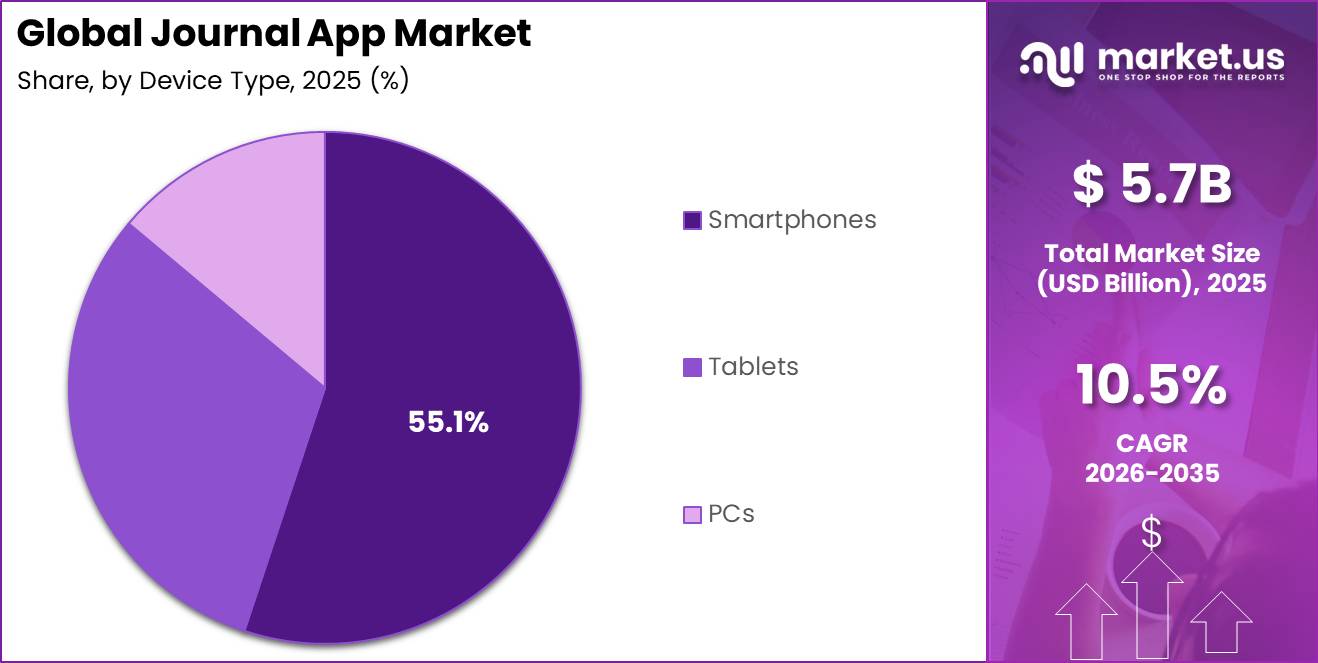
- Smartphones dominated the device segment with a 55.1% share, driven by their role as the primary internet access device.
- North America led the market in 2025 with a 36.4% share, generating approximately USD 2.07 billion in revenue.
Market Statistics and Data Insights
- The global mental-health burden is creating demand for low-cost self-reflection tools. WHO reported in 2025 that more than 1 billion people worldwide live with a mental health condition. Depression and anxiety cost the global economy about USD 1 trillion annually, while around 12 billion working days are lost every year.
- WHO’s Mental Health Atlas also found that mental health receives only 2% of health budgets, with a global median of just 13 mental-health workers per 100,000 people.
- The potential digital user base has reached unprecedented scale. ITU estimates that around 6 billion people, or 74% of the global population, used the internet in 2025, up from 60% in 2020. About 1.3 billion people came online during those five years, although another 2.2 billion remain offline.
- Direct evidence from a major journal-app provider shows meaningful user engagement. Day One reports more than 15 million downloads, approximately 500,000 active users per month, and over 200,000 five-star ratings worldwide. Its privacy page also reports that users have created more than 4 million journals.
- Mobile app-store reach provides journal developers with very large distribution capacity. Apple reported more than 850 million average weekly App Store users across 175 countries and regions in 2025.
- Developers selling digital goods and services have earned more than USD 550 billion since 2008, while the broader App Store ecosystem facilitated approximately USD 1.3 trillion in developer billings and sales during 2024.
- App-store commissions can materially reduce subscription economics for independent journal developers. Apple states that its standard commission on digital goods and services is 30%, while qualifying subscriptions and developers enrolled in specified programs may pay 15%. The Small Business Program’s 15% rate applies to eligible developers with up to USD 1 million in prior-year App Store proceeds.
- Privacy sensitivity creates a substantial compliance burden because journal entries can contain highly personal information. GDPR penalties can reach EUR 20 million or 4% of worldwide annual turnover.
- Consumer behavior also shows strong privacy expectations: 76.9% of EU internet users took action to protect personal data in 2025, 58.8% refused advertising use of their personal information, and 56.2% restricted access to their location.
- Digital wellness remains a strong adjacent opportunity. In 2025, 64% of EU internet users searched online for health information. Separate Eurostat data show 24% of EU citizens aged 16–74 searched specifically for mental-health information online.
- Fitness-linked journaling is emerging as a specialist product niche. Eurostat found that 29.9% of EU individuals used smart wearables such as smartwatches and fitness trackers in 2024.
- Day One responded to this behavior with Strava integration and a Fitness Prompt Pack containing 30 prompts in version 2025.22, allowing workout information to become journal entries.
- Workplace and employee-wellness journaling offers a sizeable enterprise use case. WHO estimates that 15% of working-age adults have a mental disorder, while depression and anxiety contribute to 12 billion lost working days and about USD 1 trillion in annual lost productivity.
- Free operating-system-native journaling is creating stronger competition for independent subscription apps. Apple’s Journal app currently carries approximately 315,000 U.S. App Store ratings with an average score of 4.8 out of 5. For comparison, Day One has around 118,000 U.S. ratings at 4.8/5, while Reflectly has around 82,000 ratings at 4.6/5.
By Platform
Android held a 57.8% share of the Journal App Market, supported by its strong position as the most widely used mobile operating system worldwide. GSMA Intelligence indicates that Android accounts for around 80% of active smartphone connections globally, helped by the wide availability of low-cost and mid-range smartphones. This affordability gives Android a major advantage in emerging markets, where users may not have access to premium devices.
Unlike iOS, which is limited to Apple hardware, Android operates across thousands of smartphone models at different price levels, making journal and wellness apps more accessible to users across Asia, Africa, and Latin America. Google also reports that the Play Store reaches more than 2.5 billion monthly active users across over 190 countries, giving journal app developers a broad global distribution network.
This large user base allows app providers to reach underserved populations at relatively low customer-acquisition costs. As smartphone ownership continues to expand and affordable Android devices become more common in developing economies, the platform is expected to remain an important distribution channel for journaling, mental wellness, and self-care applications.
By Device Type
Smartphones held a 55.1% share of the Journal App Market, mainly because they have become the primary way people access the internet worldwide. According to the ITU, around 6 billion people, or 74% of the global population, used the internet in 2025, compared with 60% in 2020. This represents an increase of about 1.3 billion users in five years, with mobile networks supporting a large share of this growth.
Smartphones are especially suitable for journal apps because they stay with users throughout the day, making it easier to record thoughts, track moods, receive reminders, and maintain daily self-care routines. Their built-in cameras, microphones, sensors, and biometric security also allow journal apps to offer features such as voice notes, photo entries, activity tracking, and private access.
Key Market Segments
By Platform
- Android
- iOS
- Others
By Device Type
- Smartphones
- Tablets
- PCs
Geopolitical Impact Analysis
Although journal apps are software-based products, their operations depend heavily on smartphones, cloud servers, data centers, and semiconductor supply chains, making the market sensitive to global trade and energy pressures. The U.S. Trade Representative’s 2026 Trade Policy Agenda confirmed new Section 301 tariffs on Chinese semiconductors, in addition to an existing 50% duty.
The new tariff is being phased in from 0% in 2026 to a higher level by June 2027. Earlier reciprocal U.S. tariffs on Chinese electronics also reached as high as 125% before being partly suspended. These measures can increase the cost of chips used in smartphones and data-center servers, which may raise cloud hosting, storage, and AI-processing expenses for journal app providers.
Energy costs create another operating challenge. Global data-center electricity consumption increased by nearly 20% in 2025 to about 787.8 TWh, while the U.S. accounted for approximately 312.6 TWh, representing 39.7% of global consumption. At the same time, AI-related cloud investment reached around USD 580 billion in 2025, increasing demand for data-center capacity and electricity.
Higher power requirements can raise hosting and infrastructure expenses for cloud-based journal apps. In addition, Section 232 tariffs of around 25% on steel and aluminum, along with Canadian retaliatory tariffs covering roughly USD 20 billion of U.S. goods, can increase the cost of smartphones and server hardware. These combined pressures may affect operating margins, subscription pricing, and consumer access to journal applications.
Regional Analysis
North America remained the dominant region in the Journal App Market, accounting for a 36.4% share and approximately USD 2.07 billion in revenue in 2025. The region’s strong position is supported by a high mental health burden and widespread digital access. SAMHSA reported that 61.5 million U.S. adults, or 23.4%, experienced some form of mental illness in 2024, compared with 58.7 million in 2023.
In addition, 19.1% of adults live with an anxiety disorder, while 21.4 million people experienced major depression. However, only 14.0% of adults received counseling, and 19.3% used medication in 2024, indicating a sizeable care gap. This creates opportunities for affordable, self-guided tools such as journal apps.
Asia Pacific is emerging as the fastest-growing region, mainly due to rapid expansion in mobile and internet connectivity. Internet penetration reached 66% in 2024, while the region’s internet-user base has expanded at an average annual rate of 10.7% since 2005, compared with the global rate of 8%.
Mobile broadband subscriptions reached 97 per 100 inhabitants, while 5G coverage increased from only 3% of the population in 2020 to 62% in 2024. Internet adoption among people aged 15–24 reached 81%. China and India together also represent more than 3 billion mobile subscriptions, creating a large potential user base for affordable wellness and journaling applications.
Key Regions and Countries
North America
- US
- Canada
Europe
- Germany
- France
- The UK
- Spain
- Italy
- Rest of Europe
Asia Pacific
- China
- Japan
- South Korea
- India
- Australia
- Rest of APAC
Latin America
- Brazil
- Mexico
- Rest of Latin America
Middle East & Africa
- GCC
- South Africa
- Rest of MEA
Market Dynamics
Drivers
| Driver | (~) % CAGR | Geographic Relevance | Impact Timeline |
|---|---|---|---|
| AI-native journaling features embedded in productivity suites | +2.8% | North America, Western Europe | Short term (2 years or less) |
| Rising smartphone-first internet adoption in emerging markets | +2.1% | Asia Pacific, Latin America | Medium term (2 to 4 years) |
| Subscription monetization shift from one-time purchase to recurring billing | +1.6% | Global | Short term (2 years or less) |
| Employer-sponsored digital wellness benefit programs | +1.2% | North America | Medium term (2 to 4 years) |
| Wearable and biometric sensor data integration into journaling apps | +0.9% | North America, East Asia | Medium term (2 to 4 years) |
AI-native journaling features embedded in productivity suites
Large productivity platforms are increasingly adding generative AI, summarization, and mood-related insights directly into existing note-taking tools. This trend accelerated from 2024, as major cloud software vendors introduced AI copilots within notebook and productivity applications, reducing the need for separate journaling tools.
AI add-ons are commonly priced near USD 30 per user per month, while SaaS benchmarks suggest AI features can improve paid conversion rates by around 3 to 5 percentage points. Enterprise AI software attach rates also increased by roughly 20% year over year through 2025. This shift strengthens large bundled platforms while increasing customer acquisition pressure and margin challenges for standalone journal app developers.
Restraints
| Restraint | (~) % CAGR | Geographic Relevance | Impact Timeline |
|---|---|---|---|
| Data privacy regulations restricting cross-border personal data storage | -1.4% | European Union, India | Short term (2 years or less) |
| High app-store commission fees compressing developer margins | -1.1% | Global | Short term (2 years or less) |
| Consumer subscription fatigue reducing willingness to pay for niche apps | -0.8% | North America, Western Europe | Medium term (2 to 4 years) |
| Elevated interest rates limiting venture funding for early-stage app developers | -0.6% | North America, Europe | Short term (2 years or less) |
Data privacy regulations restricting cross-border personal data storage
Journal app developers face rising compliance pressure from stricter data-protection and localization rules. Regulations such as the EU’s GDPR and India’s Digital Personal Data Protection framework, with phased compliance through 2025 and 2026, are increasing requirements around how sensitive personal data is stored and managed.
Smaller developers may face around 15% to 25% higher annual hosting costs when setting up region-specific cloud infrastructure. GDPR penalties can also reach up to 4% of global annual turnover for serious violations. These higher compliance costs can slow international expansion, increase capital requirements, and give larger platform companies an advantage over smaller independent journal app providers.
Challenges
| Challenge | (~) % CAGR | Geographic Relevance | Mitigation Horizon |
|---|---|---|---|
| User retention and churn management | -1.3% | Global | Medium term (2 to 4 years) |
| AI engineering talent scarcity | -0.9% | North America, East Asia | Long term (4 years or more) |
| Cross-platform feature parity maintenance | -0.7% | Global | Medium term (2 to 4 years) |
| Cloud compute cost volatility | -0.5% | North America, Europe | Medium term (2 to 4 years) |
User retention and churn management
Journal apps face a major retention challenge because regular use depends strongly on user habits. Habit-based wellness apps can see first-month retention fall below 25% without regular reminders and engagement tools. At the same time, customer acquisition costs for wellness apps have increased by around 18% since 2024, putting additional pressure on developers.
At subscription prices of around USD 5 to USD 10 per month, developers may need to retain users for an additional 4 to 6 months to recover acquisition costs. Long-term growth therefore depends on stronger personalization, streak-based engagement, and related habit-tracking features. Raising 12-month retention above 40% could help journal app providers achieve more sustainable customer economics and recurring revenue.
Opportunities
| Opportunity | (~) % CAGR | Geographic Relevance | Execution Window |
|---|---|---|---|
| B2B licensing to corporate mental wellness and HR benefit platforms | +2.2% | North America, Europe | Medium term (2 to 4 years) |
| White-label journaling SDKs for healthcare and telemedicine providers | +1.7% | Global | Long term (4 years or more) |
| Untapped penetration in Sub-Saharan Africa and Southeast Asia feature-phone-to-smartphone transition | +1.3% | Sub-Saharan Africa, Southeast Asia | Long term (4 years or more) |
| Consolidation of fragmented independent apps through roll-up acquisitions | +0.9% | Global | Medium term (2 to 4 years) |
B2B licensing to corporate mental wellness and HR benefit platforms
Enterprise wellness licensing remains a largely untapped opportunity for journal app developers, as most current revenue still comes from direct consumer subscriptions. Corporate wellness contracts can generate around USD 8 to USD 15 per employee annually, which is roughly 3 to 4 times higher than the effective annual revenue per user earned through app-store subscriptions after commission deductions.
Enterprise contracts can also improve margins because they avoid app-store commissions of around 15% to 30%. Corporate benefit contracts may achieve annual renewal rates above 85%, while consumer subscriptions generally experience higher churn. Developers that offer compliant, HR-integrated journaling platforms could therefore capture a larger share of corporate wellness spending currently directed mainly toward broader employee assistance programs.
Key Players Analysis
The Journal App Market has a clear gap between large platform companies and smaller independent app developers. Microsoft Corporation represents the top tier through its Productivity and Business Processes segment, which generated USD 120.8 billion in FY2025 revenue, up 13% year over year. Microsoft 365 Commercial cloud revenue also increased 18%, supported by wider use of Copilot AI features priced at around USD 30 per user per month.
These tools strengthen journaling, note-taking, and productivity functions through products such as OneNote and give Microsoft a major distribution advantage. Automattic, the parent company of WordPress and Day One, is another strong player, with estimated annual revenue of about USD 710 million to USD 891.9 million, a peak valuation of USD 7.5 billion, and around USD 896 million raised across 7 funding rounds.
Tier-2 companies such as Diarium, Habitics s.r.o., Waffle Journal, Daybook Labs, Pixel Crater, Pixite, Penzu, HappyFeed, and Reflectly compete mainly through subscriptions, app-store visibility, and niche features. Reflectly, operating since 2017, offers subscriptions at around USD 9.99 per month or USD 59.99 per year, but reportedly generates less than USD 5,000 in monthly revenue from fewer than 5,000 monthly downloads.
This highlights the fragmented nature of the independent journal-app segment. Microsoft’s USD 120.8 billion segment revenue is also roughly 16 times Automattic’s USD 7.5 billion peak valuation, showing how strongly large technology platforms can influence AI-driven journaling and productivity features.
Top Key Players in the Market
- Microsoft Corporation
- Automattic
- Diarium
- Habitics s.r.o.
- Waffle Journal
- Daybook Labs Inc
- Pixel Crater Ltd.
- Pixite
- Penzu Inc.
- HappyFeed Inc.
- Reflectly
Recent Developments
- In 2026, Automattic-owned Day One launched Day One Gold on March 30, 2026, through version 2026.7, introducing AI-powered journaling across 5 platforms: iPhone, iPad, Android, Web, and Windows. The Gold plan is priced at USD 74.99 per year, compared with USD 49.99 per year for the Silver plan.
- In 2025, Microsoft introduced Copilot Notebooks in OneNote, transforming OneNote into an AI-powered workspace for note-taking and knowledge management. Users can add more than 20 references, while Copilot uses up to the first 20 references for grounding AI responses. The system supports at least 6 file/content formats.
Report Scope
| Report Features | Description |
|---|---|
| Market Value (2025) | USD 5.7 Billion |
| Forecast Revenue (2035) | USD 15.6 Billion |
| CAGR (2026-2035) | 10.5% |
| Base Year for Estimation | 2025 |
| Historic Period | 2020-2024 |
| Forecast Period | 2026-2035 |
| Report Coverage | Revenue Forecast, Market Dynamics, Competitive Landscape, Recent Developments |
| Segments Covered | By Platform (Android, iOS, Others), By Device Type (Smartphones, Tablets, PCs) |
| Regional Analysis | North America – US, Canada; Europe – Germany, France, The UK, Spain, Italy, Rest of Europe; Asia Pacific – China, Japan, South Korea, India, Australia, Singapore, Rest of APAC; Latin America – Brazil, Mexico, Rest of Latin America; Middle East & Africa – GCC, South Africa, Rest of MEA |
| Competitive Landscape | Microsoft Corporation, Automattic, Diarium, Habitics s.r.o., Waffle Journal, Daybook Labs Inc., Pixel Crater Ltd., Pixite, Penzu Inc., HappyFeed Inc., Reflectly |
| Customization Scope | We will provide customization for segments and region/country levels. Moreover, additional customization can be done based on the requirements. |
| Purchase Options | We have three licenses to opt for: Single User License, Multi-User License (Up to 5 Users), Corporate Use License (Unlimited Users and Printable PDF) |





























