


Report Overview
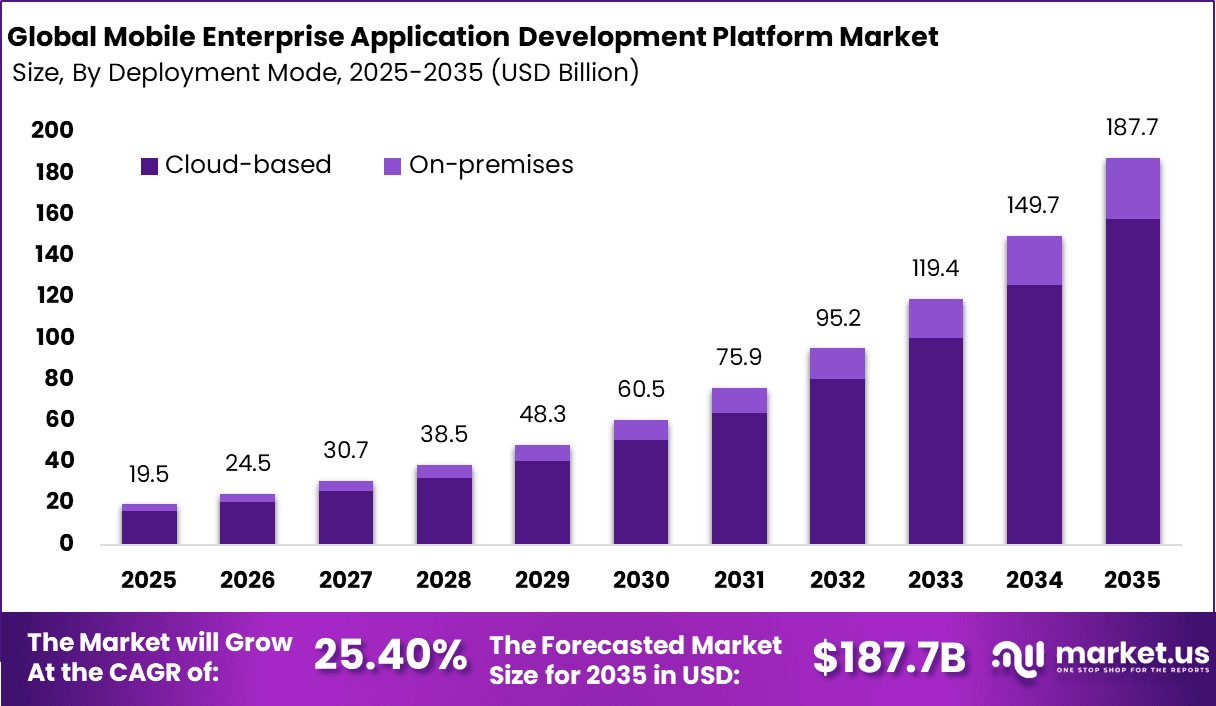
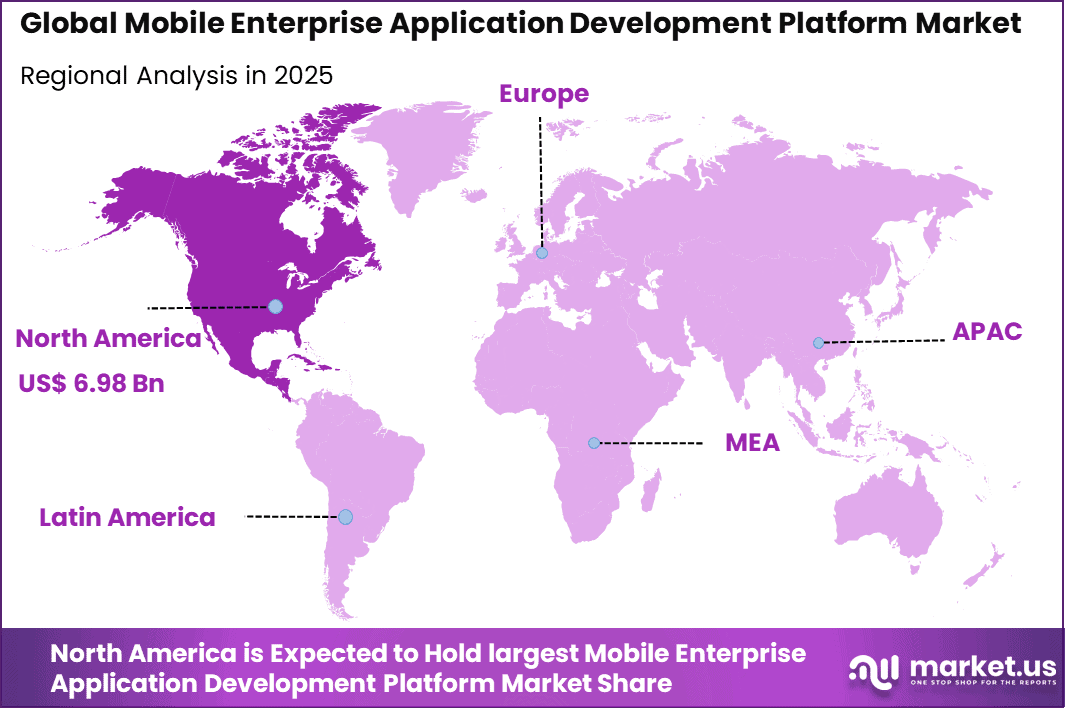
The Global Mobile Enterprise Application Development Platform Market generated USD 19.5 billion in 2025 and is predicted to register growth from USD 24.5 billion in 2026 to about USD 187.7 billion by 2035, recording a CAGR of 25.4% throughout the forecast span. In 2025, North America held a dominant market position, capturing more than a 35.8% share, with USD 6.98 billion in revenue.
Mobile enterprise application development platform market refers to the range of software tools and frameworks that organisations use to build, deploy, and manage business-grade mobile applications. These platforms provide capabilities such as visual development environments, reusable components, backend integration, security features, and cross-platform support for iOS and Android devices.
Enterprises use these tools to create mobile apps that improve internal processes, enhance customer engagement, and extend core business functions to employee and customer devices. The market includes low-code, no-code, and traditional development platforms tailored to meet enterprise requirements for scalability, security, and performance.
Traditional development approaches can be slow and resource-intensive, prompting enterprises to adopt platforms that accelerate delivery through visual tools, reusable assets, and integrated services. Rising adoption of cloud infrastructure and APIs also supports seamless backend integration for mobile solutions. Security requirements and the need to manage applications across diverse device fleets further reinforce investment in dedicated enterprise platforms.
Demand analysis shows that interest in mobile enterprise application development platforms continues to grow as digital transformation becomes central to business strategy. Companies across finance, healthcare, retail, and logistics are investing in mobile solutions that improve operational efficiency and customer experience. Low-code and no-code offerings lower barriers for business units to participate in app development, while IT teams maintain governance and security.
Top Market Takeaways
- By platform, low-code/no-code development platforms captured 46.5% of the mobile enterprise application development platform market, enabling faster app creation with minimal coding expertise.
- By deployment mode, cloud-based platforms dominated with an 84.2% share, providing flexible scalability and seamless updates for enterprise needs.
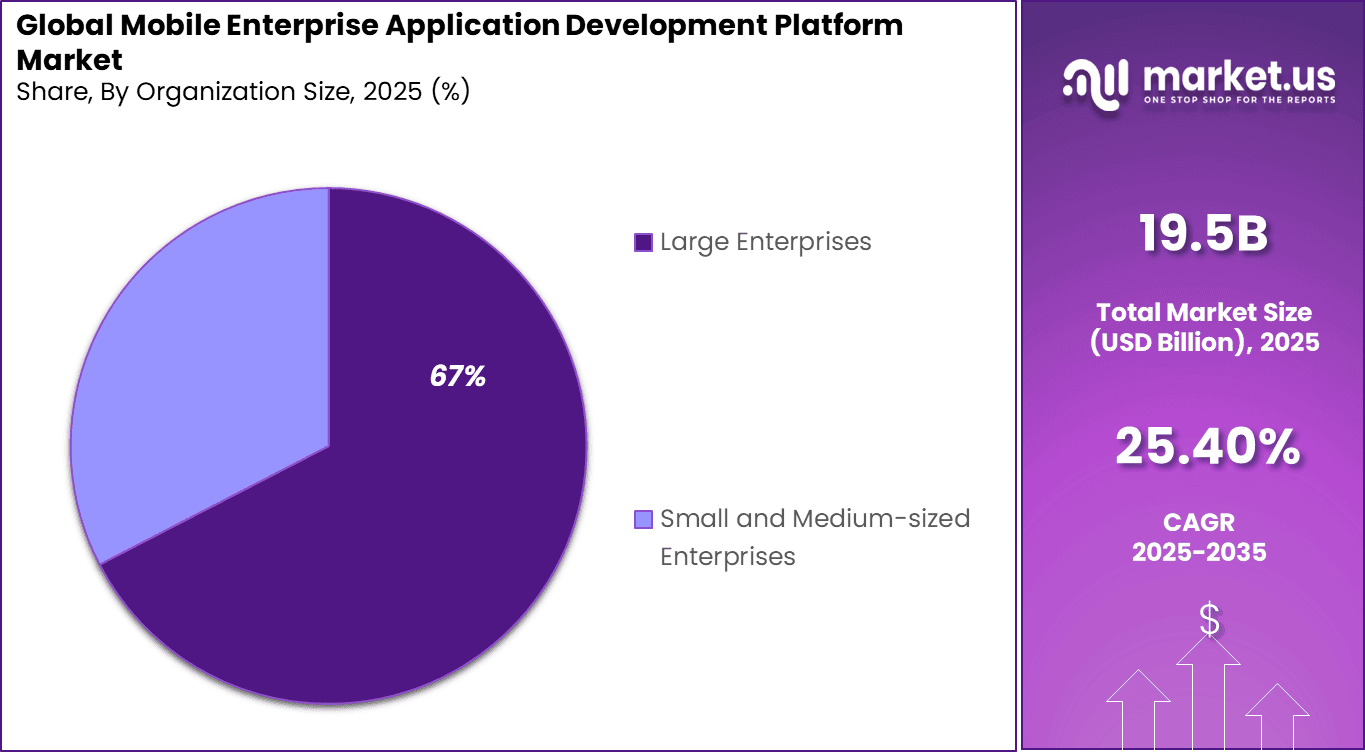
- By organization size, large enterprises accounted for 67.4%, adopting these platforms to streamline complex mobile app development at scale.
- By application type, employee-facing applications led at 52.8%, focusing on internal tools for productivity and workflow efficiency.
- By end-user industry, IT and telecommunications held 41.7%, leveraging mobile platforms for customer engagement and operational apps.
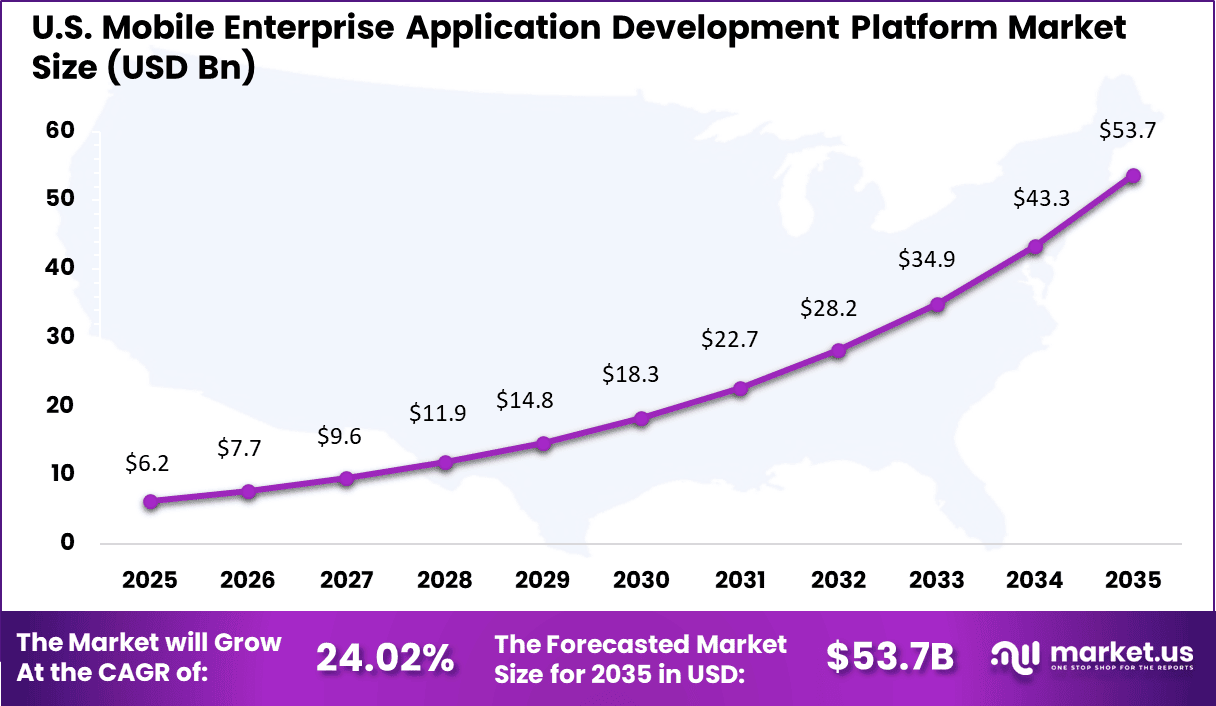
- North America represented 35.8% of the global market, with the U.S. valued at USD 6.24 billion and growing at a CAGR of 24.02%.
Platform Analysis
Low-code and no-code development platforms account for 46.5% of the Mobile Enterprise Application Development Platform market, reflecting strong demand for faster and simplified application creation. These platforms allow users to build mobile applications using visual interfaces, prebuilt components, and minimal coding.
From an operational perspective, low-code and no-code platforms improve collaboration between IT teams and business users. They support rapid prototyping and easier customization of mobile applications. The strong share of this segment reflects enterprise focus on agility, cost efficiency, and accelerated digital application delivery.
Deployment Mode Analysis
Cloud-based deployment dominates the market with 84.2%, showing a clear preference for scalable and flexible platforms. Cloud deployment enables enterprises to develop, test, and deploy mobile applications without maintaining complex infrastructure. Development teams can access tools and resources from any location, supporting distributed work environments.
Cloud platforms also allow frequent updates and integration with other enterprise systems. They reduce operational overhead and support faster innovation cycles. The strong adoption of cloud-based deployment highlights the importance of flexibility and speed in modern enterprise application development.
Organization Size Analysis
Large enterprises represent 67% of market adoption, driven by their need to support multiple mobile applications across departments. These organizations manage complex workflows and large user bases that require secure and scalable mobile solutions. Development platforms help standardize application development and reduce duplication of effort.
Large enterprises also require governance, security, and compliance features. Mobile application development platforms provide centralized control and monitoring. The strong presence of this segment reflects the role of these platforms in supporting enterprise-wide mobility strategies.
Application Type Analysis
Employee-facing applications account for 52.8% of application demand, making them the largest use case in the market. These applications support internal functions such as workforce management, communication, and task execution. Enterprises use mobile apps to improve productivity and enable employees to work efficiently from any location.
These applications also support real-time access to enterprise data and systems. Development platforms help organizations update employee apps quickly as processes evolve. The strong share of this segment reflects growing focus on internal digital tools that enhance workforce efficiency.
Key Market Segments
By Platform
- Low-code/No-code Development
- Professional Developer-centric
- Cross-platform & Hybrid Development
- Others
By Deployment Mode
- On-premises
- Cloud-based
By Organization Size
- Large Enterprises
- Small and Medium-sized Enterprises
By Application Type
- Customer-facing Applications
- Employee-facing Applications
- Operational Applications
- Others
By End-User Industry
- IT & Telecommunications
- Banking, Financial Services, and Insurance
- Healthcare
- Retail & E-commerce
- Manufacturing
- Others
Regional Analysis
North America accounted for a 35.8% share, supported by strong enterprise mobility adoption and high demand for rapid application development across industries. Organizations in the region have widely adopted mobile enterprise application development platforms to build, deploy, and manage secure mobile applications for employees and customers.
Demand has been driven by the expansion of remote work, field service mobility, and digital customer engagement initiatives. Enterprises have focused on low-code and rapid development capabilities to shorten development cycles and reduce dependency on specialized development resources.
The U.S. market reached USD 6.24 Bn and is projected to grow at a 24.02% CAGR, reflecting strong investment in enterprise software modernization and mobile-first strategies. Adoption has been particularly strong among large enterprises, government agencies, and regulated industries that require secure and compliant mobile applications.
Mobile enterprise application development platforms have helped U.S. organizations accelerate innovation while maintaining governance and security controls.
Key Regions and Countries
- North America
- US
- Canada
- Europe
- Germany
- France
- The UK
- Spain
- Italy
- Russia
- Netherlands
- Rest of Europe
- Asia Pacific
- China
- Japan
- South Korea
- India
- Australia
- Singapore
- Thailand
- Vietnam
- Rest of APAC
- Latin America
- Brazil
- Mexico
- Rest of Latin America
- Middle East & Africa
- South Africa
- Saudi Arabia
- UAE
- Rest of MEA
Market Dynamics
Drivers
| Driver | (~) % CAGR Forecast | Geographic Relevance | Impact Timeline |
|---|---|---|---|
| Low-Code Workflow Mobilization | +3.2% | Global | Short term (2 years or less) |
| Cloud-Native Mobile Backends | +2.4% | North America, Europe, Asia Pacific | Short term (2 years or less) |
| Frontline Workforce Digitization | +1.9% | Global | Medium term (2 to 4 years) |
| API-First Core Modernization | +1.7% | North America, Europe, Asia Pacific | Medium term (2 to 4 years) |
| Security-by-Design Procurement | +1.3% | North America, Europe | Short term (2 years or less) |
| 5G Enterprise Mobility | +1.2% | Asia Pacific, North America, Europe | Medium term (2 to 4 years) |
Low-Code Workflow Mobilization
The strongest active growth force is the shift from custom-coded mobile projects to configurable, low-code workflow delivery, because enterprises are trying to convert dispersed field, service, sales, and operations processes into mobile-first applications without expanding full-stack engineering teams at the same pace.
Eurostat reported that 52.7% of EU enterprises used paid cloud services in 2025, up 7.4 percentage points from 2023, while ITU estimated in 2024 that 4 out of 5 people over age 10 owned a mobile phone and that 5G coverage reached 51% of the global population.
Restraints
| Restraint | (~) % CAGR Forecast | Geographic Relevance | Impact Timeline |
|---|---|---|---|
| Cross-Border Data Barriers | -2.4% | Europe, China, India, regulated global markets | Short term (2 years or less) |
| Legacy System Lock-In | -1.8% | Global | Medium term (2 to 4 years) |
| Security Approval Delays | -1.5% | North America, Europe, public sector markets | Short term (2 years or less) |
| Budget Scrutiny on SaaS | -1.2% | Global | Short term (2 years or less) |
| Device Fleet Fragmentation | -0.9% | Asia Pacific, Latin America, Africa | Medium term (2 to 4 years) |
| Vendor Risk Consolidation | -0.8% | North America, Europe | Short term (2 years or less) |
Cross-Border Data Barriers
The most material restraint is the immediate restriction created by fragmented cross-border data and residency rules, because enterprise mobile applications commonly process employee identity, customer records, location signals, device telemetry, and workflow data across cloud regions. The European Commission states that GDPR enforcement can include a processing ban and fines of up to €20 million or 4% of total annual worldwide turnover.
For MEAP vendors, the bottleneck is not only legal review but also duplicate hosting, regional encryption controls, local audit logs, and separate data-processing agreements, which can add roughly 10% to 18% to delivery effort for regulated deployments and delay enterprise rollouts by about 8 to 16 weeks. The strategic impact is a -2.4% deduction to the CAGR forecast, as multinational deals are split into smaller regional phases, and margin is compressed by compliance engineering.
Challenges
| Challenge | (~) % CAGR | Geographic Relevance | Mitigation Horizon |
|---|---|---|---|
| Skilled Delivery Scarcity | -2.0% | Global | Medium term (2 to 4 years) |
| Integration Debt Accumulation | -1.7% | Global | Long term (4 years or more) |
| Mobile Security Complexity | -1.4% | Global | Medium term (2 to 4 years) |
| Release Governance Friction | -1.1% | North America, Europe, Asia Pacific | Medium term (2 to 4 years) |
| Offline Sync Reliability | -0.9% | Emerging markets, field-intensive industries | Medium term (2 to 4 years) |
| Analytics Governance Gaps | -0.7% | Global | Long term (4 years or more) |
Skilled Delivery Scarcity
The leading challenge is skilled delivery scarcity, because enterprise mobile platforms need a combined capability base across cloud architecture, mobile UX, API integration, identity management, secure coding, testing automation, and business-process design.
The U.S. Bureau of Labor Statistics projects software developer, quality assurance analyst, and tester employment to grow 15% from 2024 to 2034, with about 129,200 openings per year, while ISC2’s 2025 workforce study found that 59% of cybersecurity respondents reported critical or significant skills needs and 95% reported at least one skills need.
OECD digital skills tracking also shows that AI-related vacancy intensity increased by 33% on average from 2019 to 2022. This does not freeze current MEAP sales, but it raises delivery friction by stretching certified implementation teams. The friction drag is estimated at -2.0%, as utilization peaks can extend rollout timelines by roughly 6 to 12 weeks.
Opportunities
| Opportunity | (~) % CAGR | Geographic Relevance | Execution Window |
|---|---|---|---|
| Connected-Device Data Apps | +2.2% | Europe first, global spillover | Medium term (2 to 4 years) |
| AI-Assisted Governance Layers | +2.0% | Europe, North America, Asia Pacific | Medium term (2 to 4 years) |
| Vertical Template Marketplaces | +1.6% | Global | Medium term (2 to 4 years) |
| SME Mobile Modernization | +1.4% | Asia Pacific, Europe, Latin America | Long term (4 years or more) |
| Outcome-Based Lifecycle Services | +1.2% | North America, Europe | Medium term (2 to 4 years) |
| Public-Sector Citizen Apps | +1.0% | Europe, Asia Pacific, Middle East | Long term (4 years or more) |
Connected-Device Data Apps
The largest opportunity is connected-device data applications, which remain a future white space rather than a current driver because many enterprises have not yet converted newly accessible equipment, vehicle, building, and industrial-device data into governed mobile workflows.
If platform vendors build certified connector packs, consent-led data pipelines, and industry templates, gross margin could expand by roughly 4% to 7% as reusable modules replace bespoke integration work, while deployment cost per mobile workflow could decline by around 15% to 25%; this creates a credible +2.2% potential CAGR upside if execution is achieved before vertical specialists occupy the space.
Emerging Trends
| Key Trend | Description |
|---|---|
| Low-code/no-code builders | Visual tools enable rapid app creation without deep coding skills. |
| AI-assisted development | Automation for code generation, testing, and UI design. |
| Progressive web apps | Hybrid solutions combine web speed with native features. |
| Edge computing integration | Offline-capable apps with local processing for latency-sensitive uses. |
| Hyper-personalization engines | Real-time customization based on user data and behavior. |
Growth Factors
| Key Factors | Description |
|---|---|
| BYOD and mobile workforce boom | Demand for custom secure apps on personal devices. |
| Digital transformation initiatives | Enterprises build mobile-first experiences for agility. |
| Developer productivity pressures | Platforms accelerate deployment amid talent shortages. |
| Cloud-native app ecosystems | Scalable hosting reduces infrastructure costs. |
| Regulatory compliance needs | Built-in security for data-sensitive industries. |
Competitive Analysis
The competitive landscape of the mobile enterprise application development platform market is shaped by large enterprise software providers and specialized low-code and no-code platform vendors. Microsoft Corporation, Salesforce, Oracle, SAP, IBM, and Google hold strong positions due to their deep enterprise reach and ability to integrate mobile development with cloud, data, and business process platforms.
These vendors benefit from large developer ecosystems, robust security frameworks, and strong integration with existing enterprise systems, which supports adoption across complex organizational environments.
At the same time, platform specialists such as Mendix, OutSystems, ServiceNow, Pegasystems, Appian, Zoho Corporation, Kony, and Progress Software compete by emphasizing rapid application development, visual modeling, and faster time to deployment. Competition increasingly depends on ease of use, scalability, cross-platform support, and integration with legacy systems.
The Others segment includes emerging vendors and niche providers offering industry-specific or cost-effective solutions, which increases choice for enterprises and encourages ongoing innovation in mobile application development platforms.
Top Key Players in the Market
- Microsoft Corporation
- Salesforce, Inc.
- Oracle Corporation
- SAP SE
- Google LLC
- Apple Inc.
- Mendix Technology BV
- OutSystems
- ServiceNow, Inc.
- Pegasystems Inc.
- Appian Corporation
- Zoho Corporation Pvt. Ltd.
- Kony, Inc.
- IBM Corporation
- Progress Software Corporation
- Others
Future Outlook
Growth in the Mobile Enterprise Application Development Platform market is expected to remain positive as organizations increase mobile usage for business operations. These platforms are being used to build, deploy, and manage enterprise applications that support employees, partners, and customers.
Rising demand for secure, scalable, and user-friendly mobile apps is supporting adoption across industries. Over time, closer integration with cloud services, low-code tools, and security features is likely to improve development speed and application performance.
Recent Developments
- In November 2025, Appian announced major platform enhancements at its product event, making Agent Studio generally available and embedding AI agents directly into enterprise processes; Appian Composer also reached general availability, with more than 130 organizations having already built over 1,300 applications using the tool.
- In November 2025, Microsoft unveiled a completely new Power Apps developer experience at Microsoft Ignite 2025, introducing “vibe coding”, which combines simplified app creation with enterprise-scale Power Platform capabilities, allowing makers to collaborate with AI agents that define requirements, build data models, and code full-stack applications within minutes.
Report Scope
| Report Features | Description |
|---|---|
| Market Value (2025) | USD 19.5 Bn |
| Forecast Revenue (2035) | USD 187.7 Bn |
| CAGR(2025-2035) | 25.40% |
| Base Year for Estimation | 2024 |
| Historic Period | 2020-2024 |
| Forecast Period | 2025-2035 |
| Report Coverage | Revenue forecast, AI impact on Market trends, Share Insights, Company ranking, competitive landscape, Recent Developments, Market Dynamics and Emerging Trends |
| Segments Covered | By Platform (Low-code/No-code Development, Professional Developer-centric, Others), By Deployment Mode (On-premises, Cloud-based), By Organization Size (Large Enterprises, Small and Medium-sized Enterprises), By Application Type (Customer-facing Applications, Employee-facing Applications, Others), By End-User Industry (IT and Telecommunications, Banking, Others) |
| Regional Analysis | North America – US, Canada; Europe – Germany, France, The UK, Spain, Italy, Russia, Netherlands, Rest of Europe; Asia Pacific – China, Japan, South Korea, India, New Zealand, Singapore, Thailand, Vietnam, Rest of Latin America; Latin America – Brazil, Mexico, Rest of Latin America; Middle East & Africa – South Africa, Saudi Arabia, UAE, Rest of MEA |
| Competitive Landscape | Microsoft Corporation, Salesforce, Inc., Oracle Corporation, SAP SE, Google LLC, Apple Inc., Mendix Technology BV, OutSystems, ServiceNow, Inc., Pegasystems Inc., Appian Corporation, Zoho Corporation Pvt. Ltd., Kony, Inc., IBM Corporation, Progress Software Corporation, Others |
| Customization Scope | Customization for segments, region/country-level will be provided. Moreover, additional customization can be done based on the requirements. |
| Purchase Options | We have three licenses to opt for: Single User License, Multi-User License (Up to 5 Users), Corporate Use License (Unlimited Users and Printable PDF) |





























