


Report Overview
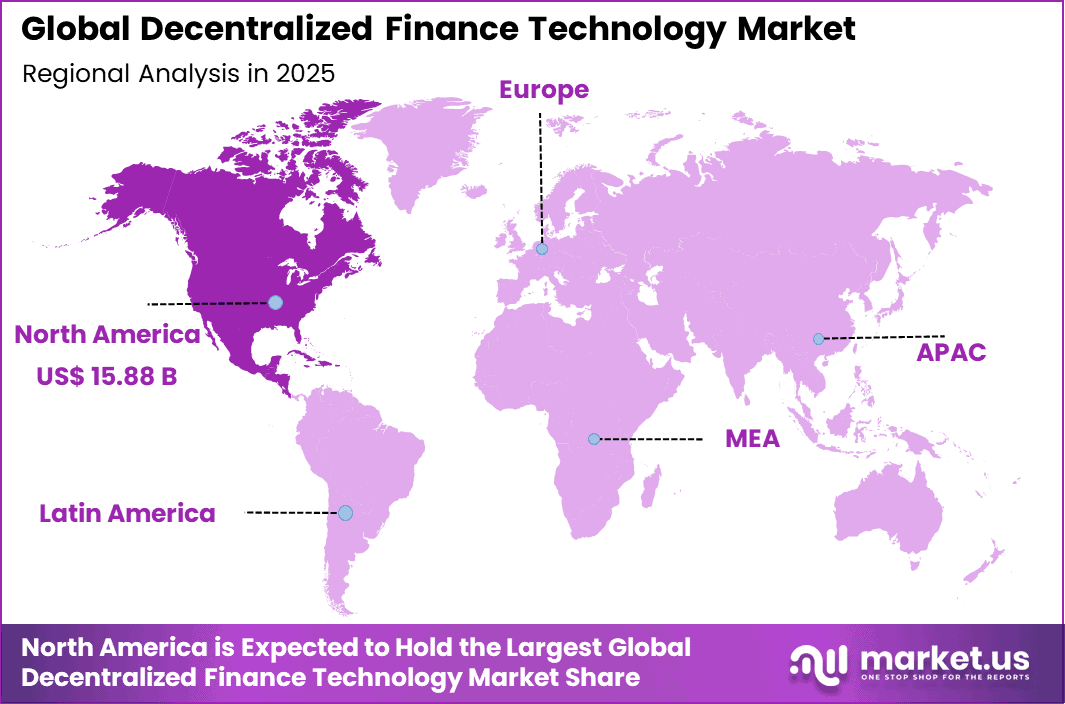
The Global Decentralized Finance Technology Market generated USD 41.3 billion in 2025 and is predicted to register growth from USD 67.4 billion in 2026 to about USD 5,598.2 billion by 2035, recording a CAGR of 63.4% throughout the forecast span. In 2025, North America held a dominant market position, capturing more than a 38.5% share, with USD 15.88 billion in revenue.
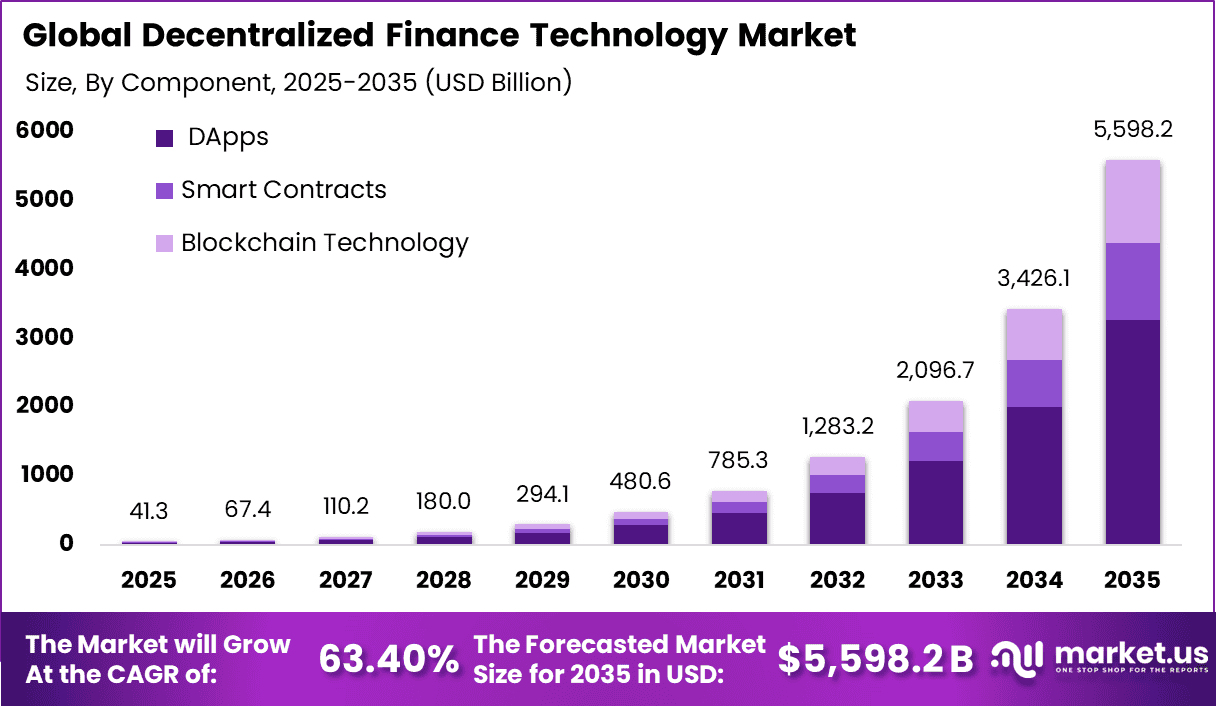
The decentralized finance technology market focuses on digital platforms that enable financial services through distributed ledger systems rather than centralized intermediaries. These technologies support activities such as lending, borrowing, trading, and asset management through programmable smart contracts. Transactions are recorded on transparent networks that allow peer-to-peer interaction without relying on traditional financial institutions.
A key driving factor is the demand for open and borderless financial services. Traditional financial systems often involve multiple intermediaries, longer processing times, and higher transaction costs. Decentralized finance technologies aim to streamline these processes by enabling direct interaction between participants.
Growth in the decentralized finance technology market is supported by continuous innovation in blockchain protocols and smart contract capabilities. As infrastructure becomes more secure and scalable, user confidence improves. Developers are also building interoperable solutions that connect different networks and applications.
Top Market Takeaways
- By component, decentralized applications (dApps) account for 58.4% of the market, powering smart contract-based services like lending protocols and yield aggregators on blockchain networks.
- By application, asset management represents 42.7%, enabling token swaps, staking, and portfolio automation without traditional custodians.
- By end-user industry, banking, financial services, and insurance (BFSI) hold a 48.3% share, integrating DeFi for tokenized assets and hybrid finance models.
- By protocol type, decentralized exchanges capture 41.6%, facilitating peer-to-peer trading with automated market makers and liquidity pools.
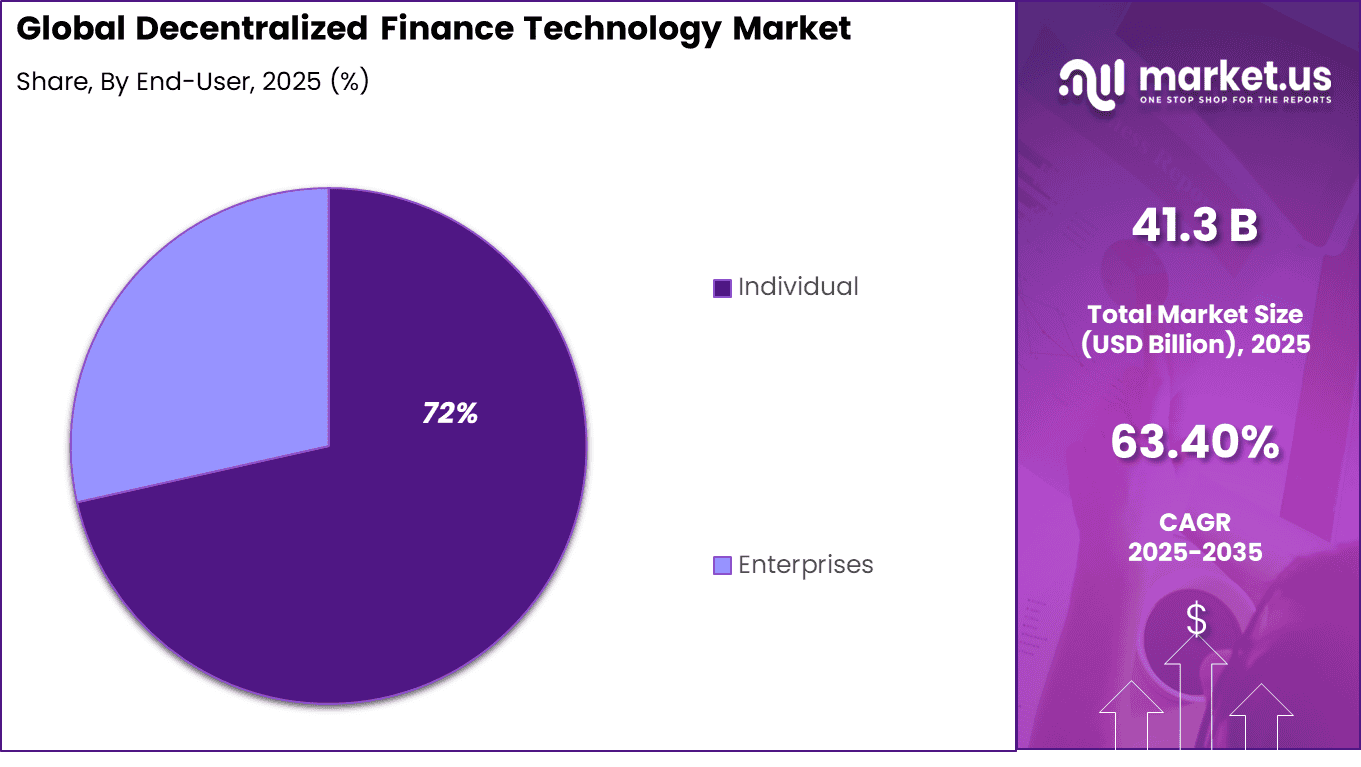
- By end-user, individuals command 71.5%, drawn to permissionless access, high yields, and self-custody amid retail crypto adoption.
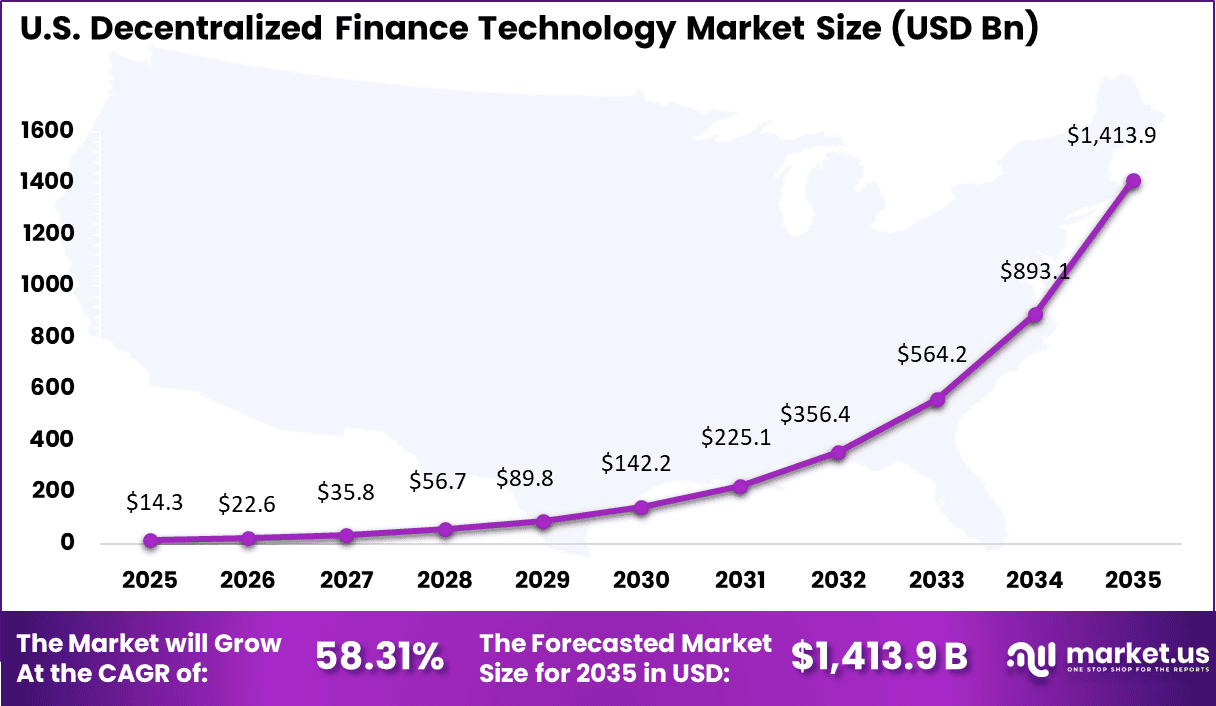
- By region, North America leads with 38.5% of the global market, where the U.S. is valued at USD 14.30 billion with a projected CAGR of 58.31%, fueled by institutional inflows and regulatory maturation.
By Component
Decentralized applications account for 58.4% of adoption in the decentralized finance technology market, as these applications provide direct access to blockchain-based financial services. dApps enable lending, borrowing, trading, and staking without reliance on traditional intermediaries. Their smart contract-driven structure ensures transparent execution of transactions.
The growth of open blockchain ecosystems has supported broader experimentation with financial services. Users value programmability and peer-to-peer interaction models. This continues to position dApps as the leading component within decentralized finance platforms.
By Application
Asset management represents 42.7% of application focus, as decentralized protocols allow users to manage digital assets directly. Smart contract-based tools support portfolio allocation, yield generation, and liquidity provision. This provides flexible alternatives to conventional investment management structures.
Automated asset strategies also enhance transparency in fee structures and performance tracking. Users can monitor asset flows on public ledgers. This operational visibility sustains adoption in decentralized asset management use cases.
By End User Industry
The BFSI sector holds 48.3% of industry-level engagement, as institutions explore decentralized infrastructure for payments and settlement efficiency. Blockchain-based frameworks offer potential improvements in transaction speed and traceability. Financial institutions assess these technologies for back-end process optimization.
Regulatory awareness and compliance considerations influence institutional participation. Pilot programs and controlled implementations continue to expand. This supports gradual integration of decentralized finance technologies within BFSI operations.
By Protocol Type
Decentralized exchanges account for 41.6% of protocol usage, driven by demand for peer-to-peer asset trading. These platforms allow users to exchange digital tokens directly from personal wallets. Automated liquidity pools replace traditional order matching systems.
Users benefit from reduced reliance on centralized custodians. Transparent transaction records improve trust in trading mechanisms. This keeps decentralized exchanges as a central protocol type within the ecosystem.
By End User
Individual users represent 72% of adoption, reflecting strong retail participation in decentralized finance activities. Individuals are attracted by direct asset control and access to alternative financial products. Mobile and web-based interfaces simplify engagement.
Retail users also seek diversification and innovative yield opportunities. The ability to transact without traditional intermediaries remains a key driver. This continues to anchor individuals as the primary end user group in decentralized finance technology.
Key Market Segments
By Component
- Decentralized Applications (dApps)
- Smart Contracts
- Blockchain Technology
By Application
- Asset Management
- Payments
- Lending and Borrowing
- Trading and Exchange
- Compliance and KYC (Know Your Customer)
- Data Analytics
- Gaming
- Stablecoins
- Others
By End-User Industry
- Banking, Financial Services, and Insurance (BFSI)
- Retail and E-commerce
- Media and Entertainment
- Automotive
- Healthcare
- Real Estate
- Supply Chain
- Others
By Protocol Type
- Decentralized Exchanges (DEXs)
- Lending Protocols
- Derivatives Protocols
- Asset Management Protocols
- Others
By End-User
- Individual
- Enterprises
Regional Analysis
North America accounts for 38.5% of the decentralized finance technology market, supported by strong blockchain infrastructure, high digital asset participation, and active fintech innovation. The region has witnessed rapid deployment of decentralized lending, staking, and liquidity platforms that operate through smart contracts and distributed ledger systems.
Demand is driven by investor interest in non-traditional financial products, transparent transaction systems, and reduced dependency on centralized intermediaries.
The United States market is valued at USD 14.3 Bn and is expanding at a CAGR of 58.3%, reflecting accelerated adoption of decentralized financial applications. Growth is influenced by increasing use of digital wallets, tokenized assets, and blockchain-based trading platforms.
Adoption is further supported by strong venture investment, expanding developer ecosystems, and rising integration of decentralized finance protocols within broader digital asset and fintech environments.
Key Regions and Countries
- North America
- US
- Canada
- Europe
- Germany
- France
- The UK
- Spain
- Italy
- Russia
- Netherlands
- Rest of Europe
- Asia Pacific
- China
- Japan
- South Korea
- India
- Australia
- Singapore
- Thailand
- Vietnam
- Rest of APAC
- Latin America
- Brazil
- Mexico
- Rest of Latin America
- Middle East & Africa
- South Africa
- Saudi Arabia
- UAE
- Rest of MEA
Drivers Impact Analysis
| Key Driver | Impact on CAGR Forecast (~%) | Geographic Relevance | Impact Timeline |
|---|---|---|---|
| Expansion of Smart Contract-Based Lending and Borrowing | +12.5% | North America, Europe | Immediate to Medium Term |
| Growth in Decentralized Exchanges and Liquidity Pools | +10.2% | North America, Asia Pacific | Short to Medium Term |
| Institutional Participation in Digital Assets | +8.6% | North America | Medium Term |
| Rising Stablecoin Adoption for Payments | +6.8% | North America, Asia Pacific | Medium Term |
| Cross-Border and Permissionless Financial Access Demand | +5.4% | Emerging Markets | Long Term |
Restraints Impact Analysis
| Key Restraint | Impact on CAGR Forecast (~%) | Geographic Relevance | Impact Timeline |
|---|---|---|---|
| Regulatory Uncertainty and Compliance Risk | -9.5% | North America, Europe | Short to Medium Term |
| Smart Contract Security Vulnerabilities | -7.2% | Global | Immediate |
| Market Volatility in Digital Assets | -5.8% | Global | Ongoing |
| Scalability Constraints of Blockchain Networks | -4.1% | Global | Medium Term |
| Limited Consumer Awareness and Trust | -2.6% | Emerging Markets | Medium Term |
Investor Type Impact Matrix
| Investor Type | Impact on CAGR Forecast (~%) | Geographic Relevance | Investment Horizon |
|---|---|---|---|
| Crypto Native Venture Capital Firms | +11.3% | North America | Medium Term |
| Institutional Asset Managers | +8.9% | North America, Europe | Medium to Long Term |
| Blockchain Infrastructure Companies | +6.7% | Global | Long Term |
| Fintech Strategic Investors | +4.8% | North America, Asia Pacific | Medium Term |
| Retail Liquidity Providers and DAO Treasuries | +3.5% | Global | Immediate |
Technology Enablement Analysis
| Technology Enabler | Impact on CAGR Forecast (~%) | Geographic Relevance | Impact Timeline |
|---|---|---|---|
| Layer 2 Scaling Solutions | +9.8% | North America, Asia Pacific | Short to Medium Term |
| Cross Chain Interoperability Protocols | +8.4% | Global | Medium Term |
| Decentralized Identity Verification Systems | +6.2% | North America, Europe | Medium Term |
| Automated Market Maker Algorithms | +5.1% | Global | Immediate |
| Zero Knowledge Proof Technologies | +4.0% | Global | Long Term |
Key Challenges
- Regulatory uncertainty across different countries affecting platform operations
- High risk of smart contract vulnerabilities and cyber attacks
- Limited consumer protection in case of fraud or system failure
- Volatility in digital asset prices impacting user confidence
- Complexity of user interfaces reducing adoption among mainstream users
Emerging Trends
In the Decentralized Finance Technology market, a clear trend is the expansion of interoperable protocols that allow value and information to move more freely across networks and services. Participants are increasingly adopting designs that support shared standards for asset exchange, settlement, and verification, so users can interact with different services without needing separate silos of identity or funds.
This approach helps reduce friction in financial activity and supports more user-centric experiences. Another emerging pattern is the integration of simpler, clearer interfaces that make complex functions such as lending, swapping, or staking more understandable to a broader audience, helping users feel more confident in using these systems.
Growth Factors
A central growth driver in this market is the increasing interest in financial access beyond traditional intermediaries. Many people and organisations seek ways to engage in financial activity with fewer barriers, and decentralized finance technologies provide pathways for direct participation in savings, borrowing, and exchange services. This appeal supports broader experimentation and adoption of technology that supports peer-to-peer value exchange.
Another key driver is the desire for greater transparency and control over financial decisions. Users value the ability to see clear records of transactions and rules that operate without hidden steps, which strengthens trust in digital financial systems. Together, these factors are encouraging deeper exploration of decentralized finance as an alternative complement to established financial infrastructure.
Competitive Analysis
The Decentralized Finance Technology market is led by protocol developers and decentralized exchanges such as Compound Labs, Uniswap, Aave, MakerDAO, Curve Finance, Synthetix, Balancer, Bancor Network, SushiSwap, Yearn. finance, and 1inch.
These platforms compete on liquidity depth, transaction efficiency, governance models, and the range of decentralized financial products offered, such as lending, borrowing, staking, and token swaps. Their growth is supported by transparent smart contract frameworks and active user communities that contribute to protocol upgrades and ecosystem expansion.
Wallet providers and infrastructure companies such as MetaMask, Dapper Labs, Moon Pay, Hashflow, and others compete by improving user access, transaction security, and fiat-to-crypto connectivity. Competition in this segment is driven by ease of onboarding, lower transaction costs, and enhanced security controls. These players are often selected by users and developers seeking seamless interaction with decentralized applications and broader blockchain-based financial services.
Top Key Players in the Market
- Compound Labs, Inc.
- Uniswap
- Aave
- MakerDAO
- Curve Finance
- Synthetix
- Balancer
- Bancor Network
- SushiSwap
- Yearn. finance
- 1inch
- MetaMask
- Dapper Labs, Inc.
- Moon Pay Limited
- Hashflow
- Others
Future Outlook
The future outlook for the Decentralized Finance Technology Market is positive as more users and institutions explore alternatives to traditional financial systems. Demand for decentralized finance technologies is expected to grow because these solutions offer transparent, accessible, and automated financial services using blockchain and smart contracts.
Adoption of secure protocols, scalability improvements, and regulatory clarity will support broader use across lending, payments, and asset trading. Growth can be attributed to rising interest in financial inclusion, digital asset innovation, and efficiency gains. Overall, the market is expected to expand as decentralized finance technology becomes more trusted and widely adopted.
Recent Developments
- In September 2025, Uniswap passed the DUNI proposal for Decentralized Unincorporated Nonprofit Association structure. Enables legal recognition for governance and fee activation. Onboarded seven hundred DeFi builders with one hundred eighty billion dollars v4 volume.
- In August 2025, MakerDAO Launched Governance Module v2, simplifying MKR voting batch proposals. Implemented dynamic DSR from zero to eight point seven five percent. Advanced Endgame roadmap with MetaDAOs under Sky DAO.
Report Scope
| Report Features | Description |
|---|---|
| Market Value (2025) | USD 41.3 Billion |
| Forecast Revenue (2035) | USD 5,598.2 Billion |
| CAGR(2025-2035) | 63.4% |
| Base Year for Estimation | 2024 |
| Historic Period | 2020-2024 |
| Forecast Period | 2025-2035 |
| Report Coverage | Revenue forecast, AI impact on Market trends, Share Insights, Company ranking, competitive landscape, Recent Developments, Market Dynamics and Emerging Trends |
| Segments Covered | By Component (Decentralized Applications (dApps), Smart Contracts, Blockchain Technology), By Application (Asset Management, Payments, Lending and Borrowing, Others), By End-User Industry (Banking, Financial Services, and Insurance, Others), By Protocol Type (Decentralized Exchanges, Lending Protocols, Others), By End-User (Individual, Enterprises) |
| Regional Analysis | North America – US, Canada; Europe – Germany, France, The UK, Spain, Italy, Russia, Netherlands, Rest of Europe; Asia Pacific – China, Japan, South Korea, India, New Zealand, Singapore, Thailand, Vietnam, Rest of Latin America; Latin America – Brazil, Mexico, Rest of Latin America; Middle East & Africa – South Africa, Saudi Arabia, UAE, Rest of MEA |
| Competitive Landscape | Compound Labs, Inc., Uniswap, Aave, MakerDAO, Curve Finance, Synthetix, Balancer, Bancor Network, SushiSwap, Yearn. Finance, 1inch, MetaMask, Dapper Labs, Inc., Moon Pay Limited, Hashflow, Others |
| Customization Scope | Customization for segments, region/country-level will be provided. Moreover, additional customization can be done based on the requirements. |
| Purchase Options | We have three licenses to opt for: Single User License, Multi-User License (Up to 5 Users), Corporate Use License (Unlimited Users and Printable PDF) |





































