


Market Overview
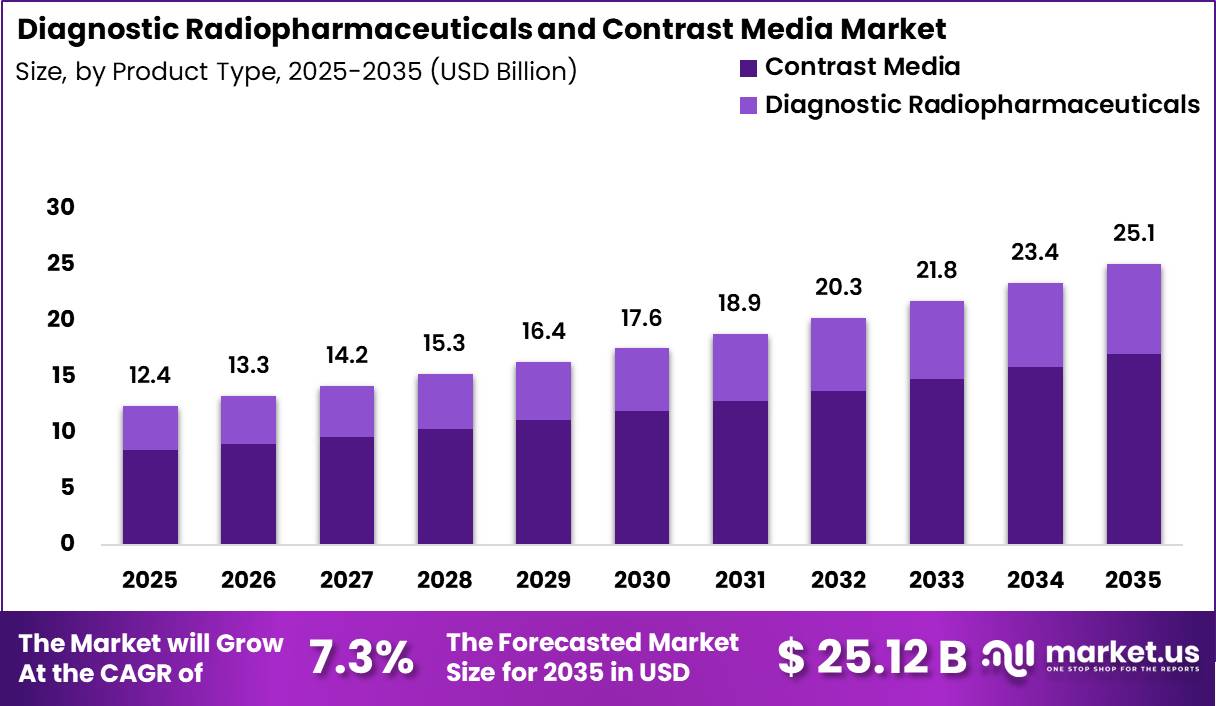
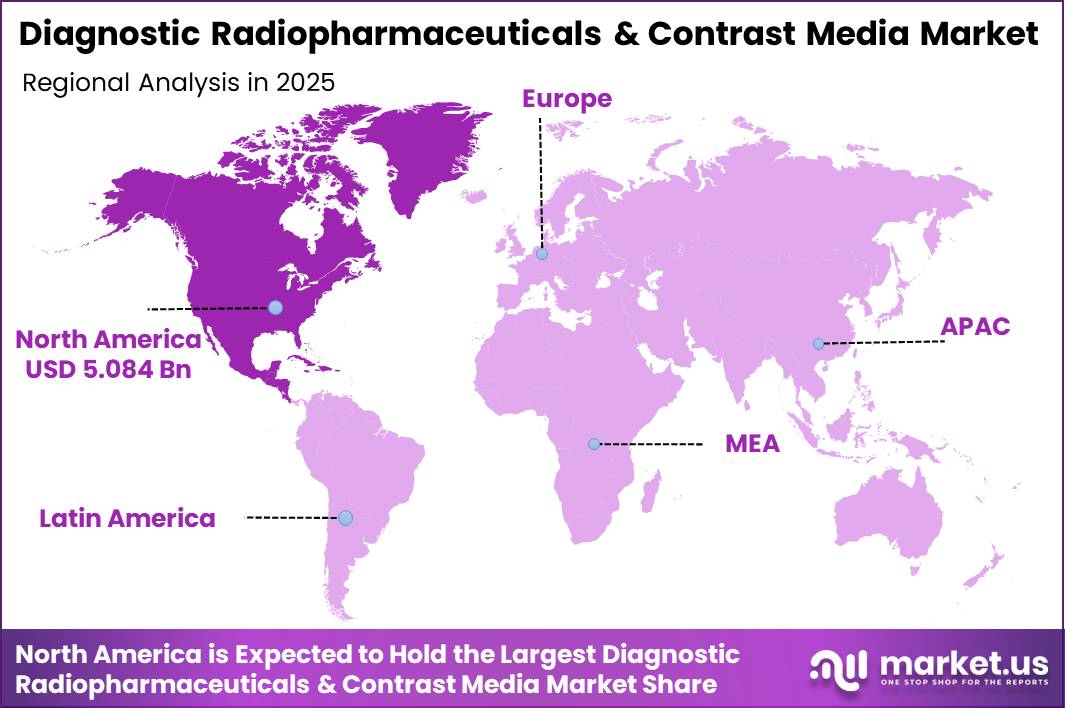
The Global Diagnostic Radiopharmaceuticals and Contrast Media Market size is expected to be worth around US$ 25.1 Billion by 2035 from US$ 12.4 Billion in 2025, growing at a CAGR of 7.3% during the forecast period from 2026 to 2035. In 2025, North America led the market, achieving over 41.0% share with a revenue of US$ 5.08 Billion.
Diagnostic radiopharmaceuticals and contrast media are essential tools in modern medical imaging. Radiopharmaceuticals are radioactive drugs administered to patients that emit detectable signals for nuclear medicine scans such as PET (positron emission tomography) and SPECT (single-photon emission computed tomography).
These agents help visualise organ function, blood flow, cellular metabolism, and disease processes, supporting early diagnosis of cancer, cardiovascular and neurological conditions. Radiopharmaceuticals like technetium-99m are used extensively in diagnostic scans in over 10,000 hospitals worldwide to detect chronic diseases and cancers.
Contrast media are chemical substances used in CT (computed tomography), MRI (magnetic resonance imaging), and angiography to enhance the visibility of tissues, blood vessels, and pathology on imaging.
They improve clinicians’ ability to distinguish normal from abnormal anatomy, significantly aiding diagnosis and procedural guidance. Regulatory bodies such as the U.S. Food and Drug Administration (FDA) regulate contrast agents and imaging devices to ensure patient safety and efficacy.
Diagnostic imaging procedures that use contrast agents are widespread; in the United States alone, tens of millions of contrast-enhanced examinations are performed annually, involving billions of millilitres of contrast media across modalities. Similarly, nuclear medicine contributes to the diagnosis or treatment of more than 30 million patients globally each year.
Key Takeaways
- Market Size: The Global Diagnostic Radiopharmaceuticals and Contrast Media Market size was US$ 12.4 billion in 2025. The market is estimated to grow to US$ 25.1 billion by 2035.
- Market Share: The Compound Annual Growth Rate (CAGR) of the market from 2026 to 2035 will be 7.3%.
- Product Type: Contrast Media has the largest market share, accounting for 68% of total product type revenue.
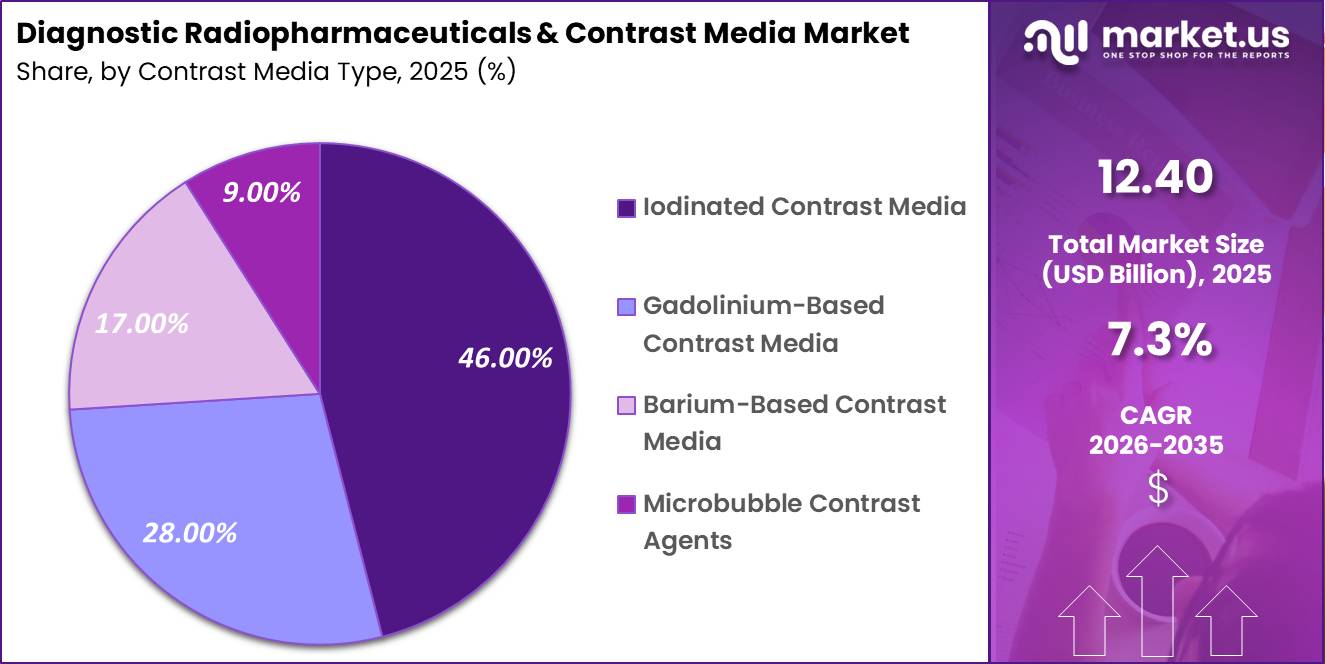
- Contrast Media Type: Iodinated Contrast Media leads the segment, accounting for 46% of total contrast media type revenue.
- Radiopharmaceutical Type: PET Radiopharmaceuticals lead the segment, accounting for 54% of total radiopharmaceutical type revenue.
- Application: Oncology Diagnostics leads the segment, accounting for 39% of total application revenue.
- Imaging Modality: Computed Tomography (CT) dominates the segment, accounting for 42% of total imaging modality revenue.
- End User: Hospitals lead the segment, accounting for 58% of total end-user revenue.
- Distribution Channel: Direct Institutional Sales dominates the segment, accounting for 72% of total distribution channel revenue.
- Regional: North America is the dominant regional market, accounting for 41% of global revenue.
Product Type Analysis
The Diagnostic Radiopharmaceuticals and Contrast Media Market is segmented by product type into contrast media and diagnostic radiopharmaceuticals, reflecting two complementary pillars of medical imaging.
In 2025, contrast media dominated the market with a 68.00% share, underscoring their indispensable role across high-volume imaging procedures such as computed tomography, magnetic resonance imaging, and fluoroscopy.
The strong share is supported by the routine use of contrast agents in hospitals and imaging centres, growing diagnostic scan volumes, and continuous innovation aimed at improving safety profiles and image clarity. Contrast media benefit from standardised clinical protocols, repeat usage per patient, and broad reimbursement acceptance, which together sustain consistent demand.
Diagnostic radiopharmaceuticals accounted for 32.00% of the market in 2025 and represent a strategically important growth segment. These products enable functional and molecular imaging, supporting early disease detection, therapy planning, and treatment monitoring.
Increasing adoption of nuclear medicine procedures, particularly in oncology and cardiology, is enhancing the relevance of diagnostic radiopharmaceuticals.
Although smaller in share, this segment is characterised by higher technological complexity, regulatory oversight, and value-added clinical applications, positioning it for sustained expansion alongside advances in precision diagnostics.
Contrast Media Type Analysis
By contrast media type, the market is categorised into iodinated contrast media, gadolinium-based contrast media, barium-based contrast media, and microbubble contrast agents, each aligned with specific imaging modalities and clinical needs.
Iodinated contrast media led the segment with a dominant 46.00% market share in 2025, driven by their extensive use in computed tomography and angiographic procedures. High global CT scan volumes, emergency diagnostics, and cardiovascular imaging applications continue to reinforce demand for iodinated agents.
Gadolinium-based contrast media followed with a 28.00% share, reflecting their critical role in magnetic resonance imaging, particularly for neurological, musculoskeletal, and oncological assessments. Despite ongoing scrutiny around safety, innovation in macrocyclic formulations has supported continued adoption.
Barium-based contrast media accounted for 17.00% of the market, maintaining relevance in gastrointestinal imaging due to their effectiveness, cost efficiency, and established clinical familiarity.
Microbubble contrast agents, with a 9.00% share, represent a niche yet fast-evolving segment, primarily used in ultrasound imaging for cardiology and liver diagnostics, benefiting from their favourable safety profile and real-time imaging capabilities.
Radiopharmaceutical Type Analysis
The radiopharmaceutical type segment is divided into positron emission tomography radiopharmaceuticals, single-photon emission computed tomography radiopharmaceuticals, and others, reflecting the spectrum of nuclear imaging technologies. In 2025, PET radiopharmaceuticals dominated the market with a 54.00% share, highlighting their central role in advanced molecular imaging.
PET agents are widely used in oncology diagnostics for tumour detection, staging, and therapy response assessment, offering superior sensitivity and quantitative accuracy. Their growing use in neurology and cardiology further strengthens market leadership, supported by expanding PET scanner installations and tracer development.
SPECT radiopharmaceuticals represent a significant complementary segment, benefiting from broader availability, lower infrastructure costs, and established clinical use, particularly in cardiac perfusion and bone imaging. Although their share trails PET, SPECT agents remain vital in regions with limited access to PET facilities.
The other category includes emerging and hybrid tracers under development for specialised diagnostic applications. Collectively, the segment reflects a transition toward more precise and targeted imaging, with PET radiopharmaceuticals setting the pace for innovation while SPECT continues to provide accessible diagnostic solutions.
Application Analysis
Based on application, the market is segmented into oncology diagnostics, cardiology diagnostics, neurology diagnostics, gastrointestinal imaging, and others, highlighting the clinical breadth of diagnostic imaging agents.
Oncology diagnostics dominated the application landscape in 2025 with a 39.00% market share, driven by the global burden of cancer and the critical need for early detection, accurate staging, and treatment monitoring.
Both contrast media and radiopharmaceuticals are extensively used in cancer imaging, supporting modalities such as CT, MRI, and PET. Cardiology diagnostics represent a substantial segment, fueled by rising cardiovascular disease prevalence and the routine use of imaging in ischemic heart disease, vascular disorders, and cardiac function assessment.
Neurology diagnostics also contribute significantly, particularly in imaging of brain tumours, neurodegenerative diseases, and stroke. Gastrointestinal imaging maintains steady demand through established procedures using contrast agents for structural evaluation.
The other segment includes applications in pulmonology, nephrology, and musculoskeletal imaging, reflecting the versatility of these agents across diverse diagnostic pathways.
Imaging Modality Analysis
The market is segmented by imaging modality into computed tomography, magnetic resonance imaging, positron emission tomography, SPECT imaging, and ultrasound imaging, each influencing product demand patterns.
In 2025, computed tomography accounted for the largest share at 42.00%, reflecting its widespread use in emergency care, oncology, trauma, and cardiovascular diagnostics.
High scan volumes and the routine requirement for contrast enhancement strongly support CT’s dominance. Magnetic resonance imaging follows as a key modality, benefiting from its superior soft-tissue contrast and extensive use in neurology, orthopaedics, and oncology, driving steady demand for gadolinium-based agents.
PET imaging represents a high-value segment, closely linked with radiopharmaceutical consumption, particularly in oncology and precision diagnostics. SPECT imaging continues to play an important role in cardiology and bone imaging, supported by its cost-effectiveness and broad availability.
Ultrasound imaging, while accounting for a smaller share, is gaining traction through the adoption of microbubble contrast agents, offering radiation-free, real-time diagnostic capabilities that complement other modalities.
End User Analysis
End users in the Diagnostic Radiopharmaceuticals and Contrast Media Market include hospitals, diagnostic imaging centres, and research institutes, each contributing distinct demand dynamics. Hospitals dominated the market in 2025 with a 58.00% share, reflecting their central role in delivering comprehensive diagnostic services.
High patient footfall, availability of advanced imaging infrastructure, and integration of multiple modalities within hospital settings drive substantial consumption of both contrast media and radiopharmaceuticals. Hospitals also benefit from established procurement systems and reimbursement frameworks, reinforcing consistent utilisation.
Diagnostic imaging centres form the second major end-user segment, driven by the trend toward outpatient imaging and decentralised diagnostic services. These centres emphasise efficiency, high scan throughput, and cost optimisation, supporting steady demand for contrast agents, particularly in CT and MRI.
Research institutes represent a smaller but strategically important segment, focusing on clinical trials, tracer development, and translational research. Although limited in volume, research-driven usage supports innovation and pipeline expansion, indirectly influencing long-term market growth across clinical end-user segments.
Distribution Channel Analysis
Distribution channels for diagnostic radiopharmaceuticals and contrast media include direct institutional sales, speciality distributors, and online procurement, among others, shaping market access and supply efficiency.
In 2025, direct institutional sales dominated with a 72.00% market share, reflecting strong manufacturer-to-hospital relationships and the critical nature of timely, compliant product delivery.
Direct sales channels ensure supply reliability, cold-chain management for radiopharmaceuticals, and adherence to regulatory and quality standards, making them the preferred option for large healthcare institutions.
Speciality distributors play an important supporting role, particularly in serving smaller hospitals and diagnostic centres, offering logistical expertise and localised market reach.
Online procurement and other emerging channels account for a smaller share but are gradually gaining traction, driven by the digitalisation of hospital supply chains and demand for transparent pricing.
While adoption remains limited due to regulatory complexity and handling requirements, these channels are expected to evolve, complementing traditional distribution models and enhancing procurement efficiency over the long term.
Key Market Segments
By Product Type
- Contrast Media
- Diagnostic Radiopharmaceuticals
By Contrast Media Type
- Iodinated Contrast Media
- Gadolinium-Based Contrast Media
- Barium-Based Contrast Media
- Microbubble Contrast Agents
By Radiopharmaceutical Type
- PET Radiopharmaceuticals
- SPECT Radiopharmaceuticals
- Others
By Application
- Oncology Diagnostics
- Cardiology Diagnostics
- Neurology Diagnostics
- Gastrointestinal Imaging
- Others
By Imaging Modality
- Computed Tomography (CT)
- Magnetic Resonance Imaging (MRI)
- Positron Emission Tomography (PET)
- SPECT Imaging
- Ultrasound Imaging
By End User
- Hospitals
- Diagnostic Imaging Centres
- Research Institutes
By Distribution Channel
- Direct Institutional Sales
- Specialty Distributors
- Online Procurement & Others
Driver
CMS reimbursement reset
The most immediate commercial driver on the radiopharmaceutical side is the U.S. reimbursement reset effective January 1, 2025, under which CMS separately pays diagnostic radiopharmaceuticals above a $630 per-day cost threshold using mean unit cost data rather than fully packaging them into the imaging payment.
That change matters because high-cost PET agents previously faced margin compression at the hospital department level, limiting adoption despite clinical value. Once the tracer is reimbursed separately, hospital outpatient economics improve, formulary friction declines, and manufacturers can defend premium pricing with less leakage into provider P&L.
Although CMS simultaneously finalised a 2.83% reduction in the 2025 physician conversion factor, hospital outpatient payment rates were updated upward by 2.9%, which partially offsets budget pressure and preserves imaging service line investment appetite.
In practical forecast terms, this reform disproportionately benefits premium diagnostic tracers in oncology and cardiology, improves revenue visibility for hospital outpatient departments, and supports a sharper step-up in U.S. tracer utilisation than in ex-U.S. markets, where bundled payment structures still constrain rapid mix upgrading
| Driver | (~) % Impact on CAGR Forecast | Geographic Relevance | Impact Timeline |
|---|---|---|---|
| CMS unbundled reimbursement lifts high-cost diagnostic radiopharmaceutical economics | +1.4% | North America core; limited spill-over to private-payer aligned markets | Short term (≤ 2 years) |
| PET/CT and hybrid imaging expansion increases tracer and contrast consumption per workup | +1.2% | North America core, EU, Japan, South Korea, urban China, GCC | Medium term (2-4 years) |
| Mo-99/Tc-99m and emerging isotope capacity improve dose availability and site throughput | +0.9% | North America, EU, Australia, APAC spill-over | Medium term (2-4 years) |
| Low-dose macrocyclic gadolinium and newer contrast agents support protocol replacement | +0.8% | EU, North America, Canada, developed APAC | Medium term (2-4 years) |
| Chronic disease and ageing imaging burden sustains repeat diagnostic demand | +1.1% | Global; strongest in North America, the EU, China, and Japan | Long term (≥ 4 years) |
| Imaging centre modernisation and outpatient workflow optimisation widen addressable usage | +0.7% | APAC corridors, North America outpatient hubs, the Middle East, and Latin America urban centres | Medium term (2-4 years) |
Challenge
Safety Protocol Intensification
Safety-related operating complexity remains a challenge because contrast agents and radiopharmaceuticals increasingly sit inside tighter pharmacovigilance, renal-risk screening, dosing, and informed-consent frameworks.
Especially after long-running concerns around gadolinium retention led to EU restrictions on several linear gadolinium agents and pushed providers toward more selective product choice and protocol standardisation.
This is not a direct sales stopper, but it adds workflow friction through pre-scan kidney assessment, allergy-risk review, agent substitution pathways, post-event monitoring, and committee-level approval policies, which together can add an estimated 8 to 20 minutes to contrast-enhanced scheduling blocks in complex hospital settings and contribute a modelled -0.8 % point CAGR drag by reducing same-day throughput and increasing administrative overhead.
Companies, therefore, have to invest continuously in lower-risk formulations, evidence generation, post-market surveillance, digital dose tracking, and provider education, while hospital customers increasingly favour products supported by robust safety data packages and protocol integration tools rather than price alone, shifting competition toward compliance-enabled commercialisation.
| Challenge | (~) % CAGR Friction Drag | Geographic Relevance | Mitigation Horizon |
|---|---|---|---|
| Isotope Supply Concentration | -1.2% | North America, EU reactor hubs, Japan, Korea | Medium term (2-4 years) |
| Contrast Manufacturing Single-Node Risk | -1.0% | North America core, EU import markets, APAC hospital networks | Medium term (2-4 years) |
| Imaging Workforce Capacity Gaps | -1.4% | North America core, UK, Western Europe, Canada, Australia | Long term (≥ 4 years) |
| Safety Protocol Intensification | -0.8% | EU regulatory hubs, US tertiary centres, Japan | Medium term (2-4 years) |
| Cold-Chain And Scheduling Losses | -0.7% | APAC logistics corridors, Latin America, the Middle East, and distributed rural systems | Medium term (2-4 years) |
| Cost Inflation And Waste Pressure | -0.9% | Global multisite providers, public hospital systems, and emerging markets | Short term (≤ 2 years) |
Restraint
Isotope input concentration and rare-metal bottlenecks
Beyond Mo-99, the broader market is increasingly constrained by concentrated upstream isotope and speciality-input chains, especially as suppliers prepare to expand Lu-177 and Y-90 infrastructure while the industry simultaneously tries to diversify stable isotope sourcing away from geographically concentrated production nodes.
This is relevant even for a diagnostic-heavy market because diagnostic radiopharmaceutical platforms share hot-cell capacity, transport networks, regulatory release infrastructure, and specialist labour pools with adjacent nuclear medicine activities when isotope conversion capacity tightens or enrichment lead times extend, downstream radiopharmacy flexibility declines.
The estimated -0.9% point CAGR drag reflects longer lot-planning cycles, elevated inventory write-off risk for short half-life materials, higher insured logistics cost, and delayed CapEx payback for cyclotron, generator, and radiopharmacy investments, particularly in import-dependent APAC and EU markets that cannot easily localise isotope inputs or absorb repeated qualification costs across multiple suppliers.
| Restraint | (~) % Impact on CAGR Forecast | Geographic Relevance | Impact Timeline |
|---|---|---|---|
| Mo-99 reactor dependence | -1.4% | North America, the EU, and Japan | Short term (≤ 2 years) |
| Iodinated contrast supply fragility | -1.2% | North America core, EU, APAC corridors | Short term (≤ 2 years) |
| GBCA safety and protocol tightening | -0.8% | EU core, North America, Korea | Medium term (2-4 years) |
| Reimbursement and site-of-care pressure | -1.0% | U.S. core, selected EU systems | Medium term (2-4 years) |
| Isotope input concentration and rare-metal bottlenecks | -0.9% | EU, North America, APAC importers | Medium term (2-4 years) |
| Helium and imaging-ops inflation | -0.5% | India, APAC importers, selected EU sites | Short term (≤ 2 years) |
Opportunity
Supply-chain localization and CDMO buildout
This is a future upside lever because it monetises resilience as a product, not simply existing demand; recent shortages proved that supply fragility can suppress realised market revenue even when clinical need is intact.
GE HealthCare’s $138 million Cork investment is expected to add 25 million more patient doses of contrast media per year, while the industry’s prior shortage experience showed how concentrated manufacturing could abruptly constrain global CT imaging supply.
The whitespace is to build regional fill-finish, isotope logistics, and radiopharma CDMO capacity in the U.S., EU, India, and Southeast Asia, where customers increasingly value dual-sourcing, localised inventory, and faster release cycles enough to support premium pricing, longer contracts, or minimum-volume commitments.
Even a 2%–4% price premium on resilience-backed supply, combined with lower lost-sales rates during disruption, can raise realised revenue growth materially above baseline.
This also opens an M&A roll-up path, acquiring niche radiochemistry, sterile manufacturing, and last-mile cold-chain assets can compress time-to-market for new tracers by 12–18 months, improve service levels for short half-life products, and create a defensible moat in markets where clinical adoption is often limited less by demand than by dependable product availability.
| Opportunity | (~) % Potential CAGR Upside | Geographic Relevance | Execution Window |
|---|---|---|---|
| Neurodegenerative PET expansion | +1.4% | North America, the EU, and Japan | Medium term (2-4 years) |
| Outpatient PET/CT network roll-up | +1.8% | U.S., Western Europe, tier-1 APAC cities | Short term (≤ 2 years) |
| Theranostics-linked diagnostics bundling | +2.1% | U.S., EU5, Japan, South Korea | Medium term (2-4 years) |
| Ultrasound microbubble white-space | +1.1% | APAC emerging markets, LatAm, Middle East | Short term (≤ 2 years) |
| AI-guided dose and workflow monetisation | +0.9% | North America, the EU, Gulf states | Short term (≤ 2 years) |
| Supply-chain localization and CDMO buildout | +1.6% | U.S., EU, India, Southeast Asia | Long term (≥ 4 years) |
Regional Analysis
In 2025, North America led the market, achieving over 41.00% share with a revenue of US$5.084 billion. The region’s leadership is supported by advanced diagnostic imaging infrastructure, high adoption of PET, SPECT, CT, and MRI technologies, and strong reimbursement frameworks for molecular imaging procedures. The presence of major manufacturers, continuous product innovation, and a high prevalence of chronic diseases such as cancer, cardiovascular disorders, and neurological conditions further reinforce market strength in the United States and Canada.
Europe represents the second-largest regional market, driven by well-established public healthcare systems, rising demand for early disease diagnosis, and growing use of nuclear medicine in oncology and cardiology. Regulatory emphasis on patient safety and the gradual shift toward macrocyclic gadolinium-based agents have also influenced product selection and protocol standardisation across the region.
Meanwhile, the Asia Pacific is expected to witness the fastest growth over the forecast period. Rapid expansion of diagnostic imaging centres, increasing healthcare expenditure, improving access to advanced modalities, and a large patient population in countries such as China and India are key growth drivers. Emerging markets in Latin America and the Middle East & Africa are also showing steady progress, supported by healthcare infrastructure development and rising awareness of advanced diagnostic imaging solutions.
Key Regions and Countries
North America
- The US
- Canada
Europe
- Germany
- France
- The U.K.
- Italy
- Spain
- Russia & CIS
- Rest of Europe
Asia Pacific
- China
- India
- Japan
- South Korea
- ASEAN
- Australia & New Zealand
- Rest of Asia Pacific
Middle East & Africa
- GCC
- South Africa
- Rest of Middle East & Africa
Latin America
- Brazil
- Mexico
- Rest of Latin America
Key Player Analysis
Suppliers in the global diagnostic radiopharmaceuticals and contrast media market are seeking a competitive edge by developing safer contrast agents, specifically targeting reduced nephrotoxicity for iodinated agents and decreased gadolinium retention for MRI media. There is a growing focus on expanding radiopharmaceutical production capacity to meet the rising demand for PET imaging tracers in oncology and neurology.
Key strategies include developing theranostic platforms that integrate diagnostic and therapeutic radionuclides, expanding cyclotron and radiopharmacy networks for wider distribution of PET tracers, and broadening contrast agent portfolios across various imaging applications.
Companies are investing in regulatory approvals, forging relationships with hospital radiology departments, and establishing direct sales to secure long-term supply agreements. The convergence of diagnostic and therapeutic nuclear medicine through theranostic paired agents is emerging as a major innovation that is reshaping the competitive landscape in the radiopharmaceutical market.
Top Key Players
- GE HealthCare
- Bayer AG
- Bracco Imaging S.p.A.
- Guerbet Group
- Lantheus Holdings Inc.
- Curium Pharma
- Cardinal Health Inc.
- Jubilant Radiopharma
- Siemens Healthineers AG
- Eckert & Ziegler AG
- Nordion (Canada) Inc.
- Telix Pharmaceuticals Limited
- Novartis AG
- Philips Healthcare
- FUJIFILM Holdings Corporation
- Other Key Players
Recent Developments
- In January 2026, Lantheus Holdings expanded its PYLARIFY PET radiopharmaceutical distribution network across North American hospital imaging centres, targeting growing prostate cancer diagnostic imaging demand through direct institutional supply agreements.
- In February 2026, Bayer AG secured regulatory approval for its next-generation gadolinium-based MRI contrast agent featuring improved safety and a reduced gadolinium retention profile, targeting European and North American hospital radiology department institutional buyers.
- In March 2026, Telix Pharmaceuticals launched its theranostic radiopharmaceutical platform across Australian and European oncology centre networks, securing institutional procurement agreements with leading cancer treatment hospital buyers for renal cell carcinoma diagnostic and therapeutic applications.
Report Scope
| Report Features | Description |
|---|---|
| Market Value (2025) | US$ 12.4 Billion |
| Forecast Revenue (2035) | US$ 25.1 Billion |
| CAGR (2026-2035) | 7.3% |
| Base Year for Estimation | 2025 |
| Historic Period | 2020-2024 |
| Forecast Period | 2026-2035 |
| Report Coverage | Revenue Forecast, Market Dynamics, Competitive Landscape, Recent Developments |
| Segments Covered | By Product Type (Contrast Media, Diagnostic Radiopharmaceuticals), By Contrast Media Type (Iodinated Contrast Media, Gadolinium-Based Contrast Media, Barium-Based Contrast Media, Microbubble Contrast Agents), By Radiopharmaceutical Type (PET Radiopharmaceuticals, SPECT Radiopharmaceuticals, Others), By Application (Oncology Diagnostics, Cardiology Diagnostics, Neurology Diagnostics, Gastrointestinal Imaging, Others), By Imaging Modality (Computed Tomography (CT), Magnetic Resonance Imaging (MRI), Positron Emission Tomography (PET), SPECT Imaging, Ultrasound Imaging), By End User (Hospitals, Diagnostic Imaging Centers, Research Institutes), By Distribution Channel (Direct Institutional Sales, Specialty Distributors, Online Procurement & Others) |
| Regional Analysis | North America – The US, Canada; Europe – Germany, France, U.K., Italy, Spain, Russia & CIS, Rest of Europe; Asia Pacific – China, India, Japan, South Korea, ASEAN, Australia & New Zealand, Rest of Asia Pacific; Middle East & Africa – GCC, South Africa, Rest of Middle East & Africa; Latin America – Brazil, Mexico, Rest of Latin America |
| Competitive Landscape | GE HealthCare, Bayer AG, Bracco Imaging S.p.A., Guerbet Group, Lantheus Holdings Inc., Curium Pharma, Cardinal Health Inc., Jubilant Radiopharma, Siemens Healthineers AG, Eckert & Ziegler AG, Nordion (Canada) Inc., Telix Pharmaceuticals Limited, Novartis AG, Philips Healthcare, FUJIFILM Holdings Corporation, Other Key Players |
| Customization Scope | Customization for segments, region/country-level will be provided. Moreover, additional customization can be done based on the requirements. |
| Purchase Options | We have three licenses to opt for: Single User License, Multi-User License (Up to 5 Users), Corporate Use License (Unlimited User and Printable PDF) |





































