Report Overview
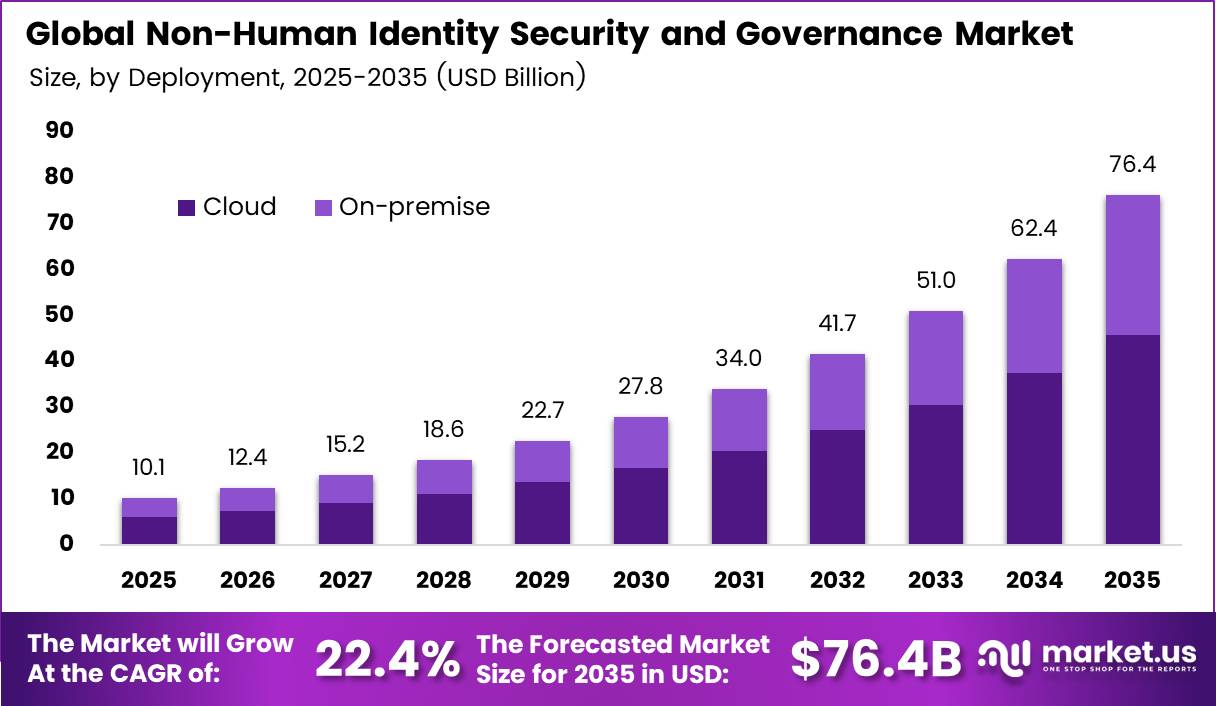
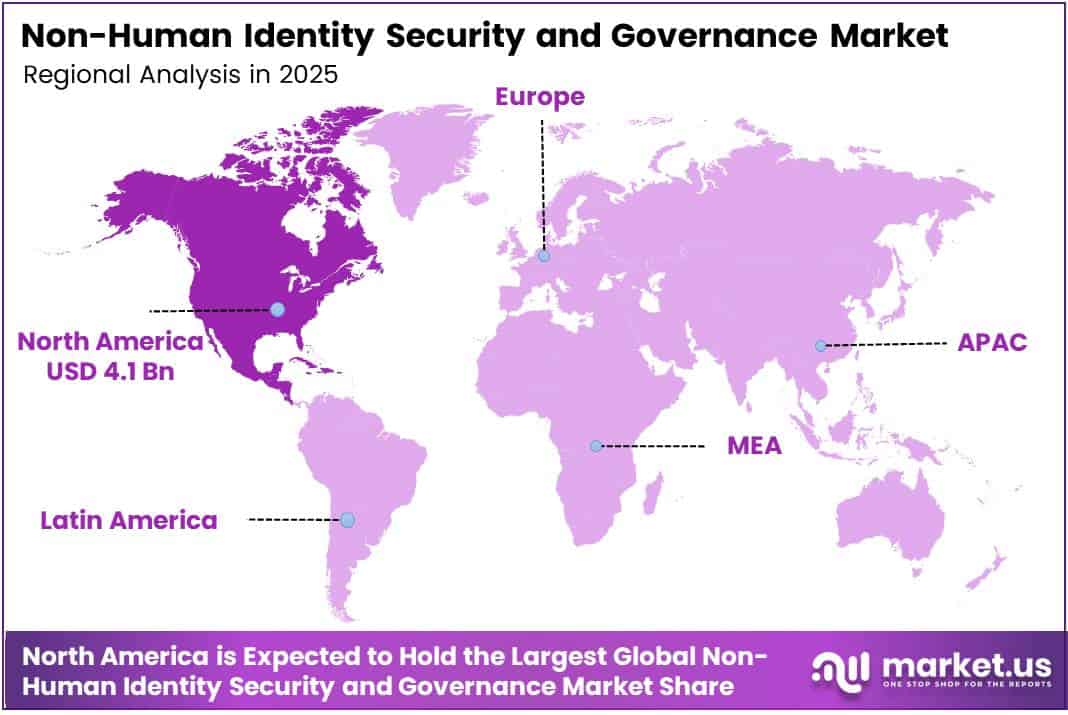
In 2025, the Global Non-Human Identity Security and Governance Market was valued at USD 10.1 billion. The market is projected to grow at a CAGR of 22.4% during 2026–2035, reaching approximately USD 76.4 billion by 2035. North America dominated the global market in 2025, accounting for more than 41.0% of the total market share and generating approximately USD 4.1 billion in revenue.
Stolen keys, tokens, and passwords drive this demand. Verizon’s 2025 Data Breach Investigations Report reviewed more than 22,000 incidents. It found that credential abuse caused 22% of breaches, more than any other entry point. The same report found that firms took a median of 94 days to fix secrets leaked in GitHub code repositories.
Service accounts, API keys, and AI agents now hold many of these secrets. Banks, cloud providers, and software firms run millions of automated tasks every day. Each task needs a machine identity with tight rules, so buyers now fund tools that find, rotate, and govern these credentials.
The North America region has the deepest base of cloud users and security vendors. The FBI logged 859,532 cybercrime complaints in 2024, with reported losses above USD 16.6 billion. Losses at this scale push US boards to fund identity controls. Large US vendors also anchor regional supply. Palo Alto Networks earned USD 9.2 billion in fiscal 2025 revenue and gained the most growth in the Americas.
Key Takeaways
- The Global Non-Human Identity Security and Governance Market stood at USD 10.1 billion in 2025 and will reach USD 76.4 billion by 2035. at a CAGR of 22.4% during 2026-2035.
- By Identity Type, Application and Service Identities led with a 32.2% share.
- By Deployment, Cloud led with a 56.3% share.
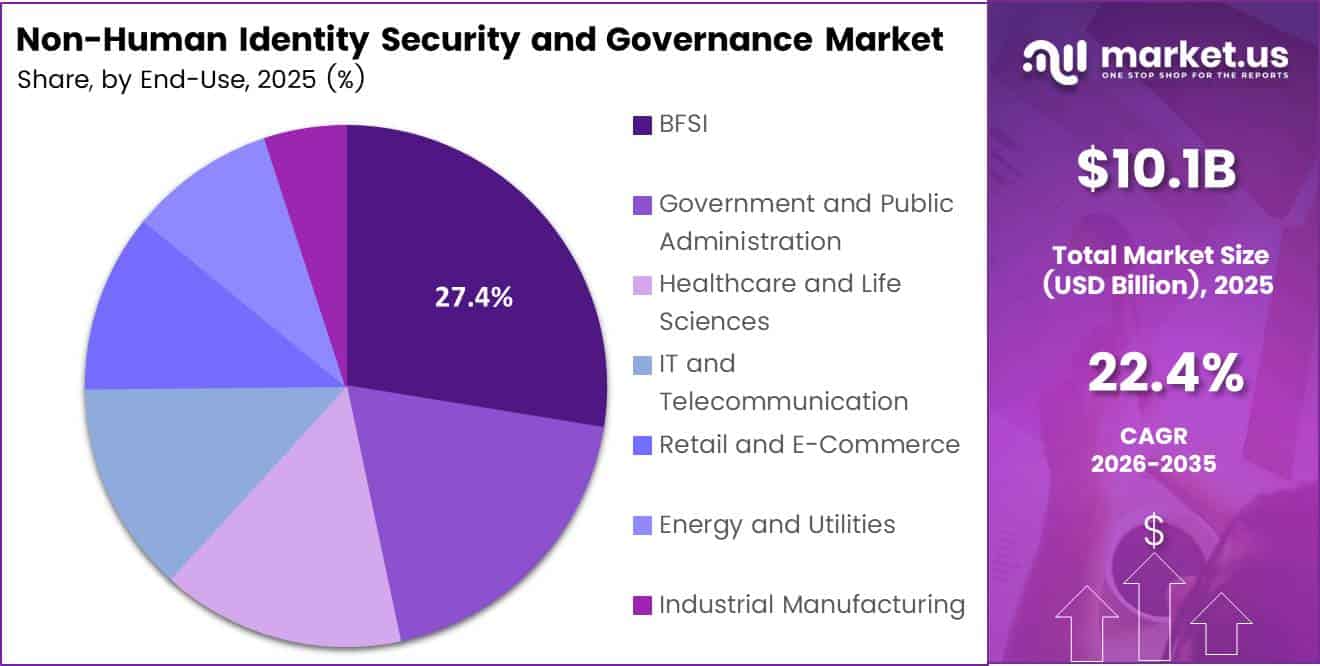
- By End User, BFSI led with a 27.4% share.
- By Application, Access Management led with a 31.2% share.
- North America led the market with a 41.0% share and USD 4.1 billion in revenue.
By Identity Type
Application and Service Identities dominate with 32.2% due to widespread service accounts across business apps.
Application and Service Identities lead because nearly every business app runs on service accounts, API keys, and tokens that link systems behind the scenes. Palo Alto Networks reports that firms now manage 109 machine identities for every human identity, up from 82 to 1 just one year earlier.
AI Agent Identities form the fastest-growing group. A Palo Alto Networks survey of 2,930 security leaders shows that 79 of every 109 machine identities already belong to AI agents. Companies expect AI agent identities to rise 85% over the next 12 months, ahead of the 77% gain forecast for all machine identities.
By Deployment
Cloud dominates with 56.3% due to rapid SaaS and cloud workload growth.
Cloud leads because most new apps, APIs, and workloads now launch on public cloud and SaaS platforms. These platforms create machine accounts at high speed, and cloud-native identity tools can find and control them without new hardware. Verizon’s 2025 DBIR covers more than 22,000 incidents and 12,000 confirmed breaches.
It shows that breaches tied to outside partners doubled from 15% to 30%, often through vendor credentials and misconfigured SaaS. That trend pushes buyers toward cloud tools that watch many linked services at once.
On-premises deployment, however, grows fastest as regulated buyers seek full control over keys and secrets. A CISA postmortem described how a contractor exposed 844 MB of data, including admin keys for 3 AWS GovCloud servers, in a public GitHub repository for nearly 6 months.
By End User
Banking, Financial Services, and Insurance (BFSI) dominates with 27.4% due to high breach costs and strict regulation.
BFSI holds the largest share because banks and insurers face the highest losses when a machine credential fails. IBM’s 2025 Cost of a Data Breach Report puts the average financial-sector breach at USD 5.56 million, well above the global average of USD 4.44 million. Payment APIs, trading bots, and open banking links all depend on service accounts and keys.
The Cloud Security Alliance estimates about 96 non-human identities for every human in financial services, a scale that manual reviews cannot handle. Regulators also require proof of who or what touched each system, which pushes banks to buy governance tools with strong audit trails.
IT and Telecommunications is the fastest-growing end user. ITU data shows almost three-quarters of the world’s people are online, while 2.2 billion remain offline, so operators keep building networks, data centers, and cloud services. In cloud-native settings, the ratio can reach 144 to 1, driving strong demand for automated discovery and control.
By Application
Access Management dominates with 31.2% due to credential abuse leading to breach entry.
Access Management leads because controlling who or what can log in remains the first line of defense. Verizon’s 2025 DBIR names credential abuse as the top way attackers get in, at 22% of breaches, ahead of vulnerability exploitation at 20%. In basic web app attacks, 88% of breaches involved stolen credentials.
Secrets Management and Rotation grows fastest because keys and certificates now expire much sooner. The CA/Browser Forum passed Ballot SC-081v3 with 29 votes in favor and none against. It cuts the maximum public TLS certificate life from 398 days to 200 days in March 2026, 100 days in 2027, and 47 days in 2029.
At the final stage, teams must renew each certificate nearly 8 times a year, which manual work cannot support. IBM also finds that teams using AI and automation widely cut breach time by 80 days and costs by USD 1.9 million. These results push firms toward vaults that find, store, and rotate secrets on their own.
Key Market Segments
By Identity Type
- Application and Service Identities
- Application-to-Application and API Identities
- Workload and Container Identities
- Machine and Device Identities
- Cryptographic Identities
- AI Agent Identities
- Others
By Deployment
- Cloud
- On-premise
By End User
- Banking, Financial Services, and Insurance (BFSI)
- Government and Public Administration
- Healthcare and Life Sciences
- IT and Telecommunication
- Retail and E-Commerce
- Energy and Utilities
- Industrial Manufacturing
- Others
By Application
- Access Management
- Secrets Management and Rotation
- Identity Governance and Administration
- Certificate Lifecycle Management
- Compliance Management
- Other
Geopolitical Impact Analysis
Trade tensions shape the cost of the servers, chips, and hardware security modules that store machine keys. The WTO first projected a 0.2% drop in world merchandise trade volume for 2025 after new US tariffs. It warned that reciprocal tariffs could deepen the drop to 1.5%. Hardware security modules and data center gear often cross several borders, so tariffs raise the price of on-premises key vaults.
Trade later held up better than feared. The WTO raised its 2025 trade growth forecast to 2.4%, up from 0.9% in August, as firms rushed orders ahead of new duties. The WTO expects slower growth in 2026 as the full tariff impact lands. Buyers who plan on-premise secure vaults may delay hardware orders and lean on cloud tools.
Shipping routes add another cost layer. UNCTAD found that ships rerouting around the Cape of Good Hope add about 12 days to an Asia-to-Europe trip. Many servers and secure chips ship from Asia, so these delays slow data center builds in Europe. Slower builds also delay the identity tools that firms deploy alongside new hardware.
Data rules add pressure of their own. Governments now want sensitive keys stored inside their own borders. This pushes vendors to open local cloud regions and sell on-premises options. That trend also helps explain why on-premise stands as the fastest-growing deployment segment despite the higher hardware costs.
Regional Analysis
North America dominates the Non-Human Identity Security and Governance Market, holding a 41.0% share and generating USD 4.1 billion in revenue. The US drives most of this demand. Large banks, cloud providers, and software firms run huge fleets of service accounts, API keys, and AI agents. Each one needs a tracked and rotated credential.
Major US vendors spend heavily to meet this need. Palo Alto Networks spent USD 1,984.1 million on research and development in fiscal 2025, up 9.7% from the prior year. Its subscription and support revenue reached USD 7.4 billion, or 80.5% of total revenue, which shows how buyers now prefer cloud-delivered security. US startups add more depth.
Asia Pacific stands as the fastest-growing region in the market. China, India, Japan, and South Korea lead adoption as firms move core systems to the cloud. India’s large software and IT services base creates millions of API keys and service accounts each year. Japan and South Korea push strict data rules for banks and telecom firms. Australia adds demand through its critical infrastructure laws.
Europe holds the second largest position, led by Germany, France, and the UK. ENISA analysed 4,875 incidents from July 2024 to June 2025 and found phishing behind about 60% of intrusions. Stolen logins from these attacks often unlock machine accounts. EU data rules and resilience laws for finance push banks to govern privileged and automated access.
Key Regions and Countries
North America
- US
- Canada
Europe
- Germany
- France
- The UK
- Spain
- Italy
- Rest of Europe
Asia Pacific
- China
- Japan
- South Korea
- India
- Australia
- Rest of APAC
Latin America
- Brazil
- Mexico
- Rest of Latin America
Middle East and Africa
- GCC
- South Africa
- Rest of MEA
Market Dynamics
Drivers
| Driver | (~) % Impact on CAGR Forecast | Geographic Relevance | Impact Timeline |
|---|---|---|---|
| Machine Identity Proliferation in Multi-Cloud Estates | +3.1% | Global | Short term (2 years or less) |
| Credential-Led Supply Chain Breaches | +2.4% | North America, Europe | Short term (2 years or less) |
| DORA, NIS2 & PCI DSS 4.0 Enforcement | +1.9% | Europe, Global BFSI | Short term (2 years or less) |
| Secrets Sprawl in CI/CD Pipelines | +1.4% | Global | Medium term (2 to 4 years) |
| Identity Platform Consolidation by Security Majors | +1.0% | North America, Israel | Medium term (2 to 4 years) |
Machine Identity Proliferation in Multi-Cloud Estates
The root cause is architectural. Microservices, Kubernetes workloads, serverless functions, and SaaS-to-SaaS integrations each create service accounts, API keys, OAuth tokens, and certificates. CyberArk’s 2025 identity security disclosures put the ratio of machine identities to human identities at roughly 82:1, up from about 45:1 in its 2022 survey.
GitGuardian’s public telemetry counted about 23.7 million new hardcoded secrets exposed on public GitHub in 2024, a rise of about 25% year over year. Investigations by Mandiant and Snowflake tied the 2024 Snowflake customer intrusions, which affected about 165 organizations, to credentials that lacked MFA.
The business model is shifting as a result. Vendors are moving away from seat-based privileged access management licences toward SaaS subscriptions priced on the number of managed identities or workloads. Because the pricing unit now grows with cloud consumption instead of headcount, net revenue retention can exceed 115%. Customer acquisition costs also fall when buyers arrive through cloud marketplaces.
Restraints
| Restraint | (~) % Impact on CAGR Forecast | Geographic Relevance | Impact Timeline |
|---|---|---|---|
| Security Budget Caps & Tool Freezes | -1.3% | Global, Mid-Market | Short term (2 years or less) |
| Data Residency & Sovereign Cloud Mandates | -0.8% | Europe, China, India, Middle East | Medium term (2 to 4 years) |
| Native Hyperscaler IAM Bundling | -0.7% | Global | Medium term (2 to 4 years) |
| Legacy Mainframe & OT Incompatibility | -0.5% | North America, Europe, Japan | Long term (4 years or more) |
| Prolonged Public Sector Procurement Certification | -0.4% | North America, Asia Pacific | Short term (2 years or less) |
Security Budget Caps & Tool Freezes
The root cause is a squeeze on capital. Policy rates from the Federal Reserve and the European Central Bank stayed above pre-pandemic levels through most of 2024 and 2025. Over the same period, IMF World Economic Outlook updates held global growth at roughly 3.0–3.3%. CFOs responded by tightening discretionary IT spend, and security budgets followed.
The bottleneck is measurable. IANS Research and Artico budget benchmarking shows security budget growth slowing to about 4–8% a year, compared with 17% in 2022. Security now takes about 10–11% of total IT spend. Many enterprises are freezing new point tools and folding identity line items into existing PAM or IGA renewals, which pushes standalone NHI purchases back by 2–3 quarters.
Vendors feel this directly. Earnings calls from listed identity vendors describe longer sales cycles, larger discounts, and budget-driven deal slippage. Pure-play NHI startups face gross margin pressure of about 3–5 percentage points, and buyers are delaying implementation CapEx until renewal windows open.
Challenges
| Challenge | (~) % CAGR Friction Drag | Geographic Relevance | Mitigation Horizon |
|---|---|---|---|
| Unclear NHI Ownership Accountability | -1.2% | Global | Medium term (2 to 4 years) |
| Identity Security Talent Deficit | -0.9% | Global, Asia Pacific | Long term (4 years or more) |
| Incomplete Discovery Across SaaS | -0.6% | North America, Europe | Medium term (2 to 4 years) |
| Rotation Breaking Production Workloads | -0.5% | Global | Short term (2 years or less) |
| Fragmented Standards & Interoperability | -0.4% | Global | Long term (4 years or more) |
Unclear NHI Ownership Accountability
The structural weakness is ownership. Machine credentials are created by developers, DevOps teams, SaaS admins, and, more and more, by automation itself. Yet no single function is accountable for their lifecycle. CISA’s Secure by Design guidance and NIST SP 800-207 zero-trust architecture both assume a named owner for every identity, which most organizations cannot yet provide.
The friction shows up in the numbers. Cloud Security Alliance survey work indicates that only about 15% of organizations feel highly confident in securing NHIs. Roughly 40–50% of service accounts in typical estates have no assigned owner. Remediation tickets for orphaned credentials can stay open for 30–90 days.
Fixing this requires long-term corporate change. Vendors need to build ownership-attribution engines and integrate with ITSM tools. Customers need to set up joint identity governance boards across platform engineering and security. These steps add about 10–15% to professional services cost per deployment before platform value is fully realized.
Opportunities
| Opportunity | (~) % Potential CAGR Upside | Geographic Relevance | Execution Window |
|---|---|---|---|
| Agentic AI Identity Governance | +2.6% | Global | Medium term (2 to 4 years) |
| Post-Quantum Certificate Migration Services | +1.5% | North America, Europe | Long term (4 years or more) |
| OT & IoT Device Identity Expansion | +1.1% | Asia Pacific, Europe | Long term (4 years or more) |
| MSSP-Delivered NHI Managed Services | +0.8% | India, Southeast Asia, Latin America | Medium term (2 to 4 years) |
| Cyber-Insurance Linked Posture Scoring | +0.5% | North America, United Kingdom | Short term (2 years or less) |
Agentic AI Identity Governance
The unit economics differ from the current market. Microsoft, Salesforce, and ServiceNow investor disclosures describe enterprise roadmaps that would deploy agents in multiples of headcount. That shift could raise revenue per managed identity by 20–35%. Automated policy generation could also cut the cost of serving each identity by about 15–25%.
Margins could widen as well. Vendors that offer runtime authorization, agent intent logging, and kill-switch controls could see gross margins of 80–85% on this layer, about 5–8 points above conventional secrets-management SKUs. That would open a sizable untapped portion of the addressable market for vendors that move first.
Key Players Analysis
Tier 1 market leaders include Palo Alto Networks, BeyondTrust, and Delinea. These firms sell identity security as part of wider platforms. Palo Alto Networks leads on scale. Its fiscal 2025 revenue grew 15% to USD 9.2 billion, and fourth-quarter revenue rose 16% to USD 2.5 billion.
Tier 1 players also buy their way into machine identity. Palo Alto Networks agreed to buy CyberArk for about USD 25 billion in July 2025 and closed the deal in February 2026. CyberArk shareholders received USD 45.00 in cash plus 2.2005 Palo Alto shares per share. Delinea signed a deal to buy StrongDM in January 2026 to add just-in-time access for machines and AI agents.
Tier 2 challengers include Aembit, Akeyless, AppViewX, Astrix, Britive, Clutch Security, and Entro Security. These firms focus on niches such as secrets, workload access, or certificates. Clutch Security raised USD 20 million in a Series A round in January 2025, taking its total funding to USD 28.5 million. Entro Security raised USD 18 million in its Series A round, bringing its total to USD 24 million.
Funding keeps flowing into this tier. Akeyless reportedly closed a USD 65 million Series B round in November 2025. Clutch now connects with close to 60 infrastructure services and identity providers. Large platform buyers will likely keep targeting these challengers through 2035.
Top Key Players in the Market
- Aembit, Inc
- Akeyless Security Ltd.
- AppViewX, Inc.
- Astrix Security Ltd.
- BeyondTrust Corporation
- Britive, Inc.
- Clutch Security Ltd.
- Palo Alto Networks
- Delinea, Inc.
- Entro Security Ltd.
Recent Developments
- In March 2026, Delinea completed its acquisition of StrongDM, joining StrongDM’s just-in-time authorization with its privileged access platform for human, machine, and AI agent identities.
- In February 2026, Palo Alto Networks completed its acquisition of CyberArk, paying USD 45.00 in cash and 2.2005 Palo Alto shares for each CyberArk share.
- In November 2025, Akeyless Security closed a USD 65 million Series B round led by NGP Capital to grow its secrets and machine identity platform.
- In January 2025, Clutch Security raised USD 20 million in a Series A round led by SignalFire, bringing its total funding to USD 28.5 million.
Report Scope
| Report Features | Description |
|---|---|
| Market Value (2025) | USD 10.1 Billion |
| Forecast Revenue (2035) | USD 76.4 Billion |
| CAGR (2026-2035) | 22.4% |
| Base Year for Estimation | 2025 |
| Historic Period | 2020-2024 |
| Forecast Period | 2026-2035 |
| Report Coverage | Revenue Forecast, Market Dynamics, Competitive Landscape, Recent Developments |
| Segments Covered | By Identity Type (Application and Service Identities, Application-to-Application and API Identities, Workload and Container Identities, Machine and Device Identities, Cryptographic Identities, AI Agent Identities, Others); By Deployment (Cloud, On-premises); By End User (Banking, Financial Services, and Insurance (BFSI), Government and Public Administration, Healthcare and Life Sciences, IT and Telecommunication, Retail and E-Commerce, Energy and Utilities, Industrial Manufacturing, Others); By Application (Access Management, Secrets Management and Rotation, Identity Governance and Administration, Certificate Lifecycle Management, Compliance Management, Other) |
| Regional Analysis | North America – US, Canada; Europe – Germany, France, The UK, Spain, Italy, Rest of Europe; Asia Pacific – China, Japan, South Korea, India, Australia, Singapore, Rest of APAC; Latin America – Brazil, Mexico, Rest of Latin America; Middle East & Africa – GCC, South Africa, Rest of MEA |
| Competitive Landscape | Aembit, Inc., Akeyless Security Ltd., AppViewX, Inc., Astrix Security Ltd., BeyondTrust Corporation, Britive, Inc., Clutch Security Ltd., Palo Alto Networks, Delinea, Inc., Entro Security Ltd. |
| Customization Scope | Customization for segments and region/country-level will be provided. Moreover, additional customization can be done based on the requirements. |
| Purchase Options | We have three licenses to opt for: Single User License, Multi-User License (Up to 5 Users), Corporate Use License (Unlimited Users and Printable PDF) |