Report Overview
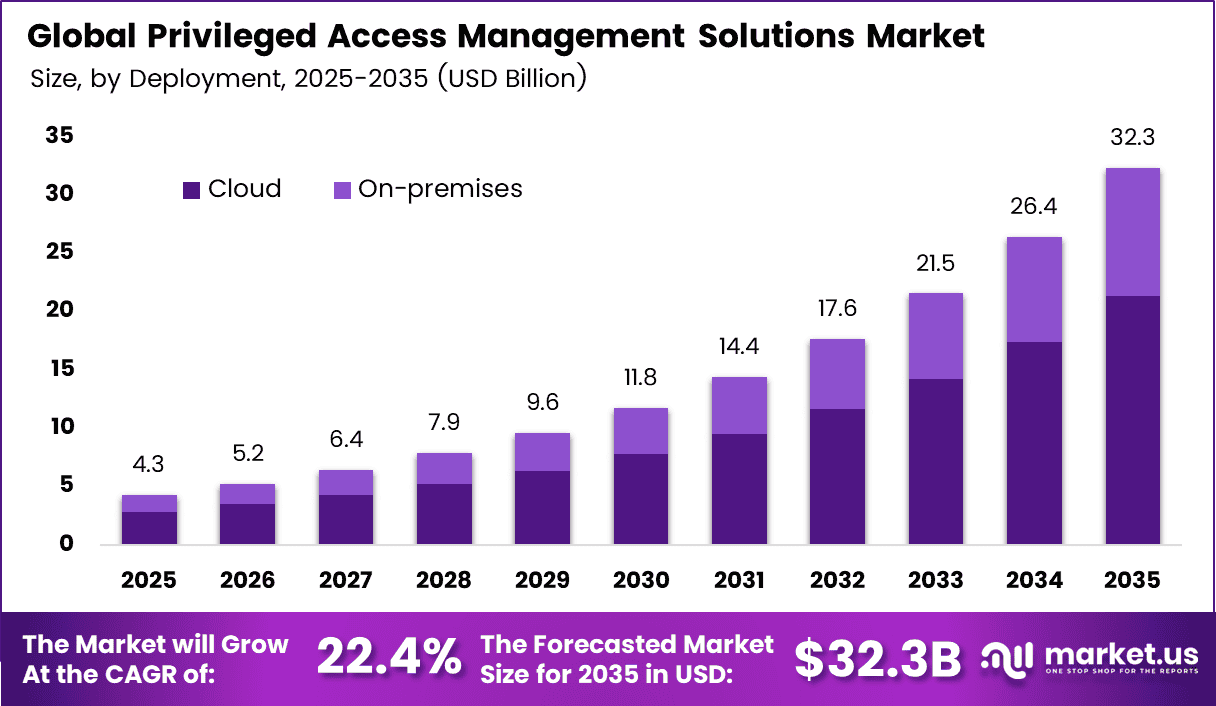
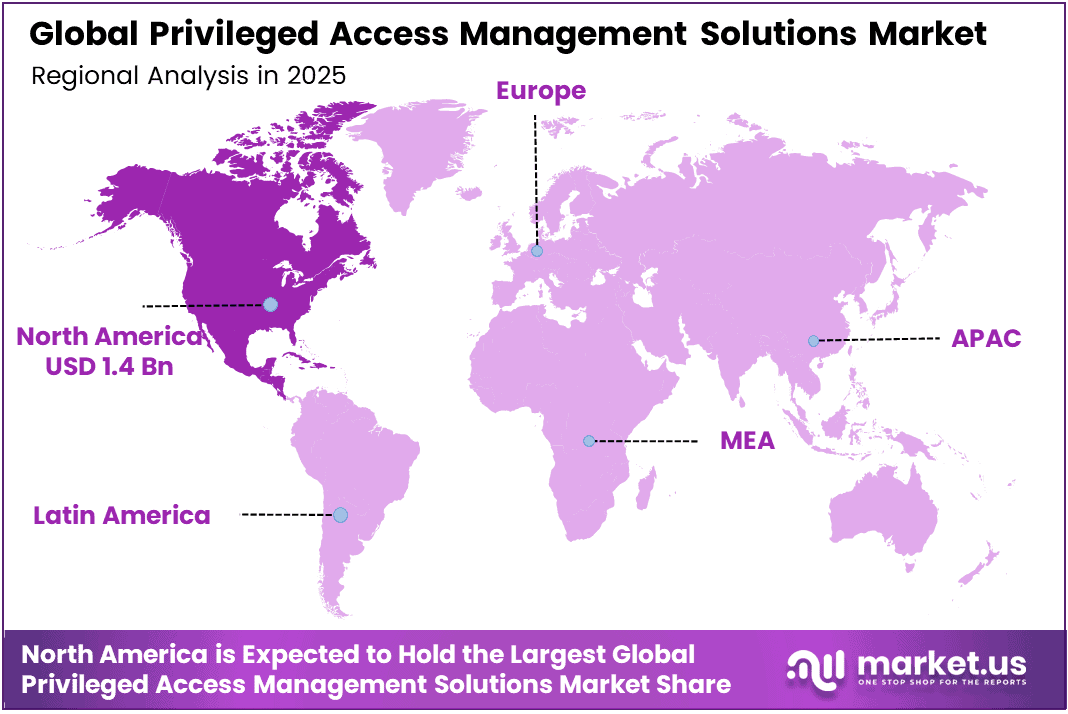
In 2025, the Global Privileged Access Management Solutions Market was valued at USD 4.3 billion. The market is projected to grow at a CAGR of 22.4% during 2026–2035, reaching approximately USD 32.3 billion by 2035. North America dominated the global market in 2025, accounting for more than 33.2% of the total market share and generating approximately USD 1.4 billion in revenue.
Costly breaches drive this growth. IBM’s Cost of a Data Breach study put the average global breach cost at USD 4.88 million in 2024, and stolen or misused credentials remain one of the most common ways attackers get in. Big buyers keep spending on identity security.
CyberArk’s SEC filings show revenue rising from USD 751.9 million in 2023 to USD 1.0 billion in 2024, a gain of 33.1%. Revenue then climbed to USD 1.36 billion in 2025. These numbers show that companies now treat admin, machine, and AI agent accounts as top risks. Each new cloud workload and each new bot adds more privileged accounts that need vaulting, rotation, and session monitoring.
The North America region holds the largest group of security vendors and buyers. Palo Alto Networks’ October 2026 results show next-generation security ARR of USD 8.1 billion, up 60% year over year. CyberArk and Chronosphere added USD 1.6 billion of that total. US federal zero trust rules also push agencies to adopt least privilege controls.
Key Takeaways
- The Privileged Access Management Solutions Market was valued at USD 4.3 billion in 2025 and should reach USD 32.3 billion by 2035. at a CAGR of 22.4% from 2026 to 2035.
- By Component, Solution leads with a 64.3% share.
- By Deployment, Cloud leads with a 57.6% share.
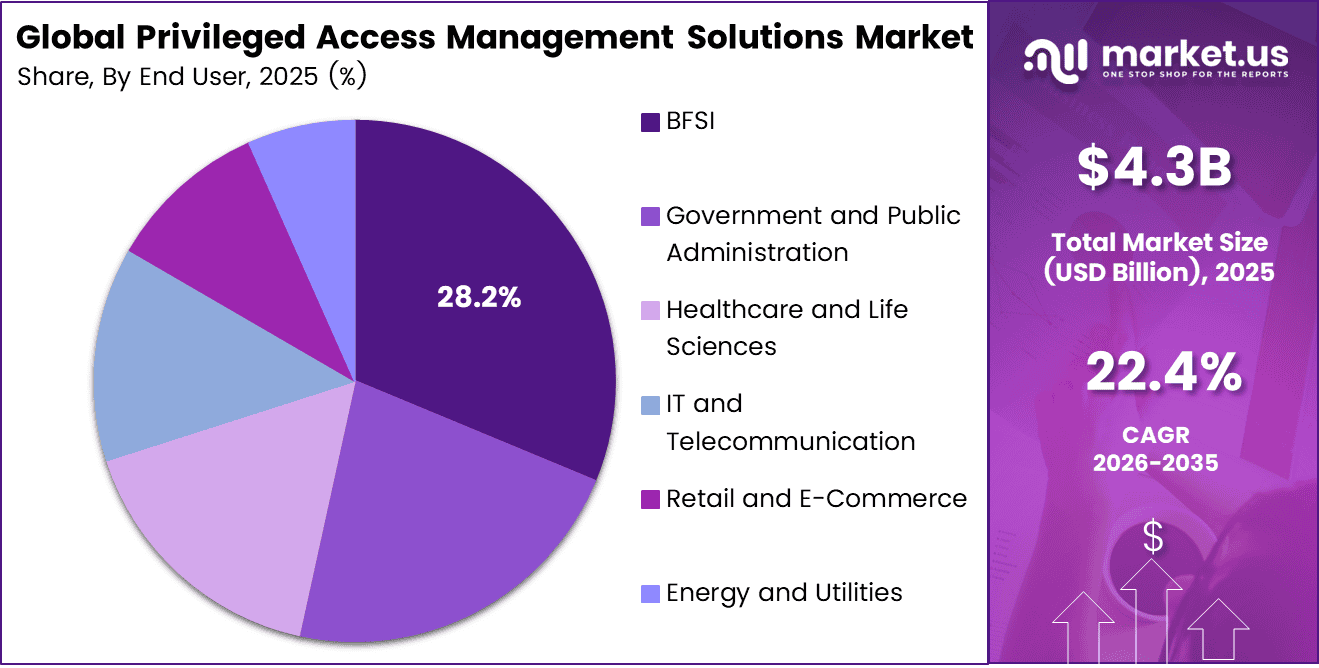
- By End User, BFSI leads with a 28.2% share.
- North America leads the market with a 33.2% share and USD 1.4 billion in revenue.
By Component
Solution dominates with 64.3% due to core vaulting and credential rotation needs.
Solution leads the market because firms need software that locks, rotates, and watches admin passwords every day. Password management, access control, and session management tools form the main shield against stolen logins. Verizon’s 2026 DBIR found that credential abuse still showed up somewhere in 39% of breaches, even though it fell to 13% as a first entry point.
The attack load keeps rising too. Verizon analyzed more than 22,000 confirmed breaches in its latest report, nearly double the 12,195 from the prior edition. Software exploitation also rose to 31% of entry points, up from 20%. Once attackers break in through a software flaw, they hunt for admin rights. So buyers keep paying for core PAM tools that cut off that path.
By Deployment
Cloud dominates with 57.6% due to SaaS subscriptions replacing perpetual licenses.
Cloud holds the largest share because buyers want fast setup, automatic updates, and lower upfront costs. Vendor filings show this shift clearly. CyberArk, a top PAM provider, said its subscription share of annual recurring revenue reached $977 million by year-end 2024, up 68% in one year. Its total ARR passed $1.169 billion, growing 51%.
Earlier filings show the same climb. Subscription ARR rose from $183 million to $582 million over two years, while total ARR grew from $393 million to $774 million. This tells us that most new PAM spending now flows into cloud and subscription models, which fit Cyber Insurance and multi-cloud setups well.
By End User
Banking, Financial Services, and Insurance (BFSI) dominates with 28.2% due to strict regulatory audits on privileged access.
BFSI leads because banks handle high-value money flows and face tough audit rules on who can touch core systems. Fraud losses keep that pressure high. The Reserve Bank of India reported bank fraud worth ₹36,014 crore in FY2025, up from ₹12,230 crore a year earlier. That is almost a 194% jump in value.
The case count also stays large, at 23,953 reported frauds. Public sector banks alone reported ₹25,667 crore. Because of this, lenders put money into tight admin controls, session recording, and full audit trails to protect payment and loan systems.
Healthcare and life sciences are the fastest-growing end user. Hospitals now run linked health records, billing networks, and outside vendor portals, and each one adds admin accounts. The U.S. HHS Office for Civil Rights logged 663 large breaches in 2024, affecting about 242.9 million people. Regulators flagged weak authentication and audit controls as repeat gaps.
Key Market Segments
By Component
- Solution
- Password Management
- Access Control
- Session Management
- Others
- Services
By Deployment
- Cloud
- On-premise
By End User
- Banking, Financial Services, and Insurance (BFSI)
- Government and Public Administration
- Healthcare and Life Sciences
- IT and Telecommunication
- Retail and E-Commerce
- Energy and Utilities
- Industrial Manufacturing
Geopolitical Impact Analysis
PAM is mostly software, but it still relies on hardware. Vaults, session recording servers, and hardware security modules all run on chips, servers, and storage. US tariffs on Chinese semiconductors rose to 50% under Section 301 in 2025. That raised costs for on-premises appliances and the data center gear that hosts PAM workloads.
Shipping problems add more pressure. UNCTAD reported that Suez Canal transits fell by about 42% in early 2024 after the Red Sea attacks. Many carriers rerouted around the Cape of Good Hope, which added 10 to 14 days to Asia-to-Europe trips. These delays slowed deliveries of servers and security appliances used in on-premises PAM rollouts.
Trade growth has also slowed. The WTO cut its forecast for 2025 merchandise trade volume to about 0.2% growth after the tariff increases in April 2025. Higher costs for hardware and energy push some buyers toward cloud PAM. Others keep data on local servers to meet data sovereignty rules, which helps explain the strong growth in on-premises deployment.
Conflict also shapes demand. State-backed cyber campaigns tied to the Russia-Ukraine war and to Middle East tensions target admin accounts at utilities, banks, and government agencies. The IMF has warned that cyber incidents have more than doubled since before the pandemic. Governments now require tighter privileged access controls, so buyers keep spending even when budgets are tight.
Regional Analysis
North America dominates the Privileged Access Management Solutions Market, holding a 33.2% share and generating USD 1.4 billion in revenue. The US drives most of this demand. The FBI’s Internet Crime Complaint Center logged losses of more than USD 16 billion in 2024, up 33% from 2023.
Canada adds steady demand from banks and public agencies under federal guidance from the Canadian Centre for Cyber Security. High cloud adoption across US enterprises also supports the region’s 57.6% cloud preference. Healthcare buyers face HIPAA rules and frequent ransomware attacks, so they are adding session monitoring and password vaulting at a fast pace.
Asia Pacific is the fastest-growing region in this market. India’s DPDP Act allows penalties of up to INR 250 crore per breach. CERT-In requires firms to report incidents within 6 hours. China, Japan, South Korea, and Australia are speeding up cloud adoption. India’s ARCON and ManageEngine serve price-sensitive mid-sized firms across the region.
Europe holds the second largest position. The NIS2 Directive covers 18 critical sectors and allows fines of up to EUR 10 million or 2% of global turnover. Germany, France, and the UK lead spending. The DORA rules for financial firms took effect in January 2025 and require strict control over ICT access. France’s WALLIX and the region’s strict data privacy rules support local and on-premises PAM choices.
Key Regions and Countries
North America
- US
- Canada
Europe
- Germany
- France
- The UK
- Spain
- Italy
- Rest of Europe
Asia Pacific
- China
- Japan
- South Korea
- India
- Australia
- Rest of APAC
Latin America
- Brazil
- Mexico
- Rest of Latin America
Middle East and Africa
- GCC
- South Africa
- Rest of MEA
Market Dynamics
Drivers
| Driver | (~) % Impact on CAGR Forecast | Geographic Relevance | Impact Timeline |
|---|---|---|---|
| Machine and Non-Human Identity Proliferation | +3.1% | Global | Short term (2 years or less) |
| Enforced Compliance Mandates (PCI DSS 4.0, NIS2, DORA) | +2.4% | Europe, North America | Short term (2 years or less) |
| Platform Consolidation by Security Majors | +1.8% | North America, Europe, Israel | Short term (2 years or less) |
| Cyber Insurance Underwriting Requirements | +1.4% | North America, UK | Short term (2 years or less) |
| Ransomware and Credential-Abuse Intrusion Volumes | +1.2% | Global | Medium term (2 to 4 years) |
| SaaS-Delivered PAM Migration | +1.0% | North America, Asia Pacific | Medium term (2 to 4 years) |
Machine and Non-Human Identity Proliferation
Cloud-native workloads, CI/CD pipelines, and AI services have moved the main privileged attack surface from human administrators to service accounts, API keys, and secrets. Per CyberArk’s 2025 Identity Security Landscape disclosures, machine identities now outnumber humans by about 82 to 1. Yet 88% of organizations still define privileged users as human-only, even though 42% of machine identities hold sensitive or privileged access.
That gap changes how PAM is priced. Licensing based on administrator seats (often 50 to 500 vaulted accounts per enterprise) is giving way to metering by identity and secret, which can multiply billable units by 10x to 80x. CyberArk’s SEC filings show revenue rising from about USD 1.0 billion in 2024 to USD 1.36 billion in 2025, with R&D at roughly 25% of revenue.
Palo Alto Networks’ investor disclosures make the strategic point clear. The company agreed to acquire CyberArk on July 30, 2025, at a 26% premium and closed the deal on February 11, 2026, explicitly to extend privilege controls to human, machine, and agentic identities.
Restraints
| Restraint | (~) % Impact on CAGR Forecast | Geographic Relevance | Impact Timeline |
|---|---|---|---|
| High Total Cost of Ownership for Mid-Market Buyers | -1.6% | Global | Short term (2 years or less) |
| Constrained IT Budgets and Elevated Borrowing Costs | -1.1% | Europe, Latin America, Emerging Asia | Short term (2 years or less) |
| Data Localization and Sovereignty Bans on Foreign SaaS | -0.8% | China, Middle East, India, Russia | Medium term (2 to 4 years) |
| Legacy OT and Mainframe Incompatibility | -0.6% | Global Industrial Economies | Medium term (2 to 4 years) |
| Procurement Freezes Post Vendor Consolidation | -0.5% | North America, Europe | Short term (2 years or less) |
High Total Cost of Ownership for Mid-Market Buyers
Full PAM rollouts need vaulting, session recording, credential rotation, and endpoint privilege elevation. Integration services commonly cost 1.5x to 3x the first-year licence, and payback typically takes 9 to 18 months. US Census Bureau firm-size data shows that firms with fewer than 500 employees make up more than 99% of businesses. Many of these firms have security budgets below 5% of IT spend.
The bottleneck is mostly about people, not licences. NIST guidance on least-privilege programs assumes dedicated identity engineers, and ISC2 workforce studies show mid-sized firms typically employ 1 to 3 security staff in total. The result is stalled purchases and shelfware: an estimated 30% to 40% of licensed privileged accounts are never onboarded.
For vendors, this means discounting of 20% to 35% to close mid-market deals, which compresses gross margins by 3 to 5 points. Buyers, meanwhile, delay CapEx by 2 to 3 budget cycles, a pattern visible in commentary on lengthening sales cycles in public security vendors’ earnings calls.
Challenges
| Challenge | (~) % CAGR Friction Drag | Geographic Relevance | Mitigation Horizon |
|---|---|---|---|
| Identity Security Talent Deficit | -1.4% | Global | Long term (4 years or more) |
| Multi-Cloud Entitlement Sprawl Complexity | -0.9% | North America, Europe, Asia Pacific | Medium term (2 to 4 years) |
| Admin User Workflow Resistance | -0.6% | Global | Short term (2 years or less) |
| Post-Merger Product Integration Friction | -0.5% | North America, Europe | Medium term (2 to 4 years) |
| Evolving Identity-Targeted Attack Techniques | -0.4% | Global | Long term (4 years or more) |
Identity Security Talent Deficit
PAM deployments depend on scarce architects who understand directory services, cloud IAM policy languages, and DevOps secrets workflows at the same time. ISC2 workforce studies estimate the global cybersecurity workforce gap at about 4.8 million professionals. Identity and access roles consistently rank among the hardest skill domains to fill.
US Bureau of Labor Statistics wage data puts information security analyst median pay above USD 120,000, and identity specialists earn a 10% to 20% premium on top of that. Implementations stretch from 3 months to 9 to 12 months, and partners report utilisation above 85%. Together, these reduce how quickly vendors can turn bookings into recognised revenue.
Over the long term, vendors will need to adjust by automating onboarding through AI-driven account discovery, building certification pipelines with university and CERT-In or ENISA skilling programs, and shifting to managed PAM delivery. That shift moves services revenue from roughly 15% toward 25% of vendor mix, though at lower margins.
Opportunities
| Opportunity | (~) % Potential CAGR Upside | Geographic Relevance | Execution Window |
|---|---|---|---|
| Agentic AI Privilege Governance | +2.2% | North America, Europe, Asia Pacific | Medium term (2 to 4 years) |
| MSP-Delivered PAM for SMEs | +1.3% | Global | Short term (2 years or less) |
| OT and Critical Infrastructure Remote Access | +1.0% | Europe, Middle East, North America | Medium term (2 to 4 years) |
| Sovereign Cloud PAM Editions | +0.8% | India, Middle East, Europe | Medium term (2 to 4 years) |
| Mid-Tier Vendor M&A Roll-Ups | +0.6% | North America, Europe | Short term (2 years or less) |
Agentic AI Privilege Governance
Autonomous AI agents that run code, call APIs, and change infrastructure are emerging as the most powerful privileged users. Still, very few enterprises yet manage them through vaulting, just-in-time elevation, or session controls.
Palo Alto Networks’ acquisition announcement for CyberArk singled out securing agentic AI through just-in-time access and least privilege as a core growth vector. Per-agent or per-action metering could raise revenue per customer by 30% to 50% with little extra hosting cost.
Because policy engines run on existing cloud control planes, incremental gross margins could exceed 80%, compared with 70% to 75% for traditional SaaS PAM. Cost per protected identity could also fall by 40% to 60% as ephemeral credentials replace rotated static secrets. Vendors that ship agent-native controls before regulators codify them will capture most of the expected margin gains.
Key Players Analysis
CyberArk leads Tier 1. Its R&D spending rose from USD 243.1 million in FY2024 to USD 343.9 million in FY2025, about 25% of revenue. Palo Alto Networks bought CyberArk for about USD 25 billion, a 26% premium. Shareholders received USD 45.00 in cash plus 2.2005 Palo Alto shares for each CyberArk share. The deal closed in February 2026.
IBM and Broadcom also sit in Tier 1 because of their scale. IBM reported software revenue of about USD 27.1 billion in 2024 and spent about USD 7.5 billion on R&D. Broadcom’s infrastructure software segment, which includes Symantec PAM, earned about USD 21.5 billion in FY2024 after its USD 69 billion VMware deal.
Tier 2 includes BeyondTrust, Delinea, and One Identity. All three are privately held by investment firms. Delinea agreed to buy StrongDM in January 2026 to add just-in-time access for developers and AI agents. The companies did not share the price. These firms compete on ease of use and lower total cost.
Regional challengers make up the rest of Tier 2. WALLIX leads in France. ARCON and ManageEngine serve India and other emerging markets. Senhasegura leads in Brazil. Micro Focus, now part of OpenText, and Hitachi ID round out the field with large installed bases.
Top Key Players in the Market
- CyberArk Software Ltd.
- BeyondTrust Corporation
- Delinea Inc.
- One Identity LLC
- IBM Corporation
- Broadcom Inc.
- ARCON TechSolutions Pvt. Ltd.
- WALLIX Group SA
- Micro Focus International plc
- ManageEngine – Zoho Corporation Pvt. Ltd.
- Hitachi ID Systems Inc.
- Senhasegura – MT4 Tecnologia Ltda.
Recent Developments
- In February 2025, CyberArk completed its purchase of Zilla Security for about USD 165 million. The deal added AI-powered identity governance to its privilege platform.
- In July 2025, Palo Alto Networks signed a deal to buy CyberArk for about USD 25 billion in cash and stock, a 26% premium. Palo Alto Networks reported that CyberArk and Chronosphere added USD 1.6 billion to next-generation security ARR of USD 8.1 billion.
Report Scope
| Report Features | Description |
|---|---|
| Market Value (2025) | USD 4.3 Billion |
| Forecast Revenue (2035) | USD 32.3 Billion |
| CAGR (2026-2035) | 22.4% |
| Base Year for Estimation | 2025 |
| Historic Period | 2020-2024 |
| Forecast Period | 2026-2035 |
| Report Coverage | Revenue Forecast, Market Dynamics, Competitive Landscape, Recent Developments |
| Segments Covered | By Component (Solution, Password Management, Access Control, Session Management, Others, Services); By Deployment (Cloud, On-premises); By End User (Banking, Financial Services, and Insurance (BFSI), Government and Public Administration, Healthcare and Life Sciences, IT and Telecommunication, Retail and E-Commerce, Energy and Utilities, Industrial Manufacturing) |
| Regional Analysis | North America – US, Canada; Europe – Germany, France, The UK, Spain, Italy, Rest of Europe; Asia Pacific – China, Japan, South Korea, India, Australia, Singapore, Rest of APAC; Latin America – Brazil, Mexico, Rest of Latin America; Middle East & Africa – GCC, South Africa, Rest of MEA |
| Competitive Landscape | CyberArk Software Ltd., BeyondTrust Corporation, Delinea Inc., One Identity LLC, IBM Corporation, Broadcom Inc., ARCON TechSolutions Pvt. Ltd., WALLIX Group SA, Micro Focus International plc, ManageEngine – Zoho Corporation Pvt. Ltd., Hitachi ID Systems Inc., Senhasegura – MT4 Tecnologia Ltda. |
| Customization Scope | We will provide customization for segments and region/country levels. Additionally, we can provide additional customization based on your requirements. |
| Purchase Options | We have three licenses to opt for: Single User License, Multi-User License (Up to 5 Users), Corporate Use License (Unlimited Users and Printable PDF) |