Report Overview
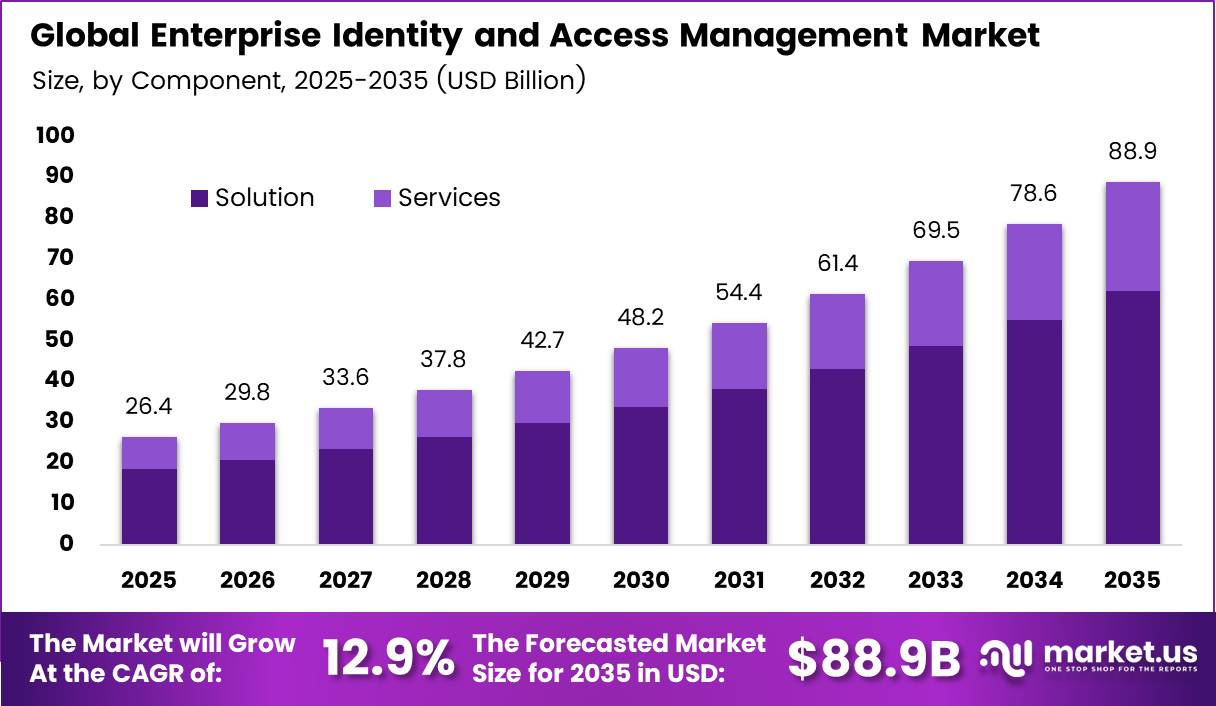
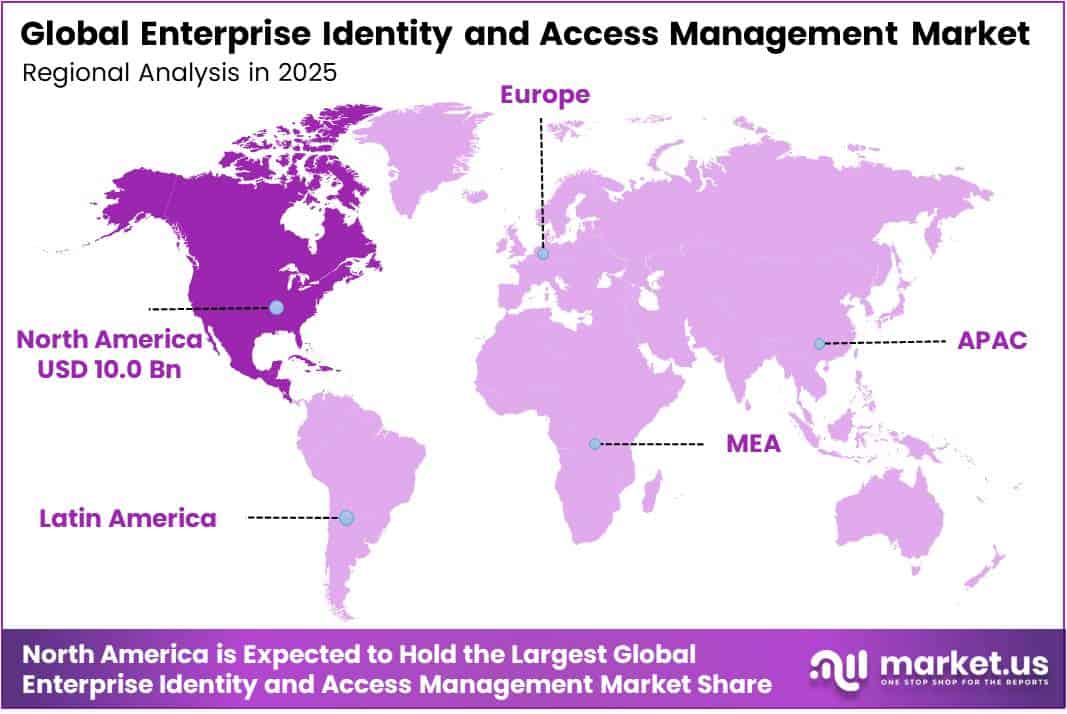
In 2025, the Global Enterprise Identity and Access Management Market was valued at USD 26.4 billion. The market is projected to grow at a CAGR of 12.9% during 2026–2035, reaching approximately USD 88.9 billion by 2035. North America dominated the global market in 2025, accounting for more than 38.0% of the total market share and generating approximately USD 10.0 billion in revenue.
Rising cybercrime losses drive this demand. The FBI Internet Crime Complaint Center (IC3) logged 859,532 complaints in 2024, with losses of USD 16.6 billion. That loss figure rose 33% over 2023. Cyber-enabled fraud made up almost 83% of losses, or USD 13.7 billion.
Business email compromise alone cost close to USD 2.8 billion across 21,442 complaints. Most of these attacks start with a stolen or misused login. So firms now spend more on single sign-on, multi-factor login, and privileged access tools. Banks, hospitals, and public agencies lead this spending because they hold the most sensitive records.
The North America region faces the highest attack pressure. IC3 data shows the average reported loss per complaint reached USD 19,372 in 2024. Ransomware complaints against critical infrastructure rose 9% in the same year. These numbers push US boards to fund identity controls first. Federal policy adds more pull.
Key Takeaways
- The Enterprise Identity and Access Management Market stood at USD 26.4 billion in 2025 and will reach USD 88.9 billion by 2035. The market will grow at a CAGR of 12.9% from 2026 to 2035.
- By component, Solution leads with a 71.2% share.
- By technology, Privileged Identity Access Management leads with a 36.6% share.
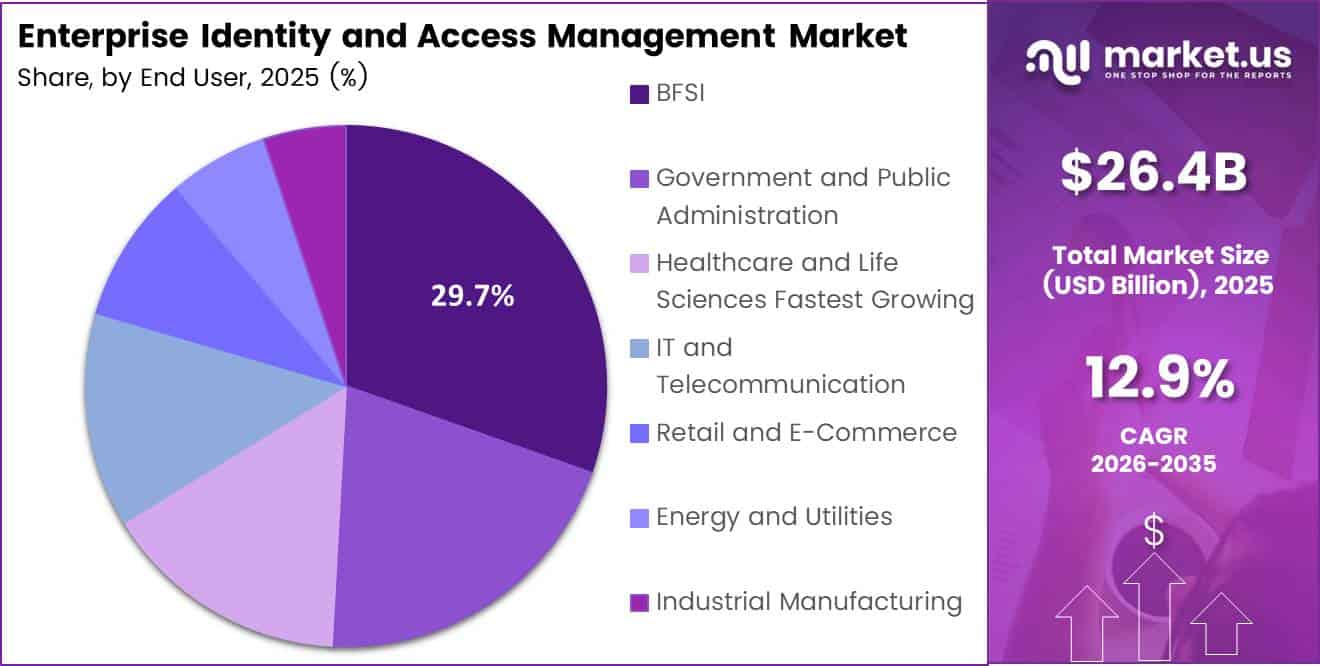
- By end user, BFSI leads with a 29.7% share.
- North America leads with a 38.0% share and USD 10.0 billion in revenue.
By Component
Solution dominates with 71.2% due to direct defense against stolen credential attacks.
Solutions lead because buyers want tools that stop the most common attacks. Verizon’s 2025 report reviewed 12,195 confirmed data breaches. Credential abuse was the top way attackers got in, at 22%. Lifecycle automation, login checks, and access control tackle this risk directly, so most of the budget goes to software rather than consulting.
Verizon also found that firms took a median of 94 days to fix leaked secrets found in code repositories. That gap pushes companies toward automated tools that issue, rotate, and remove access without manual steps, and only solution platforms can deliver that at scale.
The Others group, which covers newer tools such as passwordless login, digital identity checks, and protection against fake identities, is growing fastest. IBM found that 16% of breaches in 2025 involved attackers using AI, and deepfake impersonation drove 35% of those AI-based attacks.
By Technology
Privileged Identity and Access Management dominates with 36.6% due to costly insider threats on admin accounts.
Admin accounts hold the keys to servers, databases, and cloud consoles, so firms protect them first. IBM reports that malicious insider attacks caused the highest average breach cost of any attack type, at USD 4.92 million. Privileged access tools limit, record, and time-box these powerful logins, which gives security leaders a clear return on spending.
People remain the weak link. Verizon notes that the human element shows up in roughly 60% of breaches. Privileged access controls reduce the damage any single person can do, whether by mistake or on purpose. Auditors in banking and government also ask for these controls by name.
The Others group, which includes machine identities, partner access and secure access for AI agents, is rising fastest. Verizon found that breaches involving a third party doubled from 15% to 30% in one year. Vendors, bots and software services now log into company systems every day.
By End User
Banking, Financial Services, and Insurance (BFSI) dominates with 29.7% due to strict rules on customer account security.
Banks and insurers face high stakes when attackers break into accounts. IBM puts the average breach cost in financial services at USD 5.56 million, second only to healthcare. Regulators expect strong logins, clear access reviews, and fraud checks, so BFSI firms built identity programs early and still spend the most.
Healthcare and life sciences are now the fastest-growing user group. According to HHS, the Change Healthcare attack affected about 192.7 million people, the largest health data breach in U.S. history. Overall, OCR investigated 663 large breaches that occurred in 2024, exposing data on 242.9 million people.
The cost burden adds pressure. IBM reports that the average healthcare breach costs USD 7.42 million, the highest of any industry. Hospitals run many shared workstations, outside vendors, and remote portals, which leaves many weak entry points.
Key Market Segments
By Component
- Solution
- Identity Lifecycle Automation
- Authentication and Access Control
- Fraud and Risk Analytics
- Others
- Services
By Technology
- Privileged Identity Access Management
- Workforce Identity
- Customer Identity
- Others
By End User
- Banking, Financial Services, and Insurance (BFSI)
- Government and Public Administration
- Healthcare and Life Sciences
- IT and Telecommunication
- Retail and E-Commerce
- Energy and Utilities
- Industrial Manufacturing
- Others
Geopolitical Impact Analysis
Trade tension hits identity hardware first. Smart cards, FIDO security keys, biometric readers, and hardware security modules all rely on chips and rare earth parts made in Asia. The WTO projected that world goods trade would fall 0.2% in 2025 under the April tariff measures. It warned that US reciprocal tariffs would cut another 0.6 percentage points from trade growth.
The China and US standoff worsened in late 2025. China added new export controls on rare earth metals used in electronics. The US answered with new 100% duties on Chinese imports. Rare earths go into the sensors and magnets inside badge readers and biometric devices. Buyers now face longer lead times and must qualify second-source suppliers, which raises rollout costs for physical access projects.
Smaller exporters face pressure too. The WTO noted that Bangladesh goods face a fresh 37% US tariff. Many device makers assemble readers and tokens in South and Southeast Asia, so these duties raise unit costs. The WTO cut its 2026 trade volume growth forecast to 0.5% from 1.8%, which signals weak hardware shipment growth.
Shipping risk adds further delays. UNCTAD reported that Red Sea diversions around the Cape of Good Hope add about 10 to 14 days to Asia and Europe voyages. Software sales avoid most of these costs. This gap pushes buyers toward cloud and passwordless options that need no physical tokens.
Regional Analysis
North America dominates the Enterprise Identity and Access Management Market, holding a 38.0% share and generating USD 10.0 billion in revenue. The US drives most of this value. Large banks, insurers, and health systems run millions of user accounts across cloud and on-premises apps. Each account needs secure login and role control. Federal rules add steady demand.
Asia Pacific is the fastest-growing region in the market. India runs Aadhaar with more than 1.3 billion enrolled IDs, and its Digital Personal Data Protection Act allows penalties up to INR 250 crore. China, Japan, South Korea, and Australia are expanding cloud use quickly. Fast fintech growth and new data laws push regional firms to replace passwords with modern identity platforms.
Europe holds the second largest position. The NIS2 Directive covers 18 sectors and allows fines of up to EUR 10 million or 2% of global turnover for essential entities. The eIDAS 2.0 rule asks every member state to offer a European Digital Identity Wallet. Germany, France, and the UK lead spending, while Spain and Italy grow through banking upgrades under PSD2 strong customer login rules.
Key Regions and Countries
North America
- US
- Canada
Europe
- Germany
- France
- The UK
- Spain
- Italy
- Rest of Europe
Asia Pacific
- China
- Japan
- South Korea
- India
- Australia
- Rest of APAC
Latin America
- Brazil
- Mexico
- Rest of Latin America
Middle East and Africa
- GCC
- South Africa
- Rest of MEA
Market Dynamics
Drivers
| Driver | (~) % Impact on CAGR Forecast | Geographic Relevance | Impact Timeline |
|---|---|---|---|
| Credential-Centric Breach Escalation | +2.4% | Global | Short term (2 years or less) |
| Zero Trust Architecture Mandates | +1.9% | North America, Europe | Medium term (2 to 4 years) |
| SaaS and Multi-Cloud Sprawl | +1.6% | Global | Short term (2 years or less) |
| Compliance Regimes (NIS2, DORA, DPDP) | +1.4% | Europe, Asia Pacific | Short term (2 years or less) |
| Third-Party Access Governance Need | +1.1% | Global | Medium term (2 to 4 years) |
| Phishing-Resistant MFA Adoption | +0.9% | North America, Asia Pacific | Short term (2 years or less) |
Credential-Centric Breach Escalation
Identity is still the main way attackers get in, and that is turning IAM from a perpetual-license directory purchase into a subscription security platform that boards approve. Verizon DBIR data shows credential abuse was the top initial access vector at 22% of breaches in 2025, ahead of vulnerability exploitation at 20%.
The same data shows 88% of basic web application breaches involved stolen credentials, and third-party involvement doubled from 15% to 30%. Over the same period, brute-force activity against web apps rose from about 20% to 60%, and 2.8 billion passwords were posted on criminal forums in 2024. Okta’s investor filings show the commercial effect: fiscal 2026 subscription revenue grew 12%, and RPO grew 15%.
Restraints
| Restraint | (~) % Impact on CAGR Forecast | Geographic Relevance | Impact Timeline |
|---|---|---|---|
| Security Budget Freezes and Cuts | -1.2% | North America, Europe | Short term (2 years or less) |
| High Migration Cost from Legacy IAM | -0.9% | Global | Medium term (2 to 4 years) |
| Data Sovereignty Hosting Restrictions | -0.7% | Europe, Middle East, China | Medium term (2 to 4 years) |
| Elevated Cost of Capital for SMEs | -0.6% | Emerging Markets | Short term (2 years or less) |
| Public-Sector Procurement Delays | -0.4% | North America, Asia Pacific | Short term (2 years or less) |
Security Budget Freezes and Cuts
Tight macro conditions have made CFOs scrutinize identity spending more closely. As a result, net-new deals are being frozen and existing seat counts trimmed at renewal. In the ISC2 workforce study, 33% of organizations said they lack the budget to staff security teams properly, and 29% said they cannot afford staff with the skills they need. Cybersecurity layoffs were still reported at 24% in 2025.
Okta’s earnings calls show the same pressure: management guided fiscal 2027 growth to roughly 9% to 10%, down from 12% in fiscal 2026, and net retention was 107%. For vendors, this means pricing concessions at renewal, deals delayed by one or two quarters, and more sales and marketing spend needed for each unit of new ARR.
Challenges
| Challenge | (~) % CAGR Friction Drag | Geographic Relevance | Mitigation Horizon |
|---|---|---|---|
| Identity Engineering Skills Gap | -0.9% | Global | Long term (4 years or more) |
| MFA Bypass Technique Evolution | -0.7% | Global | Medium term (2 to 4 years) |
| Fragmented Identity Silos Integration | -0.6% | North America, Europe | Medium term (2 to 4 years) |
| Vendor Platform Breach Trust | -0.4% | Global | Short term (2 years or less) |
| Secrets Sprawl in DevOps | -0.3% | North America, Asia Pacific | Medium term (2 to 4 years) |
Identity Engineering Skills Gap
The binding constraint has moved from headcount to specialized skills. Mature IAM work requires practitioners who can design policy-as-code, govern entitlements, and orchestrate federation, and these skills are scarce.
The ISC2 workforce study, drawn from 16,029 respondents, found that 30% of organizations cannot find people with the skills they need. Only 34% reported adequate staffing. Verizon DBIR data shows that leaked secrets found in GitHub repositories took a median of 94 days to remediate.
Opportunities
| Opportunity | (~) % Potential CAGR Upside | Geographic Relevance | Execution Window |
|---|---|---|---|
| AI Agent and Non-Human Identity Security | +2.2% | Global | Medium term (2 to 4 years) |
| Passwordless and Passkey Monetization | +1.3% | North America, Europe | Short term (2 years or less) |
| Mid-Market Bundled IAM Suites | +1.0% | Asia Pacific, Latin America | Medium term (2 to 4 years) |
| Identity Threat Detection and Response | +0.9% | Global | Short term (2 years or less) |
| Decentralized Digital Identity Wallets | +0.6% | Europe, India | Long term (4 years or more) |
AI Agent and Non-Human Identity Security
Securing AI agents is still largely untapped. Most enterprises do not yet apply lifecycle governance, least-privilege policy, or audit trails to autonomous agents, service accounts, and API tokens, and current baseline revenue comes almost entirely from human workforce and customer identities.
On Okta’s fiscal 2026 earnings call, management framed its platform as built to secure every identity, “from humans to AI agents.” That positioning is still early-stage rather than a contributor to reported revenue. Verizon DBIR data shows software vulnerabilities now account for 31% of initial access, ahead of stolen passwords.
Machine-to-machine attack surfaces are a growing, under-addressed risk. Charging per agent and per token could add 15% to 25% to revenue per customer at near-zero marginal hosting cost. That could lift contribution margins by roughly 3 to 5 percentage points for vendors that act before this becomes a standard, commoditized feature.
Key Players Analysis
Tier 1 leaders combine global reach with large balance sheets. Oracle posted total revenue of USD 57.4 billion in FY2025 and sells identity tools inside its cloud stack. Broadcom bought VMware for about USD 69 billion in 2023 and offers the Symantec identity suite to large enterprises. SAP builds identity services into its enterprise software base and reaches a large installed base of business customers.
Thales leads in digital identity hardware and software. The group posted 2025 sales of EUR 22.1 billion. Its Cyber and Digital segment earned EUR 3,852 million, including EUR 2,397 million from Digital Identity and EUR 1,455 million from Cyber. That segment delivered adjusted EBIT of EUR 526 million, a 13.7% margin.
CyberArk leads privileged access. Its revenue grew from USD 1.0 billion in 2024 to USD 1.36 billion in 2025. It raised R&D spending from USD 243.1 million to USD 343.9 million over the same period, about 25% of revenue. Palo Alto Networks now owns CyberArk.
Tier 2 challengers hold strong niche positions. Thoma Bravo took SailPoint private for USD 6.9 billion in 2022 and bought Ping Identity for USD 2.8 billion in 2022. It later merged ForgeRock into Ping, which built a large customer identity player. One Identity, SecureAuth, HID Global, and RSA Security compete in governance, adaptive login, physical access, and token markets.
Top Key Players in the Market
- Oracle Corporation
- Ping Identity Corporation
- CyberArk Software Ltd.
- SailPoint Technologies Holdings, Inc.
- Broadcom Inc.
- Thales Group
- SAP SE
- ForgeRock, Inc.
- One Identity LLC
- SecureAuth Corporation
- HID Global Corporation
- RSA Security LLC
Recent Developments
- In February 2025, SailPoint returned to Nasdaq and raised USD 1.38 billion in an upsized IPO, selling 60 million shares at USD 23 each.
- In July 2025, Palo Alto Networks agreed to buy CyberArk for about USD 25 billion, paying USD 45.00 in cash plus 2.2005 Palo Alto shares per CyberArk share, a 26% premium.
- In July 2026, Okta agreed to buy AI identity threat detection startup Permiso Security for just under USD 200 million in an almost all-cash deal.
- In October 2026, Proofpoint agreed to buy data and identity security firm Varonis Systems in a USD 6.3 billion deal.
Report Scope
| Report Features | Description |
|---|---|
| Market Value (2025) | USD 26.4 Billion |
| Forecast Revenue (2035) | USD 88.9 Billion |
| CAGR (2026-2035) | 12.9% |
| Base Year for Estimation | 2025 |
| Historic Period | 2020-2024 |
| Forecast Period | 2026-2035 |
| Report Coverage | Revenue Forecast, Market Dynamics, Competitive Landscape, Recent Developments |
| Segments Covered | By Component (Solution, Identity Lifecycle Automation, Authentication and Access Control, Fraud and Risk Analytics, Others, Services); By Technology (Privileged Identity Access Management, Workforce Identity, Customer Identity, Others); By End User (Banking, Financial Services, and Insurance (BFSI), Government and Public Administration, Healthcare and Life Sciences, IT and Telecommunication, Retail and E-Commerce, Energy and Utilities, Industrial Manufacturing, Others) |
| Regional Analysis | North America – US, Canada; Europe – Germany, France, The UK, Spain, Italy, Rest of Europe; Asia Pacific – China, Japan, South Korea, India, Australia, Singapore, Rest of APAC; Latin America – Brazil, Mexico, Rest of Latin America; Middle East & Africa – GCC, South Africa, Rest of MEA |
| Competitive Landscape | Oracle Corporation, Ping Identity Corporation, CyberArk Software Ltd., SailPoint Technologies Holdings, Inc., Broadcom Inc., Thales Group, SAP SE, ForgeRock, Inc., One Identity LLC, SecureAuth Corporation, HID Global Corporation, RSA Security LLC |
| Customization Scope | Customization for segments, region/country-level will be provided. Moreover, additional customization can be done based on the requirements. |
| Purchase Options | We have three licenses to opt for: Single User License, Multi-User License (Up to 5 Users), Corporate Use License (Unlimited Users and Printable PDF) |