Report Overview
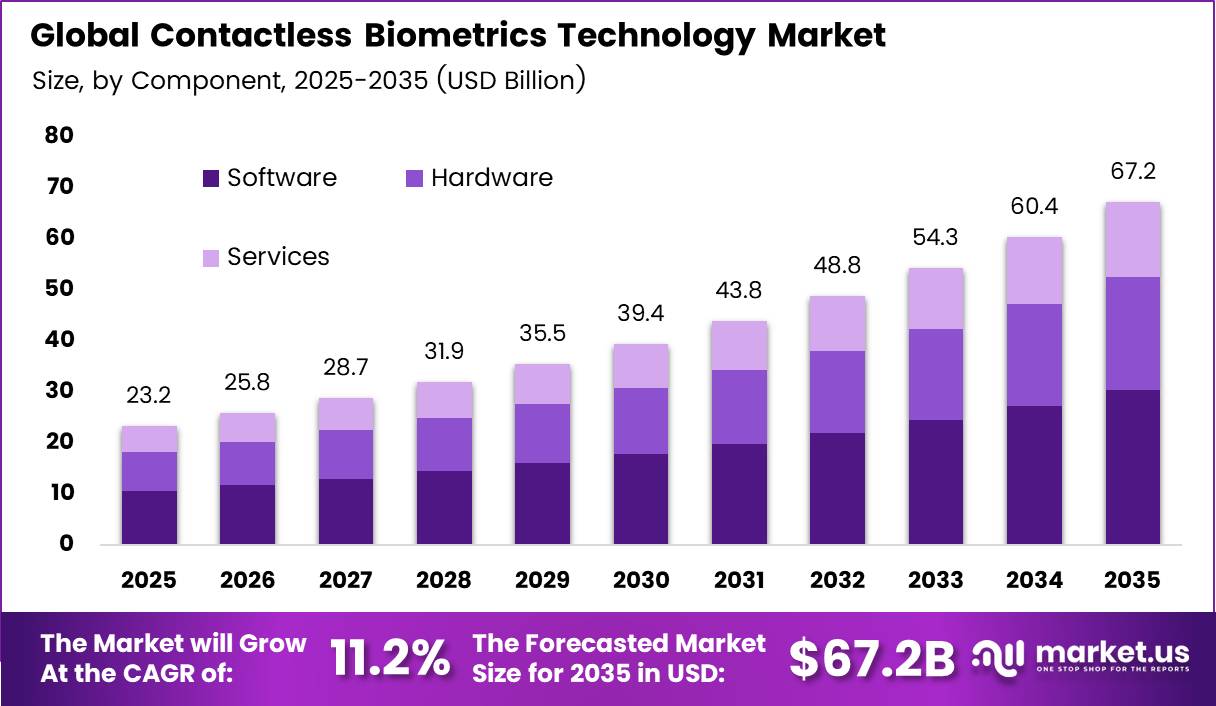
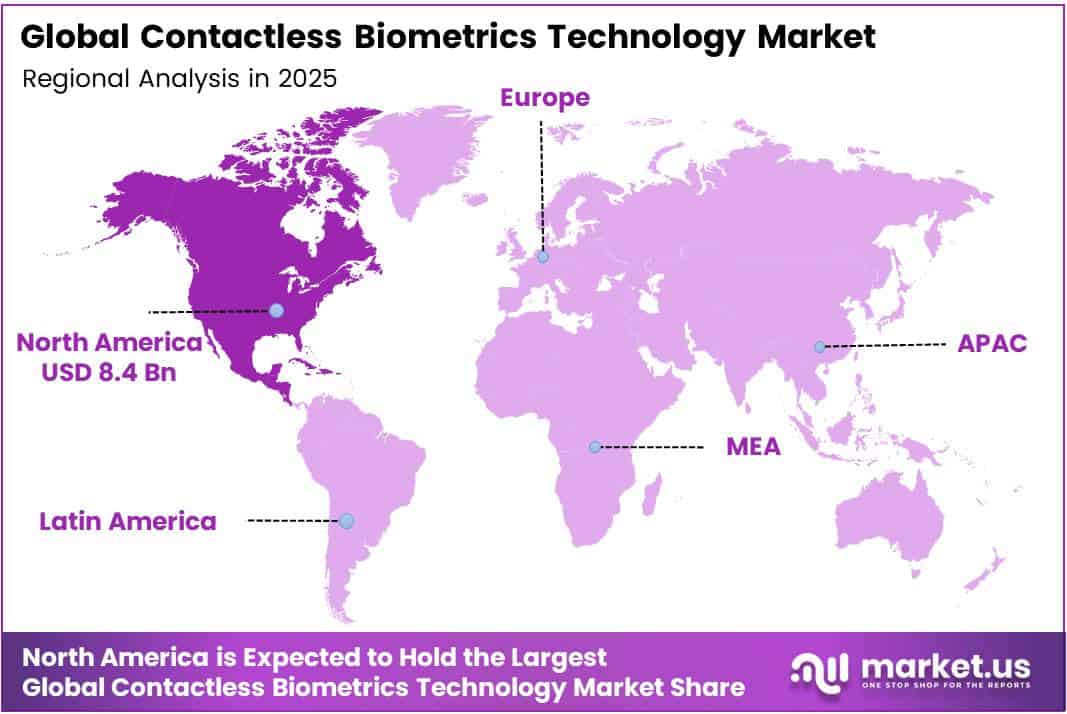
In 2025, the Global Contactless Biometrics Technology Market was valued at USD 23.2 billion. The market is projected to grow at a CAGR of 11.2% during 2026–2035, reaching approximately USD 67.2 billion by 2035. North America dominated the global market in 2025, accounting for more than 36.0% of the total market share and generating approximately USD 8.4 billion in revenue.
According to the Unique Identification Authority of India (UIDAI), Aadhaar holders completed more than 2,707 crore authentication transactions in 2024-25. That total includes 247 crore transactions in March 2025 alone. Since launch, total Aadhaar authentications have crossed 14,800 crore. Every one of these checks needs fast and reliable proof of identity.
Federal border programs anchor this lead. U.S. Customs and Border Protection (CBP) reports that it has used biometric facial comparison to process over 1 billion travelers. A Department of Homeland Security final rule took effect. It lets CBP photograph all noncitizens when they enter or leave the country.
The rule also removes old limits that kept biometric exit inside pilot programs. This creates steady demand for contactless cameras at airports, seaports, and land crossings. Large airlines, banks, and enterprises in the US and Canada also adopt face-based access and payment tools early. This early adoption keeps the region ahead.
Key Takeaways
- The Contactless Biometrics Technology Market reached USD 23.2 billion in 2025 and will hit USD 67.2 billion by 2035. The market will grow at a CAGR of 11.2% from 2026 to 2035.
- By Component, Software leads with a 45.0% share.
- By Technology, Facial Recognition leads with a 45.0% share.
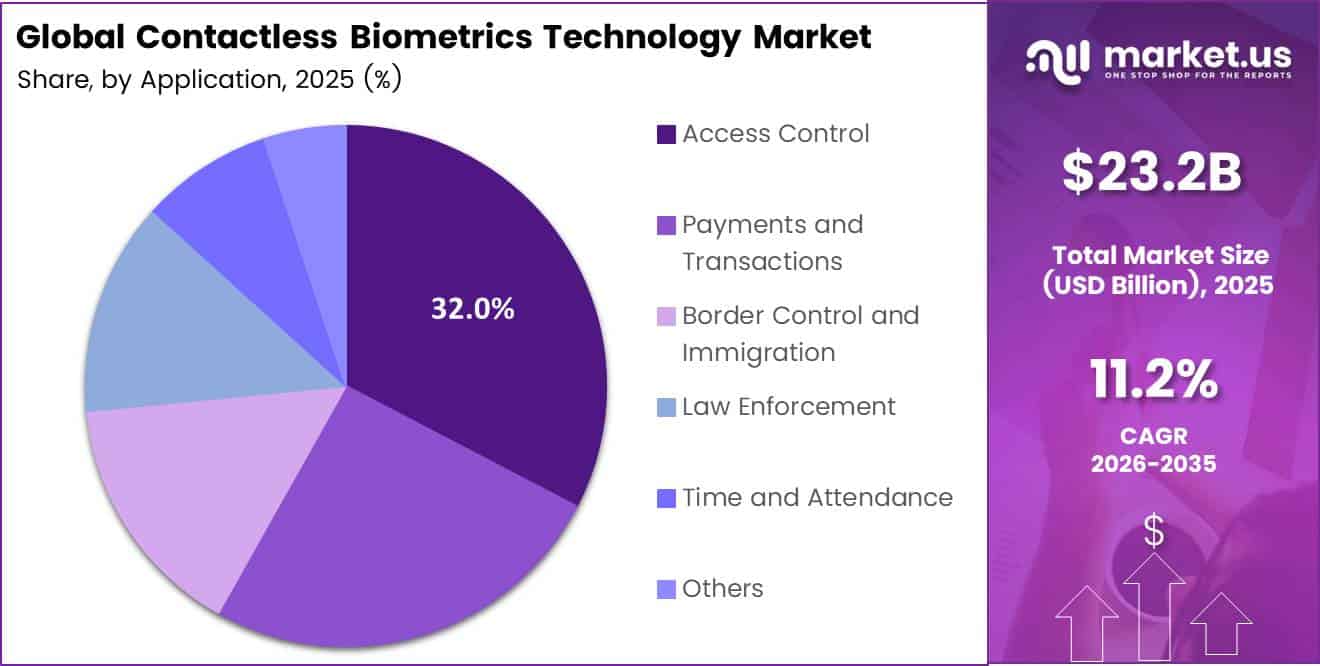
- By Application, Access Control leads with a 32.0% share.
- By End-Use Industry, Government and Public Sector leads with a 23.0% share.
- North America leads with a 36.0% share and USD 8.4 billion in revenue.
By Component
Software dominates with 45.0% due to scalable matching engines and remote updates.
Software holds the top share because buyers spend most of their budget on the matching engine. This engine turns a face, palm, or iris scan into a fast yes-or-no decision. Independent tests show how strong these engines have become. NIST testing found that 45 of 105 identification algorithms passed 99% accuracy on high-quality images, matched against a gallery of 1.6 million templates.
Services are the fastest-growing component because large buyers need expert help with setup, tuning, and keeping systems running. U.S. CBP is seeking walk-through facial systems for 38 airport terminals. These systems must run 99% of the time and cut processing from about 45 seconds to under 6 seconds. Hitting targets like these takes integrators, managed support, and ongoing camera tuning.
By Technology
Facial Recognition dominates with 45.0% due to cameras already built into phones.
Facial Recognition leads because it needs only a camera, and most phones, kiosks, laptops, and gates already have one. Users touch nothing, and a check takes a few seconds. This low setup cost lets agencies and firms roll it out fast. India shows the scale clearly. UIDAI reports that Aadhaar face authentication reached 200 crore transactions in August 2025. That count doubled from 100 crore in under six months.
Monthly use keeps rising. UIDAI logged 18.6 crore face checks in one recent August, up from 6.04 crore in the same month a year earlier. More than 100 government and private entities now use face checks to deliver benefits and services.
Palm Vein Recognition is the fastest-growing technology as retailers look for a fraud-resistant way to pay by hand. Amazon One reads both the palm and the vein pattern beneath it, so no one can copy it like a card or password. Amazon brought the service to all 500+ Whole Foods Market stores after it passed 3 million uses across more than 400 locations.
By Application
Access Control dominates with 32.0% due to daily entry checks across offices and campuses.
Access Control holds the largest share because every office, campus, data center, and public service desk must confirm who gets in. Contactless checks replace cards and PINs, which people often lose, share, or forget. National ID systems show how large this gatekeeping has become.
UIDAI says Aadhaar holders completed more than 2,707 crore authentication transactions in 2024-25. That includes 247 crore in March 2025 alone. Each check opens access to a benefit, a service, or an account. Repeat daily use creates steady demand for readers, software licenses, and upgrades. Buyers also like that one biometric system can control doors, logins, and service counters together.
Payments and Transactions is the fastest-growing application as digital payments surge, and banks add biometric steps to stop fraud. NPCI data shows UPI processed 205.24 billion transactions from January to September 2026, up 24% year on year.
Biometric payments are rising as well. AePS, which runs on Aadhaar biometrics, handled 100 million transactions in July 2026, up from 88 million in May. As volumes climb, merchants and banks turn to face and palm approval to keep checkout fast and safe.
By End-Use Industry
Government and Public Sector dominates with 23.0% due to national ID and border programs.
Government and Public Sector leads because public agencies run the world’s largest identity programs, from borders to welfare payouts. They also buy at national scale with multi-year budgets, which locks in large and steady orders. U.S. Customs and Border Protection has used facial comparison to verify more than 1 billion travelers at air, land, and sea ports of entry.
Clear results support more spending. Since 2018, CBP matching has flagged more than 600,000 visa overstays and stopped over 2,346 impostors. The agency also reports matching accuracy above 98% in vehicle lanes at land crossings. Results like these help agencies get budget approval for expansion.
BFSI is the fastest-growing end-use industry as banks fight account takeover while serving a huge digital customer base. NPCI data shows 752 banks live on UPI in August 2026, and average daily UPI transactions passed 800 million for the first time in September 2026. Every new account and high-value transfer needs stronger proof of identity than a password or OTP.
Key Market Segments
By Component
- Hardware
- Software
- Services
By Technology
- Facial Recognition
- Iris Recognition
- Contactless Fingerprint Recognition
- Palm Vein Recognition
- Voice Recognition
- Others
By Application
- Access Control
- Payments and Transactions
- Border Control and Immigration
- Law Enforcement
- Time and Attendance
- Others
By End-Use Industry
- Government and Public Sector
- Banking, Financial Services, and Insurance (BFSI)
- Consumer Electronics
- Healthcare and Life Sciences
- Transportation and Logistics
- Defense and Security
- Retail and E-commerce
- Others
Geopolitical Impact Analysis
Trade tensions now shape the cost of cameras, sensors, and chips used in contactless biometric devices. The WTO cut its 2025 world merchandise trade growth outlook to 0.9%, down from 2.7% before the tariff increases. Most biometric hardware runs on chips and image sensors made in Asia. So slower trade growth directly squeezes component supply for terminal makers.
Higher US “reciprocal” tariffs took effect. The WTO expects them to weigh on imports through 2026. It lowered the 2026 trade volume growth outlook to 1.8% from 2.5%. Device makers that ship face readers and palm scanners into the US now face higher landed costs. Many pass part of these costs to buyers through higher prices.
Buyers rushed to stock up before the tariffs took effect. The WTO found that US imports rose 11% year on year in volume in the first half of 2025, due to frontloading and inventory buildup. Integrators placed early orders for access control terminals and border kiosks. This pulled demand forward and left gaps in supply for later quarters.
Shipping risks add more pressure. UNCTAD reported that container tonnage crossing the Suez Canal fell by 82% by early February 2024. Ships from Asia to Europe that reroute around Africa add about 12 days per trip. UNCTAD says this equals roughly a 30% rise in transit times. European integrators that import Asian camera modules must now hold larger safety stocks.
Regional Analysis
North America dominates the Contactless Biometrics Technology Market, holding a 36.0% share and generating USD 8.4 billion in revenue. The US federal government drives this lead with large, long-term identity programs. The Department of Homeland Security published its biometric entry and exit final rule.
Asia Pacific shows the fastest growth in adoption. India leads in scale. UIDAI recorded 28.29 crore face authentication transactions in November 2025, up from 12.04 crore in November 2024. Total Aadhaar authentications reached 231 crore that month, a growth of about 8.5%.
Europe holds a strong second position, led by large border programs. The EU Entry/Exit System became fully operational across 29 European countries. It replaced manual passport stamps with digital records of fingerprints and facial images for non-EU short-stay travelers. Germany, France, Spain, and Italy run large external border points and need many kiosks and gates.
Key Regions and Countries
North America
- US
- Canada
Europe
- Germany
- France
- The UK
- Spain
- Italy
- Rest of Europe
Asia Pacific
- China
- Japan
- South Korea
- India
- Australia
- Rest of APAC
Latin America
- Brazil
- Mexico
- Rest of Latin America
Middle East and Africa
- GCC
- South Africa
- Rest of MEA
Market Dynamics
Drivers
| Driver | (~) % Impact on CAGR Forecast | Geographic Relevance | Impact Timeline |
|---|---|---|---|
| Digital Travel Credentials and Automated Border Control Rollouts | +2.4% | North America, Europe, Middle East | Short term (2 years or less) |
| Biometric Payment Authentication at Point of Sale | +1.9% | Asia Pacific, Europe | Medium term (2 to 4 years) |
| National Digital ID Program Expansion | +1.6% | Asia Pacific, Africa, Latin America | Medium term (2 to 4 years) |
| Post-Pandemic Hygiene-Driven Touchless Access Control | +1.1% | Global | Short term (2 years or less) |
| Smartphone Face and Iris Sensor Integration | +1.3% | Global | Short term (2 years or less) |
Digital Travel Credentials and Automated Border Control Rollouts
The root cause is a policy-driven shift at borders from checking documents to verifying faces. The EU Entry/Exit System began its phased go-live in October 2025 and requires facial images and fingerprints for non-EU travellers at more than 1,800 external border points, according to European Commission implementation notices.
The U.S. Transportation Security Administration has expanded facial comparison technology to more than 250 airports, per TSA program updates. On the volume side, the International Air Transport Association reports that global passenger traffic recovered to above 100% of pre-pandemic levels in 2024, which puts pressure on airports to shorten processing times.
Contactless e-gates can bring per-passenger processing down from roughly 45 seconds to under 15 seconds, consistent with ICAO Digital Travel Credential pilot benchmarks. Commercially, this is changing how vendors earn revenue. Instead of one-off hardware sales, they are moving to multi-year managed-service and per-transaction contracts with airport operators and border agencies.
These contracts carry recurring software margins of about 60% to 70%, compared with roughly 30% to 35% for hardware alone, a mix shift visible in annual reports from listed identity-solution providers such as IDEMIA’s parent disclosures and Thales Digital Identity segment results.
Restraints
| Restraint | (~) % Impact on CAGR Forecast | Geographic Relevance | Impact Timeline |
|---|---|---|---|
| EU AI Act Prohibitions on Real-Time Remote Biometric Identification | -1.8% | Europe | Short term (2 years or less) |
| Municipal and State Facial Recognition Bans | -1.0% | North America | Short term (2 years or less) |
| BIPA-Style Biometric Litigation Exposure | -0.9% | North America | Medium term (2 to 4 years) |
| High Upfront Deployment Costs for SMEs | -0.7% | Emerging Markets, Global | Medium term (2 to 4 years) |
| Public Procurement Budget Freezes | -0.5% | Europe, Latin America | Short term (2 years or less) |
EU AI Act Prohibitions on Real-Time Remote Biometric Identification
The root cause is legal. Article 5 of the EU AI Act, published in the Official Journal of the European Union, bans real-time remote biometric identification in publicly accessible spaces for law enforcement, with only narrow exceptions.
These prohibitions have applied since 2 February 2025, and violations can draw fines of up to €35 million or 7% of global annual turnover, according to European Commission guidance. In addition, contactless biometric categorisation and identification systems are classed as high-risk under Annex III.
The practical effect is that public-safety tenders for live facial recognition have been frozen across member states. Vendors face compliance costs of roughly 10% to 15% of project value, which compresses EBITDA margins by an estimated 3 to 5 percentage points, as flagged in earnings calls of European-listed security integrators.
Challenges
| Challenge | (~) % CAGR Friction Drag | Geographic Relevance | Mitigation Horizon |
|---|---|---|---|
| Deepfake Presentation Attack Escalation | -1.2% | Global | Medium term (2 to 4 years) |
| Demographic Accuracy Bias Gaps | -0.8% | North America, Europe, Africa | Long term (4 years or more) |
| Edge AI Chip Supply Constraints | -0.6% | Asia Pacific, Global | Medium term (2 to 4 years) |
| Biometric Security Talent Shortage | -0.5% | Global | Long term (4 years or more) |
| Cross-Vendor Template Interoperability Gaps | -0.4% | Global | Medium term (2 to 4 years) |
Deepfake Presentation Attack Escalation
The structural weakness is that contactless capture happens at a distance, so it is easier to spoof than touch-based sensors. Injection and presentation attacks using generative AI are scaling fast. Europol’s threat assessments identify synthetic media as a fast-growing enabler of identity fraud.
The friction is measurable. Liveness detection certified to ISO/IEC 30107-3 must keep attack presentation classification error rates below 1%, according to NIST Face Analysis Technology Evaluation benchmarks. Vendors report spending about 15% to 20% of R&D budgets on anti-spoofing countermeasures.
Over the long term, firms will need continuous retraining pipelines, multimodal fusion that combines face with iris or palm vein, and recurring third-party certification audits. These measures add an estimated 8% to 12% to the cost per authentication over a product’s lifecycle, which caps adoption speed in high-assurance banking deployments.
Opportunities
| Opportunity | (~) % Potential CAGR Upside | Geographic Relevance | Execution Window |
|---|---|---|---|
| Biometrics-as-a-Service for Mid-Market Enterprises | +1.7% | North America, Europe, Asia Pacific | Medium term (2 to 4 years) |
| Healthcare Patient Identification and Contactless Vitals | +1.2% | North America, Europe | Medium term (2 to 4 years) |
| Automotive In-Cabin Driver Authentication | +1.0% | Europe, Asia Pacific | Long term (4 years or more) |
| Privacy-Preserving On-Device Template Licensing | +0.8% | Europe, Global | Medium term (2 to 4 years) |
| Identity Platform M&A Roll-Ups | +0.6% | Global | Short term (2 years or less) |
Biometrics-as-a-Service for Mid-Market Enterprises
This opportunity is still largely untapped. Current growth is concentrated in large government and airport contracts, while firms with 50 to 1,000 employees remain mostly underserved. The OECD’s SME digitalisation surveys show that fewer than 20% of mid-sized firms use advanced authentication beyond passwords and OTPs, which represents a sizable share of unmet demand.
The white space lies in cloud-hosted face and palm verification sold per user per month. This model removes upfront hardware CapEx and turns deployment into an operating expense. U.S. Census Bureau Annual Business Survey data on cloud adoption suggest subscription pricing can cut adoption friction for mid-market buyers by roughly 40%.
For vendors, the unit economics change sharply. Cost per enrolled identity could fall from about $25 to $30 under on-premises models to under $5 annualised on multi-tenant infrastructure. Gross margins could rise from roughly 45% to 70% or more, in line with the subscription margin profiles disclosed in annual reports of listed identity SaaS providers.
Key Players Analysis
Tier 1 leaders include Thales Group, NEC Corporation, and IDEMIA. Thales posted group sales of about €22.1 billion in 2025. Its Cyber and Digital segment earned €3,852 million, and Digital Identity alone brought in €2,397 million. Digital Identity grew 1.0% on an organic basis, and it posted adjusted EBIT of €301 million. Thales spends about €4.5 billion a year on R&D, close to 20% of sales.
NEC reported revenue of JPY 3,423.4 billion for the fiscal year ending March 2025, up 5.3%. Its corporate expenses, mainly R&D for advanced technology, reached JPY 20,986 million. NEC guides full-year revenue for its current fiscal year at JPY 3,560.0 billion. Its face recognition engines support airport and police programs worldwide.
IDEMIA is reshaping its business. It sold IDEMIA Smart Identity to IN Groupe on July 1, 2025. Owner Advent International is now in talks to sell the public safety division, which is valued at €2 billion to €3 billion. This division covers airport security and facial recognition.
Tier 2 challengers hold strong regional or niche positions. Suprema earned KRW 137.30 billion in 2025, up 26.86%, driven by access control and time and attendance products. HID Global, Fujitsu, Aware, Cognitec, Innovatrics, DERMALOG, and other specialists compete in palm vein, iris, and face matching software.
Top Key Players in the Market
- Thales Group
- NEC Corporation
- IDEMIA
- HID Global Corporation
- Fujitsu Limited
- Aware, Inc.
- Fingerprint Cards AB
- Cognitec Systems GmbH
- Innovatrics s.r.o.
- Touchless Biometric Systems AG
- nVIAsoft Corporation
- M2SYS Technology
- Suprema Inc.
- DERMALOG Identification Systems
Recent Developments
- In September 2025, UIDAI logged its highest-ever single day of face authentication, with over 1.5 crore transactions on September 1.
- In October 2025, the European Commission launched the Entry/Exit System across 29 European countries. It set a 6–month rollout to register fingerprints and facial images at external borders.
- In March 2026, Precise Biometrics agreed to merge with Fingerprint Cards AB in a deal that values Fingerprint Cards at about SEK 135.7 million. The companies plan a SEK 110 million rights issue after the merger.
Report Scope
| Report Features | Description |
|---|---|
| Market Value (2025) | USD 23.2 Billion |
| Forecast Revenue (2035) | USD 67.2 Billion |
| CAGR (2026-2035) | 11.2% |
| Base Year for Estimation | 2025 |
| Historic Period | 2020-2024 |
| Forecast Period | 2026-2035 |
| Report Coverage | Revenue Forecast, Market Dynamics, Competitive Landscape, Recent Developments |
| Segments Covered | By Component (Hardware, Software, Services); By Technology (Facial Recognition, Iris Recognition, Contactless Fingerprint Recognition, Palm Vein Recognition, Voice Recognition, Others); By Application (Access Control, Payments and Transactions, Border Control and Immigration, Law Enforcement, Time and Attendance, Others); By End-Use Industry (Government and Public Sector, Banking, Financial Services, and Insurance (BFSI), Consumer Electronics, Healthcare and Life Sciences, Transportation and Logistics, Defense and Security, Retail and E-commerce, Others) |
| Regional Analysis | North America: US, Canada; Europe: Germany, France, The UK, Spain, Italy, Rest of Europe; Asia Pacific: China, Japan, South Korea, India, Australia, Singapore, Rest of APAC; Latin America: Brazil, Mexico, Rest of Latin America; Middle East & Africa: GCC, South Africa, Rest of MEA |
| Competitive Landscape | Thales Group, NEC Corporation, IDEMIA, HID Global Corporation, Fujitsu Limited, Aware, Inc., Fingerprint Cards AB, Cognitec Systems GmbH, Innovatrics s.r.o., Touchless Biometric Systems AG, nVIAsoft Corporation, M2SYS Technology, Suprema Inc., DERMALOG Identification Systems |
| Customization Scope | Customization for segments and region/country-level will be provided. Moreover, additional customization can be done based on the requirements. |
| Purchase Options | We have three licenses to opt for: Single User License, Multi-User License (Up to 5 Users), Corporate Use License (Unlimited Users and Printable PDF) |