Report Overview
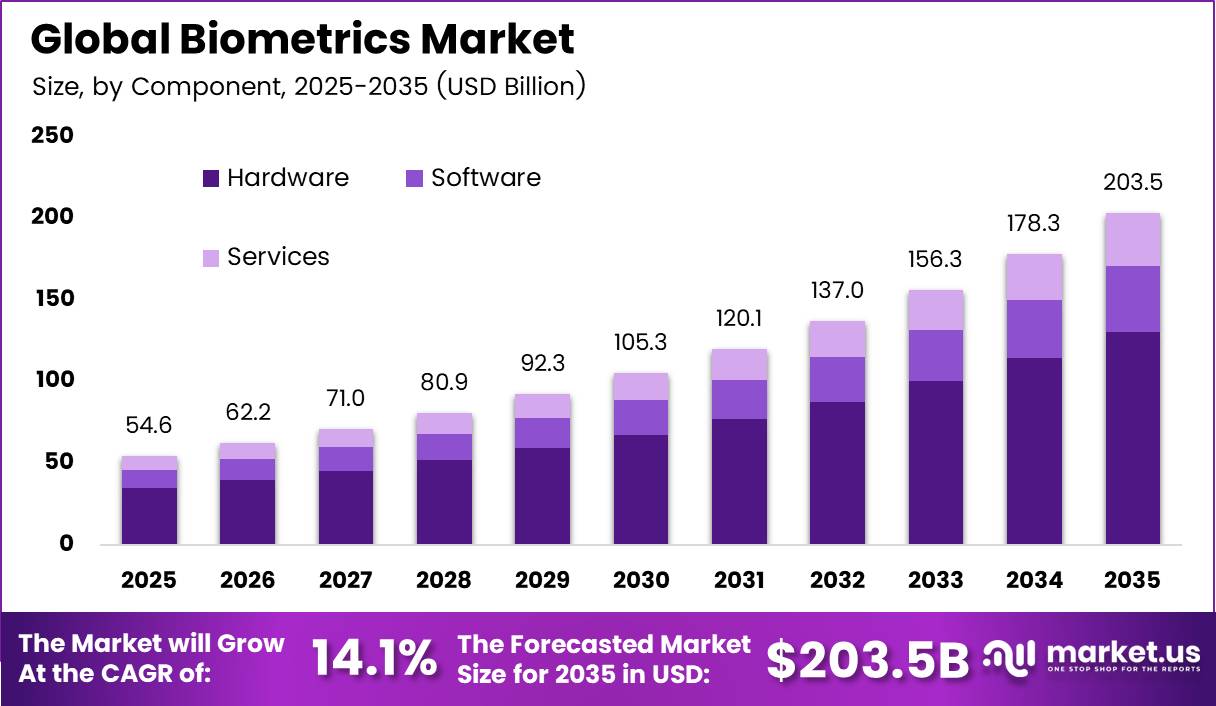
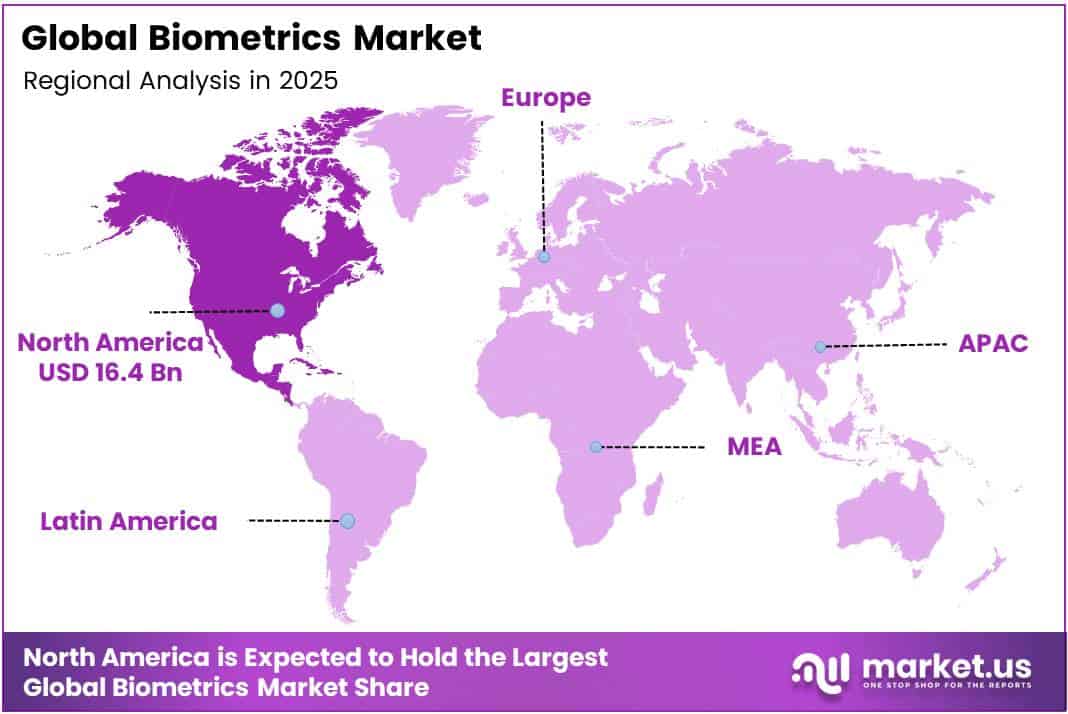
In 2025, the Global Biometric Market was valued at USD 54.6 billion. The market is projected to grow at a CAGR of 14.1% during 2026–2035, reaching approximately USD 203.5 billion by 2035. North America dominated the global market in 2025, accounting for more than 30.0% of the total market share and generating approximately USD 16.4 billion in revenue.
According to the World Bank ID4D Initiative, about 800 million people worldwide still lack official proof of identity, down from 850 million in 2021 and over 1 billion in 2017. The World Bank also reports that at least 2.8 billion people cannot access a government-recognized digital identity to transact online.
Each gap that closes creates new demand for fingerprint scanners, face capture devices, and identity software. This explains why government and defense hold the largest end-use share. Hardware leads because every national ID enrollment needs physical capture devices at registration centers.
The North America region hosts the deepest pool of enterprise technology spending on secure access and identity. Microsoft reported fiscal 2025 revenue of USD 281.7 billion, and its Microsoft Cloud revenue rose 23% to USD 168.9 billion, according to its annual report. Large cloud platforms like these push passwordless sign-in and identity checks across millions of business users.
The WTO also projects North American merchandise export growth of 5.7% in 2026. That supports steady trade in sensors and authentication devices. Strong federal border, defense, and banking budgets keep the region in first place.
Key Takeaways
- The Biometrics Market stood at USD 54.6 billion in 2025 and will reach USD 203.5 billion by 2035. The market will grow at a CAGR of 14.1% from 2026 to 2035.
- By component, hardware led with a 64.0% share; the fastest-growing component was not provided.
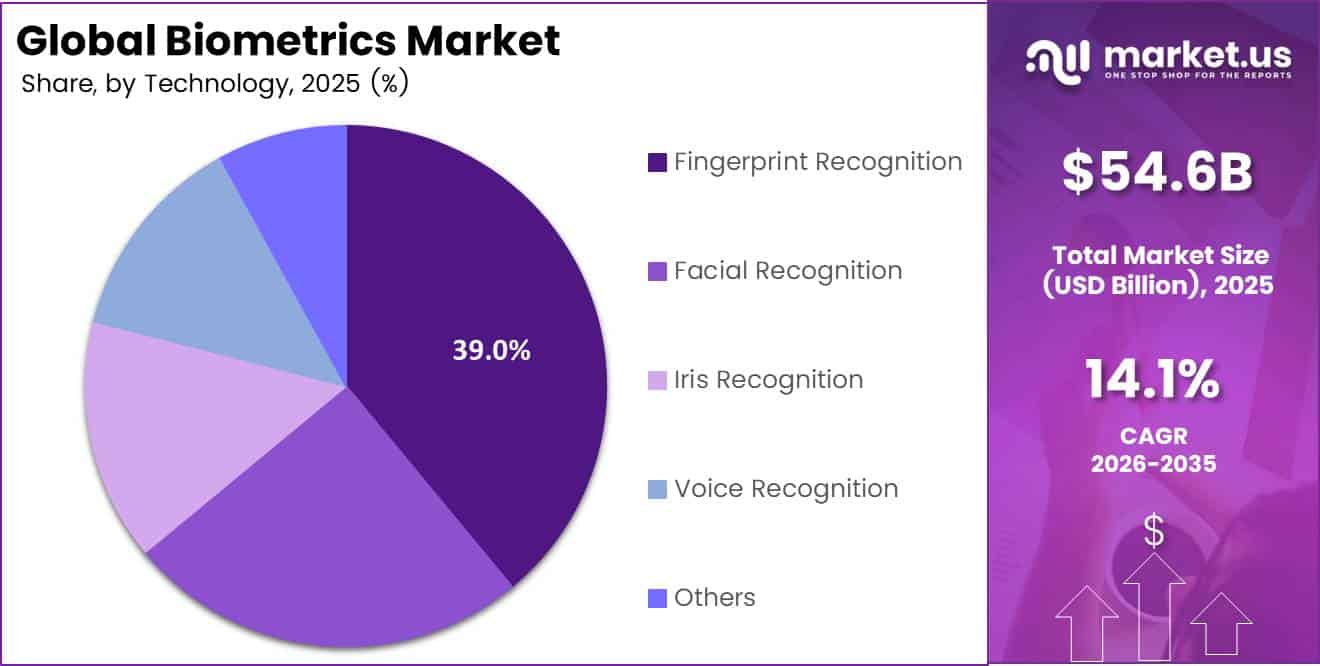
- By technology, fingerprint recognition led with a 39.0% share; the fastest-growing technology was not provided.
- By biometric type, physiological biometrics led with a 90.0% share; the fastest-growing type was not provided.
- By authentication type, single-factor authentication led with a 67.0% share; the fastest-growing type was not provided.
- By end-use industry, government and defense led with a 25.0% share; the fastest-growing industry was not provided.
- North America led with a 30.0% share and USD 16.4 billion in revenue.
By Component
Hardware dominates with 64.0% due to mass fingerprint scanner deployment nationwide.
Hardware leads because every biometric check starts with a physical sensor, scanner, or camera. India’s Aadhaar system shows the scale. Average daily authentications rose from 8 crore to 9.6 crore in FY2025, with a peak of 13.2 crore transactions in one day.
Software is the fastest-growing component, because matching accuracy now drives buying decisions more than sensor count does. NIST testing shows that deep neural networks pushed the best face algorithms down to a search failure rate of about 0.2% against a database of 26.6 million photos. Vendors now sell software upgrades and analytics licences on top of the hardware they have already installed.
By Technology
Fingerprint Recognition dominates with 39.0% due to low-cost sensors and national ID enrollment.
Fingerprint recognition holds the top spot because large public identity programs rely on it. Aadhaar crossed 150 billion cumulative authentications (15,011.82 crore) by April 2025. In that month alone, users completed almost 210 crore transactions, about 8% more than a year earlier.
Facial recognition is the fastest-growing technology because it needs no contact and works on any phone camera. UIDAI recorded 15.87 crore face authentications in June 2025, up from 4.61 crore in June 2024. Total face transactions doubled from 100 crore to 200 crore in just 6 months. Users like the speed, and operators save money because they don’t need extra devices.
By Biometric Type
Physiological biometrics dominate with 90.0% due to stable fingerprint, face, and iris traits.
Physiological methods lead because fingerprints, faces, and irises stay stable over a lifetime, which makes them easy to enroll once and reuse. Aadhaar holders completed more than 221 crore authentications in August 2025 alone, up 10.3% from August 2024. This volume rests almost entirely on body-based traits.
Mastercard’s 10-K describes identity tools that combine biometrics with behavioral user data during account opening, account access, and money transfers. Fairness concerns also push demand. NIST found that false-positive rates in face verification varied by a factor of 10 to more than 100 across demographic groups. Firms therefore add behavioral signals on top of physiological ones.
By Authentication Type
Single-Factor Authentication dominates with 67.0% due to fast one-touch checks at scale.
Single-factor biometric checks lead because one scan or glance finishes the job quickly at high volume. UIDAI face authentication reached a single-day peak of 1.1 crore during FY2025 and then 1.5 crore in September 2025. Each of these checks used one biometric trait with no extra step, which keeps queues short.
Multi-factor authentication is growing fastest, as regulators and platforms move away from passwords. The FIDO Alliance Passkey Index shows that 93% of user accounts at major services can now use passkeys. Of those, 36% have enrolled a passkey, and 26% of all sign-ins already use one. Passkey logins take 8.5 seconds and succeed 93% of the time, compared with 63% for older methods. In addition, 48% of the world’s top 100 websites now support passkeys.
By End-Use Industry
Government and Defense dominate with 25.0% due to border, airport, and ID programs.
Government and defense lead because states pay for national ID systems, border control, and airport screening. The TSA runs facial recognition at 84 U.S. airports and plans to expand it to 400 airports over the next few years. Large public tenders like these lock in multi-year spending on devices, software and support.
Banking, Financial Services and Insurance (BFSI) is the fastest-growing end user, as digital payments raise fraud risk and push banks toward password-free logins. The FIDO Alliance reports that more than 1 billion people have activated at least one passkey. Consumer awareness of passkeys rose from 39% to 57% in two years.
Key Market Segments
By Component
- Hardware
- Software
- Services
By Technology
- Fingerprint Recognition
- Facial Recognition
- Iris Recognition
- Voice Recognition
- Others
By Biometric Type
- Physiological Biometrics
- Behavioral Biometrics
By Authentication Type
- Single-Factor Authentication
- Multi-Factor Authentication
By End-Use Industry
- Government and Defense
- Banking, Financial Services, and Insurance (BFSI)
- Consumer Electronics
- Healthcare
- Retail and E-commerce
- Transportation and Logistics
- IT and Telecommunications
- Others
Geopolitical Impact Analysis
Biometric devices depend on semiconductors, image sensors, and servers. These goods now sit at the center of global trade tension. The WTO reports that trade in AI-enabling goods jumped 67% year on year in the first half of 2026. These goods also made up 47% of global merchandise trade growth in value terms.
Biometric makers now compete with AI data center builders for the same chips. Supply concentration adds risk. The WTO notes that AI-enabling goods reached 14.8% of world merchandise trade in the first half of 2026, up from 7% to 8% between 2016 and 2023. These goods come from only a few geographies.
Any export control or tariff action on chips quickly hits fingerprint module and camera module pricing. The West Asia conflict also affects logistics. The WTO warns that the conflict raises energy prices and disrupts transport routes in 2026. Longer routes between Asian factories and European buyers delay deliveries of scanners and access terminals.
Trade volumes have held up so far. The WTO raised its 2026 merchandise trade volume forecast to 3.9%, up from 1.9% in March, and expects 4.1% growth in 2027. Biometric suppliers that spread sourcing across several countries will protect their margins best.
Regional Analysis
North America dominates the Biometrics Market, holding a 30.0% share and generating USD 16.4 billion in revenue. The US drives most of this demand through border control, defense identity programs, and banking security. Federal agencies use fingerprint and face matching at airports and land crossings.
Banks deploy voice and face checks to cut account takeover fraud. Large US technology firms also shape the market. Microsoft spent USD 32.5 billion on research and development in fiscal 2025, about 12% of revenue. Much of this work supports secure sign-in and identity tools.
Asia Pacific is the fastest-growing region in the biometrics market. The WTO expects Asia to lead merchandise export growth at 9.9% in 2026, which supports the region’s role as the main sensor and device factory hub. China and South Korea build most fingerprint modules and camera parts.
Key Regions and Countries
North America
- US
- Canada
Europe
- Germany
- France
- The UK
- Spain
- Italy
- Rest of Europe
Asia Pacific
- China
- Japan
- South Korea
- India
- Australia
- Rest of APAC
Latin America
- Brazil
- Mexico
- Rest of Latin America
Middle East and Africa
- GCC
- South Africa
- Rest of MEA
Market Dynamics
Drivers
| Driver | (~) % Impact on CAGR Forecast | Geographic Relevance | Impact Timeline |
|---|---|---|---|
| National Digital ID & e-Passport Rollouts | +2.6% | Global, led by APAC, Africa, EU | Short term (2 years or less) |
| EU Entry/Exit System Border Enrollment | +1.8% | Europe (Schengen Area) | Short term (2 years or less) |
| Passkey & FIDO2 Adoption in Smartphones | +1.6% | Global | Short term (2 years or less) |
| Banking KYC & Deepfake Fraud Countermeasures | +1.4% | North America, Europe, India | Medium term (2 to 4 years) |
| Airport Biometric Boarding Expansion | +1.0% | North America, Middle East, APAC | Medium term (2 to 4 years) |
| Workforce Access & Time-Attendance Upgrades | +0.6% | APAC, Latin America | Medium term (2 to 4 years) |
National Digital ID & e-Passport Rollouts
Government digital ID programs have turned biometrics from one-time hardware sales into recurring platform contracts. It now covers more than 1.3 billion enrolled residents and handles over 2 billion authentication transactions a month, and its face authentication volumes grew several times over between 2024 and 2025.
The EU set a fixed deadline: per the European Commission’s eIDAS 2.0 regulation, member states must offer a European Digital Identity Wallet by 2026, which affects about 450 million citizens. In Africa, World Bank ID4D program data shows roughly 850 million people still lack official ID, and the gap is being closed through multilateral-funded enrollment tenders.
The commercial result is a move away from upfront perpetual-license deals. Vendors now win multi-year managed-service and per-transaction contracts of 7 to 10 years, which brings recurring software revenue up to about 40% to 50% of the mix, according to annual reports from listed identity vendors.
Restraints
| Restraint | (~) % Impact on CAGR Forecast | Geographic Relevance | Impact Timeline |
|---|---|---|---|
| EU AI Act Bans on Real-Time Remote Identification | -1.5% | Europe | Short term (2 years or less) |
| BIPA-Style Litigation & Statutory Damages | -1.0% | North America (Illinois, Texas, Washington) | Short term (2 years or less) |
| Municipal Facial Recognition Bans | -0.6% | North America, parts of Europe | Medium term (2 to 4 years) |
| Export Controls on Surveillance Technology | -0.5% | China, Middle East, Global | Medium term (2 to 4 years) |
| Public-Sector Budget Freezes in Emerging Markets | -0.4% | Africa, Latin America | Short term (2 years or less) |
EU AI Act Bans on Real-Time Remote Identification
The EU AI Act creates a legal hard stop for an entire product category. Per the Official Journal of the European Union, its Article 5 bans took effect. They prohibit untargeted scraping of facial images, emotion recognition in workplaces and schools, and real-time remote biometric identification in public spaces, apart from narrow law-enforcement exceptions.
Penalties reach €35 million or 7% of global annual turnover, whichever is higher, according to the European Commission. Remote biometric systems that remain permitted are classified as high-risk under Annex III. They need conformity assessments that add about 6 to 12 months to procurement cycles, based on guidance from European Data Protection Board members.
Vendors’ European earnings filings show the result: some city-surveillance and retail-analytics pipelines have been cancelled outright, and certification costs are estimated at 3% to 5% of contract value. That squeezes gross margin on public-security deals in Europe by about 200 to 400 basis points and is pushing capital spending toward compliant 1:1 verification products.
Challenges
| Challenge | (~) % CAGR Friction Drag | Geographic Relevance | Mitigation Horizon |
|---|---|---|---|
| Generative AI Presentation Attacks | -1.2% | Global | Medium term (2 to 4 years) |
| Demographic Algorithmic Bias | -0.6% | North America, Europe | Medium term (2 to 4 years) |
| Sensor Semiconductor Supply Concentration | -0.5% | APAC, Global | Long term (4 years or more) |
| Interoperability Standards Fragmentation | -0.4% | Global | Long term (4 years or more) |
| Biometric Template Breach Risk | -0.3% | Global | Medium term (2 to 4 years) |
Generative AI Presentation Attacks
Biometric systems depend on the assumption that a face or voice cannot be easily copied, and generative AI is breaking that assumption. Per the US Department of Homeland Security, deepfake injection attacks on remote identity verification grew more than 700% during 2024.
The Hong Kong Police Force reported that a single synthetic video-conference fraud cost an engineering firm about US$25 million. NIST’s Face Analysis Technology Evaluation finds that many commercial liveness-detection products still show attack-acceptance error rates above 1% against high-quality injection attacks.
This does not stop sales. It does force vendors into constant model retraining, which earnings calls from listed vendors put at about 15% to 20% of R&D budgets, and into paid third-party certification renewed every 12 to 18 months. Over time, companies will need to shift toward multimodal and device-bound verification and acquire anti-spoofing specialists.
Opportunities
| Opportunity | (~) % Potential CAGR Upside | Geographic Relevance | Execution Window |
|---|---|---|---|
| Biometric Payment Cards & Palm-Pay Retail | +1.7% | North America, Europe, APAC | Medium term (2 to 4 years) |
| Reusable Verified-Identity Wallet Monetization | +1.3% | Europe, India, Global | Medium term (2 to 4 years) |
| Healthcare Patient Identity Matching | +0.9% | North America, Middle East | Long term (4 years or more) |
| In-Vehicle Driver Biometrics | +0.7% | Europe, China, North America | Long term (4 years or more) |
| Mid-Market Vendor Roll-Up Consolidation | +0.5% | Global | Short term (2 years or less) |
Biometric Payment Cards & Palm-Pay Retail
Biometric payment at the point of sale is still largely unused because it is stuck in pilots. EMVCo certified fingerprint sensor-on-card specifications years ago, but issuers have shipped only a small number of biometric cards compared with the more than 13 billion EMV chip cards in circulation that EMVCo reports.
Palm-pay networks such as Amazon One, disclosed in Amazon’s annual reports, are still limited to hundreds of locations rather than broad retail coverage. Economics, not demand, has held them back. Sensor-card bills of materials of about US$8 to US$12 per card, against roughly US$1 for a standard chip card, have kept issuers from adopting them.
A vendor that can cut sensor costs by about 40% to 50% by moving to thin-film fingerprint sensors could also create new revenue streams: per-transaction authentication fees of 1 to 3 basis points, plus lower fraud chargebacks. That combination could lift software-attached gross margins by an estimated 8 to 12 percentage points compared with selling commodity readers.
Key Players Analysis
Tier 1 leaders hold the largest global footprint. Microsoft posted fiscal 2025 revenue of USD 281.7 billion, up 15% from USD 245.1 billion. Its research and development spending rose 10% to USD 32.5 billion, and its 10-K filing shows a further rise to USD 35.6 billion in fiscal 2026.
IBM earned USD 67.5 billion in 2025 revenue. Software revenue grew 10.6% to USD 30.0 billion. IBM also built a generative AI book of business worth more than USD 12.5 billion. It closed its USD 11 billion purchase of Confluent in March 2026 to strengthen its governed data platform.
Tier 2 challengers compete in niche areas. Arize AI raised USD 70 million in a Series C round, with backing from Microsoft’s M12 fund. SAS Institute, OneTrust and DataRobot hold strong positions in analytics, privacy and model management.
Smaller firms such as Credo AI, Holistic AI, Fiddler AI, Arthur AI, ModelOp, Monitaur, Fairly AI, WhyLabs and LatticeFlow AI focus on AI risk and compliance tools.
Top Key Players in the Market
- IBM Corporation
- Microsoft Corporation
- Credo AI, Inc.
- Holistic AI Ltd.
- DataRobot, Inc.
- Fiddler AI, Inc.
- Arthur AI, Inc.
- ModelOp, Inc.
- OneTrust LLC
- SAS Institute Inc.
- Monitaur, Inc.
- Fairly AI, Inc.
- Arize AI, Inc.
- WhyLabs, Inc.
- LatticeFlow AI AG
Recent Developments
- In February 2025, Arize AI, Inc. raised a USD 70 million Series C round led by Adams Street Partners to scale AI evaluation and monitoring.
- In July 2025, Microsoft Corporation reported fiscal 2025 results with Microsoft Cloud revenue of USD 168.9 billion, up 23%.
- In December 2025, IBM Corporation signed a definitive agreement to acquire Confluent, Inc. for USD 31 per share in cash, an enterprise value of USD 11 billion.
- In February 2026, Confluent, Inc. shareholders approved the USD 11 billion merger with IBM at a special meeting.
Report Scope
| Report Features | Description |
|---|---|
| Market Value (2025) | USD 54.6 Billion |
| Forecast Revenue (2035) | USD 203.5 Billion |
| CAGR (2026-2035) | 14.1% |
| Base Year for Estimation | 2025 |
| Historic Period | 2020-2024 |
| Forecast Period | 2026-2035 |
| Report Coverage | Revenue Forecast, Market Dynamics, Competitive Landscape, Recent Developments |
| Segments Covered | By Component (Hardware, Software, Services); By Technology (Fingerprint Recognition, Facial Recognition, Iris Recognition, Voice Recognition, Others); By Biometric Type (Physiological Biometrics, Behavioral Biometrics); By Authentication Type (Single-Factor Authentication, Multi-Factor Authentication); By End-Use Industry (Government and Defense, Banking, Financial Services, and Insurance (BFSI), Consumer Electronics, Healthcare, Retail and E-commerce, Transportation and Logistics, IT and Telecommunications, Others) |
| Regional Analysis | North America – US, Canada; Europe – Germany, France, The UK, Spain, Italy, Rest of Europe; Asia Pacific – China, Japan, South Korea, India, Australia, Singapore, Rest of APAC; Latin America – Brazil, Mexico, Rest of Latin America; Middle East & Africa – GCC, South Africa, Rest of MEA |
| Competitive Landscape | IBM Corporation, Microsoft Corporation, Credo AI, Inc., Holistic AI Ltd., DataRobot, Inc., Fiddler AI, Inc., Arthur AI, Inc., ModelOp, Inc., OneTrust LLC, SAS Institute Inc., Monitaur, Inc., Fairly AI, Inc., Arize AI, Inc., WhyLabs, Inc., LatticeFlow AI AG |
| Customization Scope | Customization for segments and region/country-level will be provided. Moreover, additional customization can be done based on the requirements. |
| Purchase Options | We have three licenses to opt for: Single User License, Multi-User License (Up to 5 Users), Corporate Use License (Unlimited Users and Printable PDF) |