


Report Overview
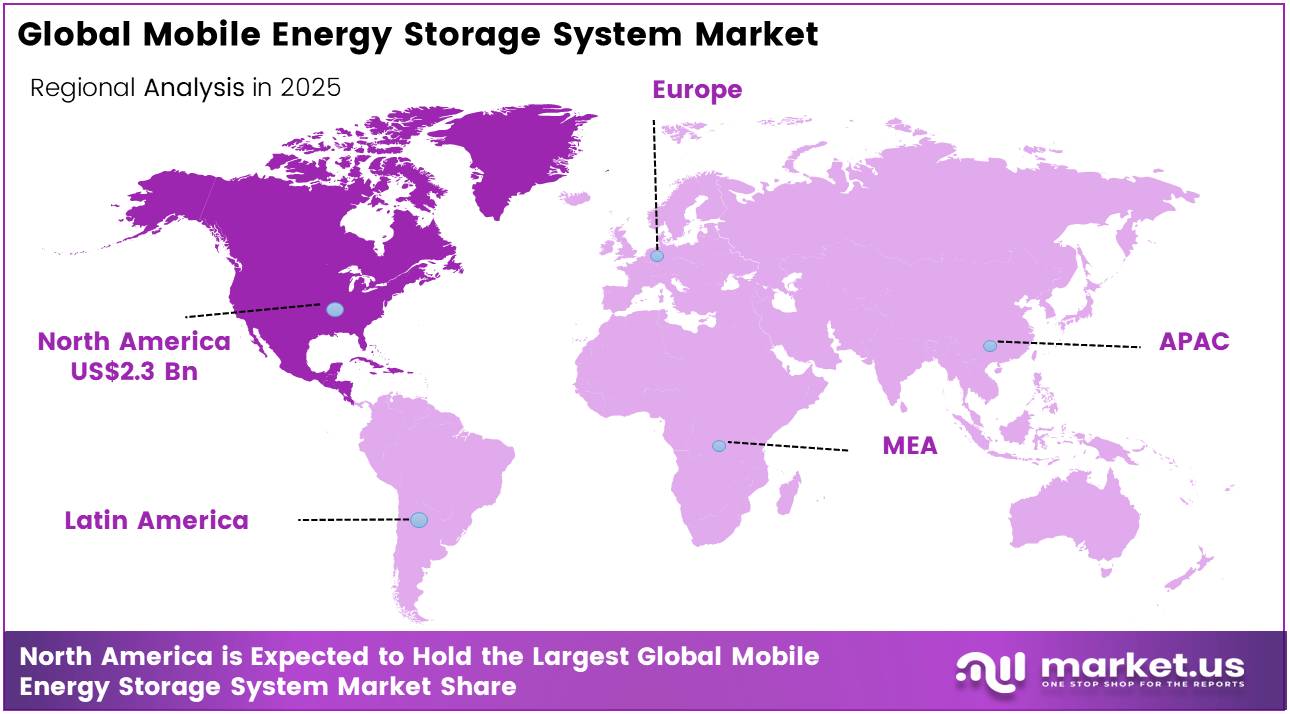
In 2025, the Global Mobile Energy Storage System Market was valued at USD 7.6 billion, and between 2026 and 2035, this market is projected to grow at a CAGR of 11.7%, reaching about USD 22.8 billion by 2035. In 2025, North America held a dominant market position, capturing more than a 30.1% share, holding USD 2.3 Billion revenue.
The mobile energy storage system industry covers transportable battery units mounted on trailers, skids, containers, or vehicles and deployed where electricity is temporarily constrained, interrupted, or expensive. These systems serve construction sites, utilities, events, remote communities, electric-vehicle charging hubs, military facilities, and disaster-response operations. Their commercial value comes from combining battery storage, power conversion, thermal management, software controls, and fast connection equipment in one movable platform.
- In May 2026, according to the International Energy Agency, 108 GW of battery storage capacity was added worldwide during 2025, representing 40% growth from 2024, while installed capacity reached eleven times its 2021 level. Around 80% of 2025 additions were utility-scale, and lithium iron phosphate batteries represented nearly 90% of deployments because of their lower cost and suitability for frequent cycling.
- Government programmes are also reducing technology and deployment risks. In June 2025, the U.S. Department of Energy awarded up to USD 15 million across three storage demonstrations, including USD 5 million for each selected project, to strengthen critical facilities during outages and emergencies. In March 2025, the European Commission’s Joint Research Centre launched the European Energy Storage Inventory, providing near-real-time information on storage power, project status and technology deployment.
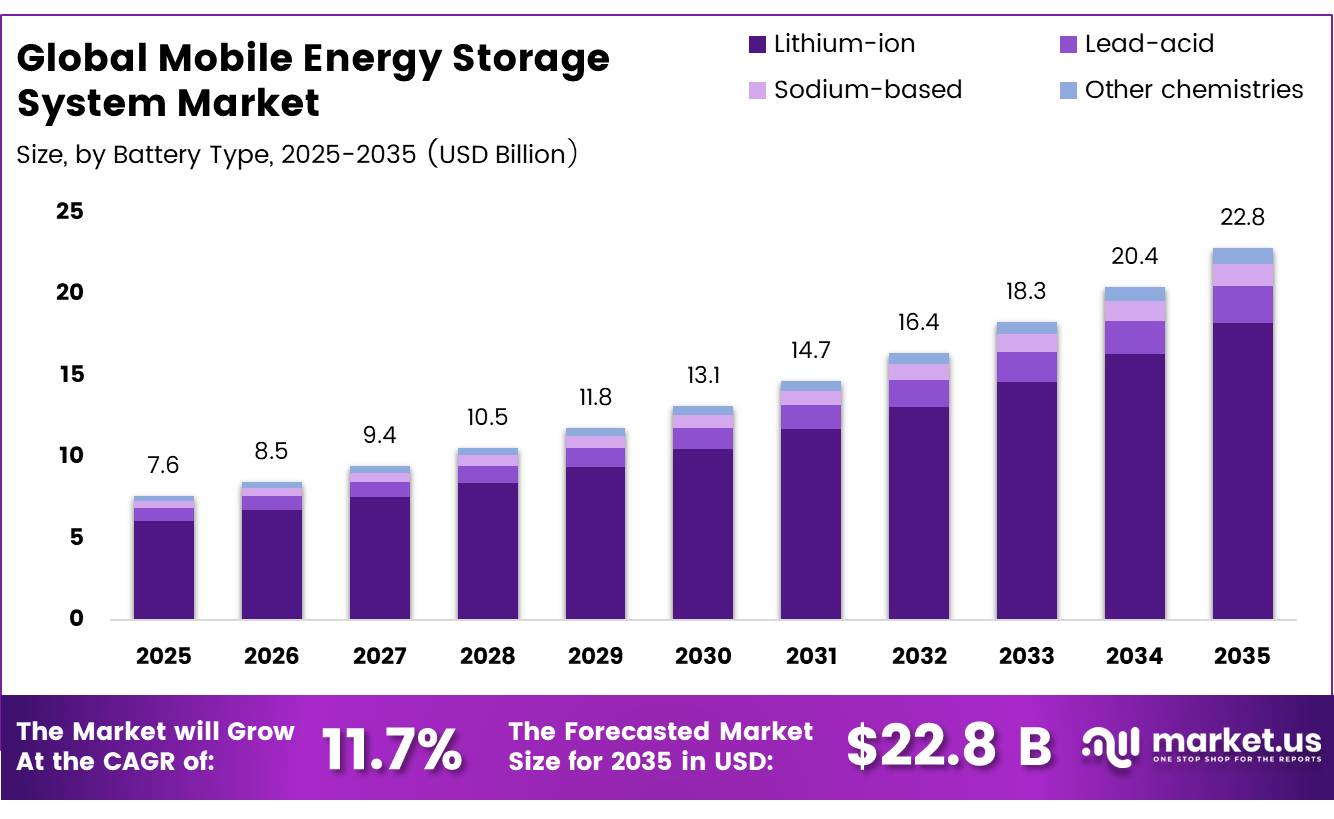
The global Mobile Energy Storage System (MESS) market was valued at US$7.6 billion in 2025 and is expected to reach approximately US$22.8 billion by 2035, growing at a CAGR of 11.7% from 2026 to 2035. This expansion is supported by rapid transport electrification, rising renewable-energy installations, and stronger demand for flexible power solutions.
Electric vehicles remain a major growth driver. Global electric car sales increased by 25% in 2024, reaching 17 million units, while annual battery demand exceeded 1 TWh for the first time. Renewable-energy capacity also grew by a record 15.1% in 2024, reaching 4,448 GW, with solar and wind contributing nearly 66%. To manage intermittent renewable generation, global storage capacity is expected to increase from 416 GW in 2025 to 2,530 GW by 2035. The COP29 pledge also targets 1,500 GW by 2030, around 6 times the 2022 level.
North America held a 30.1% share, worth US$2.3 billion in 2025. The U.S. Inflation Reduction Act offers a standalone 30% Investment Tax Credit for energy storage. U.S. utility-scale battery capacity exceeded 26 GW in 2024, rising 66% year over year, with 10.4 GW added during the year. Capacity may approach 65 GW by the end of 2026, compared with 17 GW in Q1 2024. Global battery manufacturing capacity reached 3 TWh in 2024 and could triple within 5 years, improving affordability across construction, EV charging, emergency power, and off-grid industries
Key Takeaways
- The global Mobile Energy Storage System Market was valued at USD 7.6 billion in 2025.
- The global Market is projected to grow at a CAGR of 11.7% and is estimated to reach USD 22.8 billion by 2035.
- On the basis of battery type, the lithium-ion (Li-ion) dominated the market, constituting 79.9% of the total market share.
- Based on the power capacity, the 100–500 kW / 3,000–10,000 kWh dominated the Mobile Energy Storage System Market, with a substantial market share of around 55.4%.
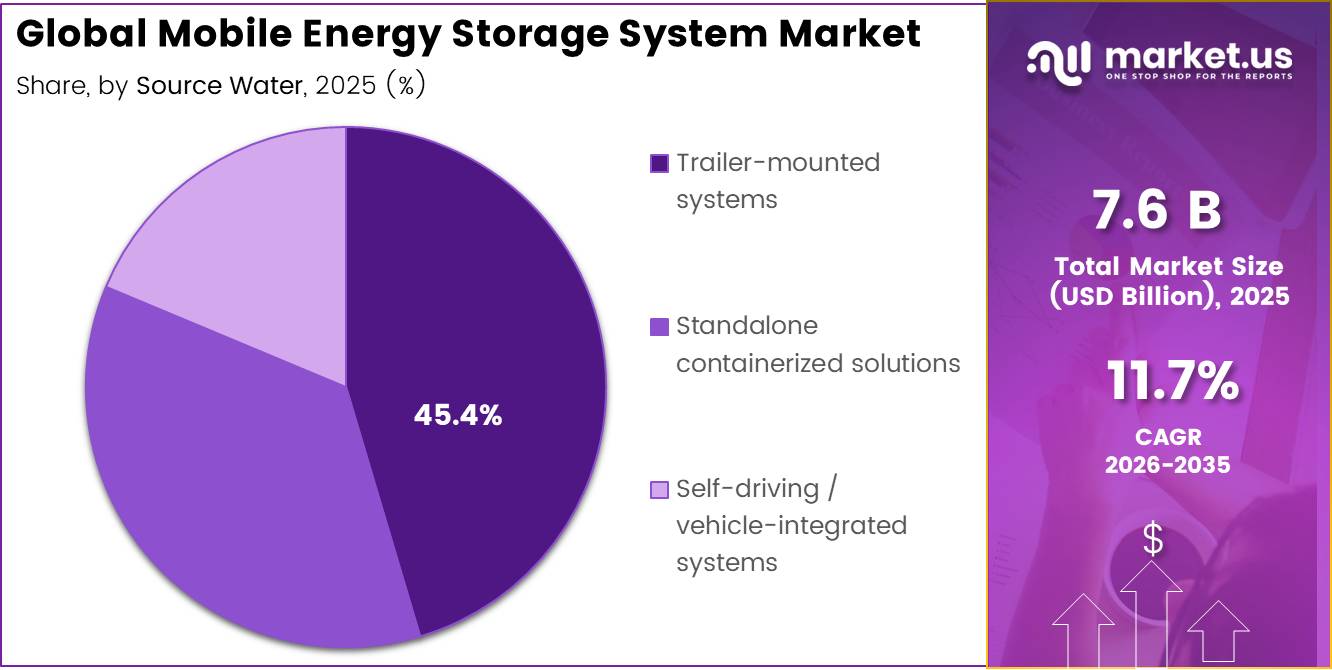
- Based on the Source Water, Trailer‑mounted systems led the market, comprising 45.6% of the total market.
- Among the Application, C&I peak‑shaving / temporary power held a major share in the Mobile Energy Storage System Market, 30.3% of the market share.
- In 2025, the North America was the most dominant region in the Mobile Energy Storage System Market, accounting for 30.1% of the total global consumption.
Battery Type Analysis
Lithium-Ion Mobile Energy Storage System represents dominant Segment in the Market.
Lithium-ion batteries hold the leading position 79.9% Share. The global Mobile Energy Storage System (MESS) market due to their strong performance, lower costs, and wide use in electric mobility. According to the IEA, the energy sector represents more than 90% of annual lithium-ion battery demand, compared with only 50% in 2016. Lithium-ion batteries provide an energy density of around 150–250 Wh/kg, far above the less than 40 Wh/kg offered by lead-acid batteries.
This makes them better suited for electric vehicles, portable industrial equipment, mobile charging units, and field-based power systems. Global battery demand exceeded 1 TWh in 2024, while EV battery demand reached more than 950 GWh, rising 25% year over year. In 2025, global lithium-ion battery deployment was 6 times higher than in 2020, with electric vehicles accounting for over 70% of deployments. Battery pack prices also fell below USD 100/kWh in 2024 after declining nearly 90% since 2010.
Lead-acid batteries maintain a smaller but stable position, particularly in UPS, telecom backup, and industrial standby systems. Their main advantage is a mature recycling network and low initial cost. The U.S. EPA reports a 99.3% recycling rate, while U.S. Department of Energy data places the rate above 99%. New lead-acid batteries can contain around 80% recycled material. These benefits support their approximately 10% MESS market share, although lower energy density limits their growth in mobile applications.
Power Capacity Analysis
100–500 kW / 3,000–10,000 kWh is a significant type.
In 2025, the 100–500 kW / 3,000–10,000 kWh capacity segment held a dominant position in the global Mobile Energy Storage System (MESS) market, accounting for approximately 45.1% of total revenue. Its leadership is supported by strong demand from commercial and industrial users, including manufacturing plants, logistics centres, data centres, EV charging sites, and large commercial buildings. Global battery storage additions reached 108 GW in 2025, rising 40% year over year and nearly 11 times compared with 2021.
The share of battery projects used for energy shifting also increased from around 40% in 2015 to more than 90% in 2025, showing the growing economic value of storing low-cost electricity and using it during expensive peak hours. Global electricity demand is expected to exceed 29,000 TWh by 2026, supported by industrial electrification, data-centre growth, and expanding EV charging infrastructure. The COP29 pledge targets 1,500 GW of global energy storage capacity by 2030, while the longer-term requirement could rise from 416 GW in 2025 to 2,530 GW by 2035. Battery costs have also fallen by 93% since 2010, reaching about USD 192 per kWh in 2024, improving the affordability of mid-capacity systems.
The below-100 kW / under-3,000 kWh remained the fastest-growing category by deployment volume. Demand is rising across SMEs, telecom towers, construction sites, remote communities, humanitarian operations, and smaller backup-power applications. Australia’s behind-the-meter battery additions increased from nearly 0.2 GW in 2024 to approximately 3.4 GW in 2025, while the United States added close to 3 GW. Battery-based UPS capacity also grew by 30% to reach 45 GW in 2025, further supporting smaller and modular mobile storage systems
Source Water Analysis
Trailer‑mounted systems are the Most Widely Used Source.
Trailer-mounted systems led the global Mobile Energy Storage System (MESS) market with an estimated 45.4% share, supported by easy transport, fast installation, and broad use across construction, utilities, defense, and emergency services. Global battery energy storage deployments reached a record 108 GW in 2025, rising 40% year over year, while cumulative capacity increased to more than 11 times its 2021 level. This rapid expansion is increasing demand for mobile power units that can be moved between locations without permanent civil infrastructure.
The global construction industry, a major user of trailer-mounted systems, is expected to grow from US$11.39 trillion in 2024 to US$16.11 trillion by 2030, creating strong demand for temporary and remote-site electricity. Disaster-response requirements also support the segment, as direct global disaster losses are estimated at nearly US$202 billion annually. In the United States, 10.4 GW of battery storage capacity was added in 2024, taking cumulative utility-scale capacity above 26 GW.
Self-driving and integrated systems is the fastest growing segment of the market. U.S. utility-scale storage capacity is projected to approach 65 GW by the end of 2026, encouraging greater use of autonomous and grid-connected mobile systems. AI-based energy arbitrage represented more than 90% of BESS project applications in 2025, further supporting automated solutions
Application Analysis
C&I peak‑shaving / temporary power Held a Major Share of the Mobile Energy Storage System Market.
C&I peak shaving and temporary power represents the leading application segment 30.3% of the market share. The Mobile Energy Storage System Market. Growth is supported by rising electricity demand, grid congestion, higher commercial tariffs, and the need for flexible power at industrial and commercial sites.
Global electricity demand increased by 4.3% in 2024 and is expected to grow by nearly 4% annually through 2027. Much of this growth comes from warehouses, manufacturing plants, data centers, and logistics hubs. These facilities face high demand charges, which are commonly calculated using the highest 15-minute or 30-minute electricity-use interval recorded each month.
Mobile battery energy storage systems help reduce these costs by discharging power during peak-use periods. This lowers grid consumption at the billing peak without requiring permanent energy infrastructure. Global battery storage additions reached a record 108 GW in 2025, rising 40% year over year. In addition, 97.5% of commercial facilities experienced electricity-rate increases between 2020 and 2025, with a median annual growth rate of 5.9%, compared with the 3% increase commonly assumed in corporate energy budgets. For a typical 1 MW commercial load, annual capacity-related charges could rise from about US$10,000 in 2024 to more than US$120,000 by 2027.
Mobile systems also support temporary EV fast charging. Global EV sales reached 17 million units in 2024 and 21.6 million units in 2025, representing around 1 in 4 new cars. Mobile storage enables high-power charging at industrial parks, events, and logistics depots without costly grid upgrades.
Key Market Segments
By Battery Type
- Lithium-Ion (Li-Ion)
- Lead Acid
- Sodium‑based
- Others Chemistries
By Power Capacity
- 100–500 kW / 3,000–10,000 kWh
- Less than 100 kW / <3,000 kWh
- Above 500 kW / >10,000 kWh
By Source Water
- Trailer‑mounted systems
- Standalone containerized solutions
- Self‑driving / vehicle‑integrated systems
By Application
- Construction sites and mining
- C&I peak‑shaving / temporary power
- On‑demand EV fast charging
- Events, disaster relief, remote/off‑grid
- Data centers and critical infrastructure
Driver Analysis
Battery Cost Deflation Unlocking Mass-Market MESS Economics
According to BNEF data released in December 2025, the global average lithium-ion pack price reached a record low of USD 108/kWh down 8% from USD 115/kWh in 2024 and more than 93% below 2010 levels while stationary storage segment prices hit USD 70/kWh in 2025, representing a 45% decline from the prior year and marking the first time stationary storage became the lowest-priced segment across all application categories.
LFP chemistries now average USD 81/kWh across segments, compared to USD 128/kWh for NMC packs, a divergence that is systematically steering mobile ESS system integrators toward LFP for weight-tolerant utility-scale deployable units, compressing the bill of materials (BoM) threshold substantially. This cost inflection directly alters the business model for mobile ESS operators: projects that previously required a 10–12 year payback window at legacy pricing can now clear hurdle rates inside 6–8 years in grid-services applications, enabling a broader set of developers, utilities, and independent power producers to deploy containerized or trailer-mounted systems without multilateral grant financing.
Academically, lithium-ion battery costs are projected to decline a further 43–52% by 2030, with every doubling of cumulative global production historically delivering approximately a 19% price reduction—a Wright’s Law curve that continues to push levelized cost of storage targets toward INR 5.50–6.60/kWh in India and equivalent competitiveness thresholds in North America and the EU.
Drivers Impact Analysis
| Driver | (~) % Impact on CAGR | Geographic Relevance | Impact Timeline |
|---|---|---|---|
| Battery cost deflation unlocking mass-market MESS economics | +2.4% | North America, EU, APAC corridors, India | Short term (≤ 2 years) |
| Renewable energy integration demand for mobile grid support | +2.2% | EU, India, China, South America spill-over | Medium term (2-4 years) |
| Government policy and fiscal incentives for ESS deployment | +2.0% | U.S. (IRA), India (VGF/PLI), EU (RED III) | Medium term (2-4 years) |
| Grid resilience mandates driven by extreme weather events | +1.8% | North America core, EU, APAC exposed corridors | Short term (≤ 2 years) |
| AI data center and digital infrastructure backup power demand | +1.9% | North America core, EU, APAC hyperscale hubs | Short term (≤ 2 years) |
| Remote, off-grid, and emergency deployment use cases | +1.5% | Defense corridors, APAC islands, Africa, LatAm | Long term (≥ 4 years) |
Restraint Analysis
Tightening battery regulatory compliance and EPR rules
The EU Battery Regulation (EU) 2023/1542 moved from roadmap to enforcement phase in February 2026, immediately applying carbon‑footprint declaration requirements to all rechargeable industrial batteries above 2 kWh and obliging producers to maintain verified life‑cycle data at the model and plant level, an obligation that mobile ESS integrators must now incorporate into both design and supply‑chain contracts.
By 2026, the regulation mandates at least a 45% collection rate for portable batteries, rising sharply toward a 73% target by 2030, while from late 2027 onward, recovery metrics shift from total weight to material recovery efficiency with 90% recovery mandates for cobalt, copper, lead and nickel, and codified minimum recycled content thresholds by 2031, all of which drive up compliance costs and penalize operators without robust end‑of‑life strategies.
The regulation also requires a digital battery passport for all EV and industrial batteries above 2 kWh by February 2027, including real‑time state‑of‑health and remaining‑lifetime data fed directly from BMS to reporting platforms, a requirement that forces MESS manufacturers and operators to invest in advanced digital architectures, cybersecurity, and data‑management systems or risk losing access to the EU market.
Restraint Impact Analysis
| Restraint | (~) % Impact on CAGR | Geographic Relevance | Impact Timeline |
|---|---|---|---|
| Concentrated Li-ion raw material and cell supply | -2.1% | APAC–EU–US trade corridors | Long term (≥ 4 years) |
| CAPEX intensity and financing risk for mobile fleets | -1.9% | North America core, EU, India | Medium term (2-4 years) |
| Tightening battery regulatory compliance and EPR rules | -1.8% | EU regulatory hubs, U.S., U.K. | Medium term (2-4 years) |
| Grid interconnection, permitting and siting constraints | -1.7% | North America, EU, India | Medium term (2-4 years) |
| Domestic content, FEOC and trade-policy constraints | -1.6% | U.S., EU, India localization zones | Long term (≥ 4 years) |
| End-of-life, recycling and second-life uncertainty | -1.5% | EU, North America, China | Long term (≥ 4 years) |
Opportunity Analysis
Second-life packs and circular MESS fleets
Companies like Redwood Materials are beginning to divert a subset of incoming EV batteries into stationary grid storage rather than direct recycling, and similar logic applies to mobile ESS: packs retired from high-demand EV or first-life stationary duty with 70–80% state-of-health still have substantial residual capacity, particularly suitable for low-C-rate, lower power-density mobile applications such as microgrids, festival power, or backup for social infrastructure.
By 2030, tens of GWh of EV batteries per year are expected to reach end-of-first-life globally, and even if only 20–30% of this volume is technically and economically reusable in second-life form, the accessible pool for circular MESS fleets could exceed the cumulative mobile ESS capacity deployed to date, dramatically altering cost structures for operators able to design standardized second-life modules and controls.
Opportunity Impact Analysis
| Opportunity | (~) % Potential CAGR | Geographic Relevance | Execution Window |
|---|---|---|---|
| Mobile grid-flexibility platforms and congestion arbitrage | +2.3% | North America core, EU, China | Medium term (2-4 years) |
| Hybrid diesel displacement and construction-site electrification | +2.0% | EU, North America, India, ASEAN | Short term (≤ 2 years) |
| Data center, AI campus and telecom tower power-as-a-service | +2.1% | North America, EU, APAC hyperscale hubs | Medium term (2-4 years) |
| Second-life packs and circular MESS fleets | +1.8% | EU, U.S., China, India | Long term (≥ 4 years) |
| Non-Li chemistries and multi-day mobile systems | +1.7% | EU innovation hubs, U.S., India pilot corridors | Long term (≥ 4 years) |
| M&A roll-ups and MESS operator platforms | +1.6% | North America core, EU, India | Medium term (2-4 years) |
Challenges Analysis
Operational dispatch and traffic logistics complexity
Operational dispatch and traffic logistics complexity are distinctive, ongoing challenges for mobile ESS because value creation hinges on synchronizing two volatile systems—power markets and physical transport networks—under uncertainty, which raises operating costs and planning buffer requirements but does not fundamentally preclude profitable fleet operation.
In dense corridors in Europe, China and parts of the U.S., road congestion can add 30–90 minutes to planned relocation journeys, which at typical 1–4 hour storage durations and narrow high‑price windows can easily erase the benefit of moving assets between two otherwise attractive nodes if dispatch models are not granular enough.
On the ground, this complexity translates into the need for 24/7 fleet coordination, continuous ETA and state‑of‑charge tracking, and robust HSE protocols for moving multi‑MWh systems on public roads and into constrained sites, which lifts fixed OPEX in the form of logistics staff, IT systems and driver or operator headcount compared to stationary fleets where human resource needs scale more slowly with MWh.
Over time, standardized container formats, dedicated parking and interconnection bays at substations, and more sophisticated routing and dispatch software will moderate these costs, but until such infrastructure and digital tooling are widespread, logistics and operational friction continue to shave close to 1 percentage point from the market’s maximum growth trajectory by lengthening effective repositioning cycles and raising non‑battery OPEX without stopping deployments altogether.
Challenges Impact Analysis
| Challenge | (~) % CAGR Friction | Geographic Relevance | Mitigation Horizon |
|---|---|---|---|
| Volatile Li-ion battery supply chain | -1.3% | APAC–EU–US logistics corridors | Long term (≥ 4 years) |
| Price spread erosion and market design risk | -1.1% | North America core, EU power markets | Medium term (2-4 years) |
| Operational dispatch and traffic logistics complexity | -1.0% | Dense EU, U.S., China grids | Medium term (2-4 years) |
| Sustainability compliance and ESG scrutiny | -1.0% | EU regulatory hubs, U.S., OECD | Long term (≥ 4 years) |
| Talent gaps in advanced storage, trading and analytics | -0.9% | North America, EU, India, China | Long term (≥ 4 years) |
| Cybersecurity and digital control-stack vulnerabilities | -0.8% | Global grid-connected fleets | Medium term (2-4 years) |
Geopolitical Impact Analysis
Geopolitical Realignment and Supply Chain Fragmentation Reshaping Mobile Energy Storage System Manufacturing.
The U.S.–China trade conflict is becoming a major cost pressure for the global Mobile Energy Storage System (MESS) market because China controls most of the battery supply chain. In 2024, China produced nearly 80% of global batteries and held 60%–100% of capacity across key lithium-ion battery manufacturing stages.
In February 2026, the U.S. imposed combined tariffs of about 220% on Chinese active anode material, including 25% Section 301 tariffs, 25% Section 232 tariffs, countervailing duties of up to 66.86%, and anti-dumping duties of up to 102.72%. Tariffs on Chinese lithium-ion batteries also increased from 7.5% to 25% in January 2026, while total duties exceeded 57% in some cases. As a result, the estimated import cost of Chinese anode material increased from about US$3,700 per tonne to US$9,300 per tonne, raising costs for LFP cells, graphite anodes, cathodes, and mobile battery systems.
Shipping disruptions are adding further pressure. Suez Canal traffic fell by 42%, while weekly container capacity declined by 67%, forcing vessels to travel around the Cape of Good Hope. This route adds 10–14 days to Asia–Europe shipments and can increase fuel use by 30%–70%. Cobalt supply is also exposed, as the Democratic Republic of Congo, which produces over 70% of global cobalt, introduced export quotas in October 2025. Although lithium prices fell by more than 80% from their 2021–2022 peaks and graphite, cobalt, and nickel prices declined by 10%–20% in 2024, trade restrictions and supply disruptions could quickly reverse these declines and reduce MESS manufacturers’ margins.
Regional Analysis
North America Held the Largest Share of the Global Mobile Energy Storage System Market.
North America occupies first place in the global mobile energy storage system market with a 30.1% share owing to the large expansion of utility storage, federal policies, and the increasing need for energy integration from renewables. According to the US Energy Information Administration, the total cumulative utility battery storage capacity installed in the country amounted to more than 26 GW in 2024, with 10.4 GW of generating capacity added in the same year, making batteries only after solar for the largest generator capacity additions. Additionally, the EIA highlighted that there were 18.2 GW of additions expected in 2025, which would establish a new record in the US for the largest mobile energy storage deployment.
The Middle East and Africa is a fast-growing region. The IEA stated that the number of battery additions in the Middle East was more than 3 GW in 2025 – nearly triple the number in 2024. The primary growth driver was Saudi Arabia, according to the Renewables 2025 report published by the IEA, which revealed that the renewable forecast for the region had the biggest upgrades in the world with an estimated 25%.
Key Regions and Countries Covered
- North America
- The US
- Canada
- Europe
- Germany
- France
- The UK
- Spain
- Italy
- Russia & CIS
- Rest of Europe
- APAC
- China
- Japan
- South Korea
- India
- ASEAN
- Rest of APAC
- Latin America
- Brazil
- Mexico
- Rest of Latin America
- Middle East & Africa
- GCC
- South Africa
- Rest of MEA
Key Players Analysis
Mobile Energy Storage System manufacturers focus on strengthening technological differentiation, production scale efficiency, and supply chain integration to maintain competitiveness. A key priority is continuous material innovation, including the development of ceramic-coated, ultra-thin, and high-porosity membranes that improve thermal stability, safety, and energy density for advanced lithium-ion batteries. Companies further invest heavily in wet-process manufacturing expansion, as it delivers more uniform pore structures and supports high-performance electric vehicle applications.
Vertical integration with polymer suppliers and battery cell manufacturers helps secure raw material stability and improve cost control amid volatile input prices. Strategic capacity expansion, particularly in the Asia Pacific, enables alignment with concentrated demand from electric vehicle and energy storage ecosystems. Additionally, manufacturers emphasize intellectual property protection, process automation, and quality standardization to ensure consistency at scale, while forming long-term supply agreements with major battery producers to reinforce customer lock-in and strengthen positioning in high-value application segments.
The Major Players In The Industry
- Tesla, Inc.
- BYD Company Ltd.
- LG Energy Solution Ltd.
- Samsung SDI Co., Ltd.
- Panasonic Corporation
- CALB (China Aviation Lithium Battery)
- GE Renewable Energy / GE Energy Storage
- Fluence Energy, Inc.
- Siemens Energy
- ABB Ltd.
- Power Edison
- Greener Engineering Inc.
- Aggreko plc
- NEC Energy Solutions / NEC Corporation
- Renewable Energy Systems Ltd. (RES)
- Others
Key Development
- In September 2025, BYD Company Ltd. revealed the Haohan battery storage system at the International Digital Energy Expo in Shenzhen. The battery had a 14.5 MWh capacity and was manufactured using its own 2,710 Ah Blade Battery, which is more than thrice the industry standard aimed at mobile energy storage on a global scale.
- In September 2025, Fluence Energy, Inc. began the production of its advanced Smartstack battery storage system at its fully automated plant located in Vietnam with a yearly production capacity of 35 GWh. This will enhance its international mobile energy storage manufacturing operations.
Report Scope
| Report Features | Description |
|---|---|
| Market Value (2025) | USD 7.6 Bn |
| Forecast Revenue (2035) | USD 22.8 Bn |
| CAGR (2026-2035) | 11.7% |
| Base Year for Estimation | 2025 |
| Historic Period | 2020-2024 |
| Forecast Period | 2026-2035 |
| Report Coverage | Revenue Forecast, Market Dynamics, Competitive Landscape, Recent Developments |
| Segments Covered | By Battery Type (Lithium-Ion, Lead Acid, Sodium‑based, Other chemistries), By Power Capacity (Less than 100 kW / <3,000 kWh, 100–500 kW / 3,000–10,000 kWh, Above 500 kW / >10,000 kWh), By Application (Construction sites and mining, C&I peak‑shaving / temporary power, On‑demand EV fast charging, Events, disaster relief, remote/off‑grid, Data centres and critical infrastructure), By Source Water (Trailer‑mounted systems, Standalone containerized solutions, Self‑driving / vehicle‑integrated systems) |
| Regional Analysis | North America – The US & Canada; Europe – Germany, France, The UK, Spain, Italy, Russia & CIS, Rest of Europe; APAC– China, Japan, South Korea, India, ASEAN & Rest of APAC; Latin America– Brazil, Mexico & Rest of Latin America; Middle East & Africa– GCC, South Africa, & Rest of MEA |
| Competitive Landscape | Tesla, Inc., BYD Company Ltd., LG Energy Solution Ltd., Samsung SDI Co., Ltd., Panasonic Corporation, CALB (China Aviation Lithium Battery), GE Renewable Energy / GE Energy Storage, Fluency Energy, Inc., Siemens Energy, ABB Ltd., Power Edison, Greener Engineering Inc., Aggreko plc, NEC Energy Solutions / NEC Corporation, Renewable Energy Systems Ltd. (RES), Others. |
| Customization Scope | Customization for segments, region/country-level will be provided. Moreover, additional customization can be done based on the requirements. |
| Purchase Options | We have three licenses to opt for: Single User License, Multi-User License (Up to 5 Users), Corporate Use License (Unlimited Users and Printable PDF) |





































