


Report Overview
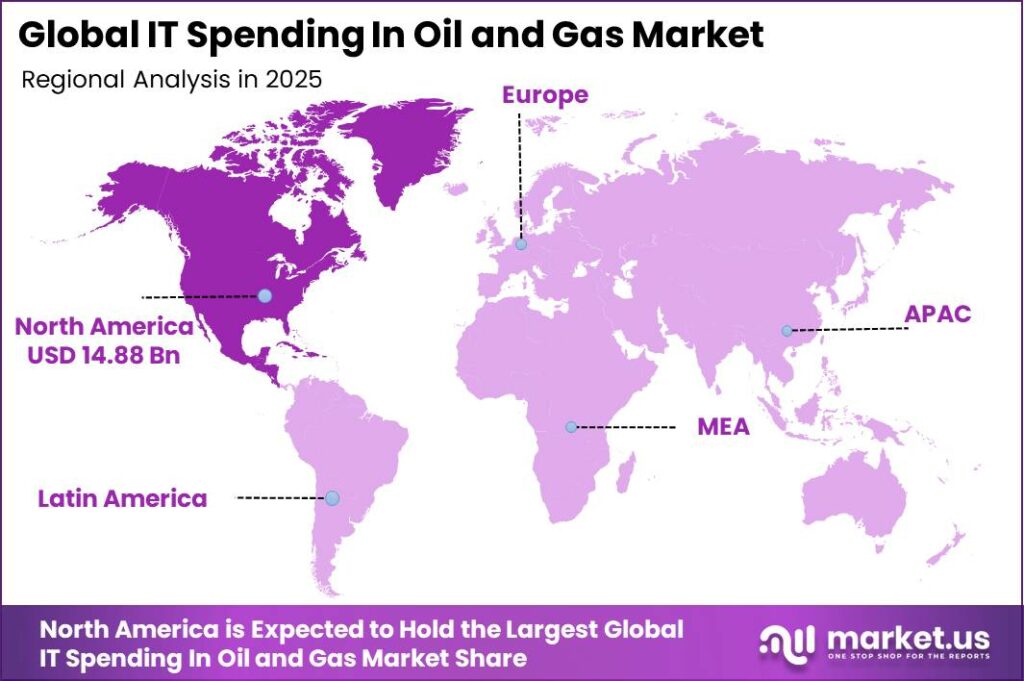
In 2025, the Global IT Spending in Oil and Gas Market was valued at USD 41.3 billion and is expected to reach approximately USD 77.2 billion by 2035, growing at a CAGR of 6.5%. North America accounts for more than 36% of the global market, representing approximately USD 14.8 billion in 2025, supported by its high oil and gas production, advanced digital infrastructure, and strong regulatory requirements.
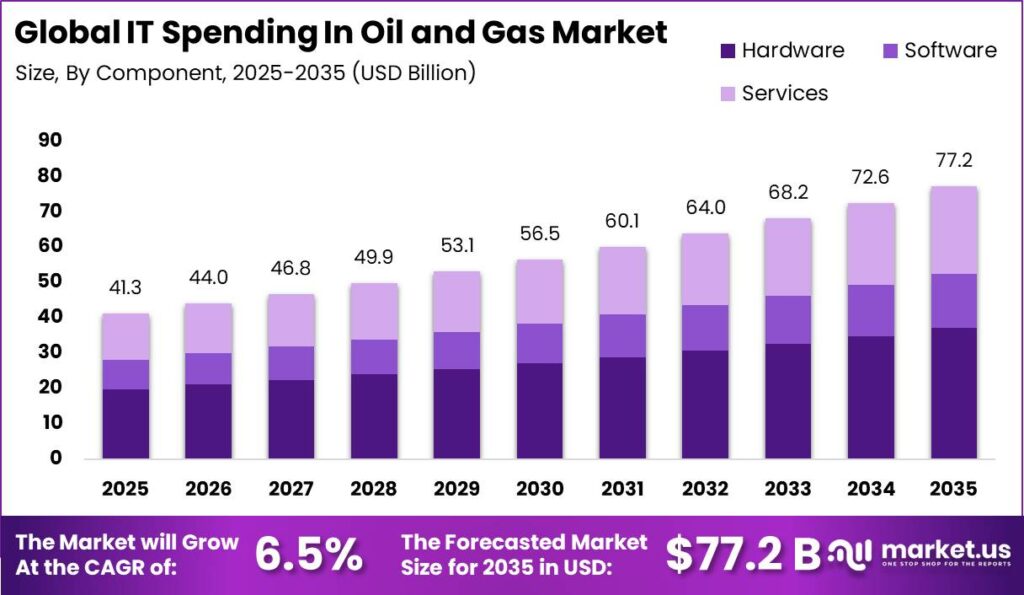
This growth is driven by increasing digital investment across the oil and gas value chain as companies focus on improving operational efficiency, reducing costs, and strengthening asset reliability. According to the International Energy Agency (IEA), global oil demand increased by 830 kb/d in 2025, while the U.S. Energy Information Administration (EIA) projects global oil consumption to reach 104.8 million barrels per day by 2027.
Rising production levels are increasing the need for enterprise software, cloud platforms, industrial IoT, cybersecurity, asset management, and advanced analytics. The U.S. EIA also reported record U.S. crude oil production averaging 13.61 million barrels per day and marketed natural gas production reaching 118.5 Bcf/d in 2025, further driving demand for digital technologies across upstream, midstream, and downstream operations.
The market is also benefiting from the growing need to manage large volumes of operational data generated from wells, pipelines, refineries, storage facilities, and trading operations. The IEA projects global data center electricity consumption to increase from 415 TWh in 2024 to 945 TWh by 2030, while the U.S. EIA expects total U.S. electricity demand to reach 4,193 billion kWh in 2025.
Key Takeaway
- The Global IT Spending in Oil and Gas Market was valued at USD 41.3 billion in 2025 and is projected to reach USD 77.2 billion by 2035, registering a 6.5% CAGR.
- Hardware dominated the component segment with a 48.0% market share in 2025.
- Cloud-based deployment led the market with a 61.0% share.
- Internet of Things (IoT) dominated the technology segment, accounting for 26.37% of the market.
- Upstream was the leading application segment with a 39.0% market share.
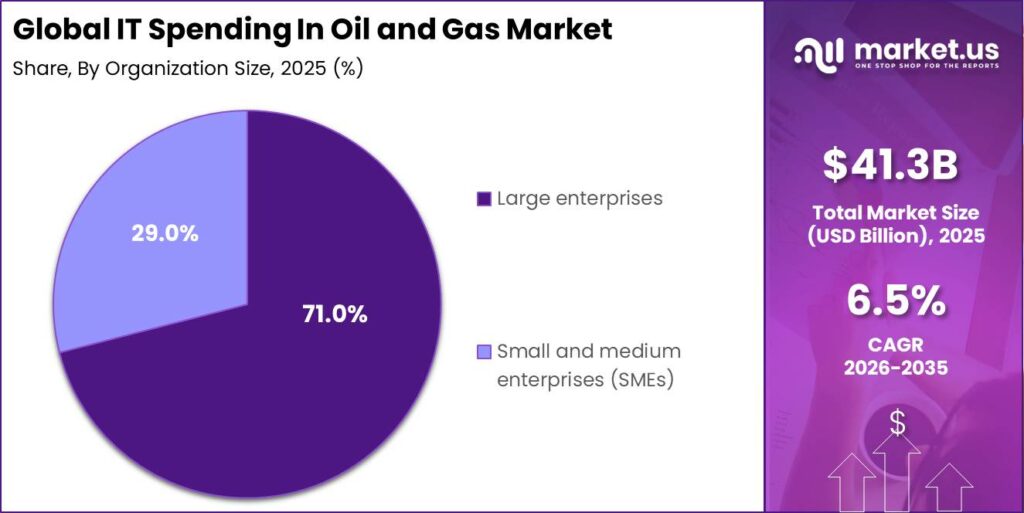
- Large enterprises dominated the organization size segment, holding a 71.0% share in 2025.
- North America accounts for more than 36.0% of the global market, representing approximately USD 14.8 billion in 2025.
By Component
The Hardware segment accounts for the largest share of IT spending in the oil and gas market, representing around 48.0% of total digital investments. This is because physical equipment is essential for operating and monitoring oil and gas assets safely and efficiently.
Global oil demand reached approximately 101.7 million barrels per day in 2023, while natural gas consumption totaled about 4,239 billion cubic meters, highlighting the large number of production sites, pipelines, refineries, and storage facilities that require continuous monitoring.
To support these operations, companies invest in rugged sensors, industrial control systems, servers, networking equipment, and edge computing devices that can perform reliably in harsh and remote environments, including offshore platforms. Upstream oil and gas capital spending exceeded USD 500 billion in 2023.
By Deployment Mode
Cloud-based deployment accounts for approximately 61.0% of IT spending in the oil and gas market, reflecting its growing importance in industry-wide digital transformation. According to the International Energy Agency (IEA), digital technologies can reduce upstream production costs by 10–20% and increase oil recovery by around 5%, making cloud infrastructure a key enabler of operational efficiency. With global oil demand exceeding 100 million barrels per day, oil and gas companies generate terabytes of real-time data from seismic surveys, drilling operations, subsea equipment, pipelines, and refineries.
Cloud platforms provide scalable computing power and storage, allowing operators to process this large volume of data more efficiently than traditional on-premise systems. They also support advanced applications such as artificial intelligence (AI), Internet of Things (IoT), predictive maintenance, digital twins, and remote operations across geographically distributed assets.
By Technology
The Internet of Things (IoT) segment holds the largest technology share in IT spending for the oil and gas market, accounting for approximately 26.37% of total spending. Its leadership is driven by the industry’s vast and geographically dispersed infrastructure, which requires continuous real-time monitoring. Globally, oil and gas pipeline networks extend over 1.18 million kilometers, covering at least 2,381 operational pipelines across 162 countries, making sensor-based monitoring essential for safe and efficient operations.
Oil pipelines alone exceed 86,000 kilometers, while global natural gas pipeline networks stretch across millions of kilometers, creating millions of monitoring points for connected IoT devices. The industry also flares around 167 billion cubic meters of natural gas each year, increasing the need for IoT-based sensors that support real-time emissions monitoring, leak detection, and operational optimization to meet stricter environmental regulations.
In addition, digital technologies are expected to generate up to USD 250 billion in value for the oil and gas industry by 2030, with connected equipment, field telemetry, and remote asset monitoring playing a major role. IoT platforms help operators improve equipment reliability, reduce downtime, enhance worker safety, and optimize production across upstream, midstream, and downstream operations.
By Application
The Upstream segment accounts for the largest share of IT spending in the oil and gas market, representing approximately 39% of total spending. This leadership is driven by the capital-intensive and data-heavy nature of exploration and production activities.
Upstream operations account for roughly 40% of total global oil and gas capital expenditure, with annual investments often exceeding USD 500 billion, making this segment the primary focus for digital technology adoption.
Offshore drilling projects can cost tens to hundreds of millions of dollars for a single well, while one seismic survey generates terabytes of subsurface data that require high-performance computing, advanced software, and secure data infrastructure for processing and analysis.
Oil and gas companies invest heavily in IT across four key upstream functions: seismic imaging, reservoir modeling, drilling automation, and production surveillance. Even a 1–2% improvement in operational efficiency can deliver multi-million-dollar savings across large asset portfolios.
By Organization Size
The Large Enterprises segment accounts for approximately 71.0% of IT spending in the oil and gas market, driven by its leadership in large-scale and capital-intensive operations. These companies contribute around 40% of global upstream capital expenditure and operate some of the industry’s most technology-intensive projects, including deepwater exploration, LNG facilities, and complex refining operations.
Although a small group of major oil and gas companies produces only about 10–15% of global oil and gas output, they play a key role in setting digital technology standards across the industry. They invest heavily in enterprise resource planning (ERP), cybersecurity, subsurface modeling, cloud computing, artificial intelligence (AI), and production optimization solutions.
This scale makes long-term investments in remote operations centers, predictive maintenance, industrial IoT, and centralized data platforms financially practical. Global energy investment totals trillions of dollars each year, and even allocating low single-digit percentages of these project budgets to digital technologies results in multi-billion-dollar IT investments.
The combination of large asset portfolios, complex operations, and continuous digital modernization enables large enterprises to maintain their leading 71% share of IT spending in the global oil and gas market.
Key Market Segments
By Component
- Hardware
- Software
- Services
By Deployment Mode
- Cloud-based
- On-premise
By Technology
- Artificial Intelligence & Machine Learning
- Internet of Things (IoT)
- Big Data & Analytics
- Robotic Process Automation (RPA)
- Others
By Application
- Upstream
- Midstream
- Downstream
By Organization Size
- Large enterprises
- Small and medium enterprises (SMEs)
Market Dynamics
Drivers
| Driver | (~) % CAGR | Geographic Relevance | Impact Timeline |
|---|---|---|---|
| AI-driven production optimization | +2.0% | North America, Europe, Middle East | Short term (≤ 2 years) |
| Cloud migration of subsurface data | +1.3% | Global offshore and shale basins | Medium term (2–4 years) |
| Cybersecurity modernization post-attacks | +1.0% | North America, Europe | Short term (≤ 2 years) |
| Integrated digital operations centers | +0.9% | Middle East, Latin America | Medium term (2–4 years) |
| Regulatory push for emissions monitoring IT | +0.7% | Europe, North America | Medium term (2–4 years) |
| Remote operations and autonomous assets | +0.6% | Arctic, deepwater, remote onshore | Long term (≥ 4 years) |
AI-driven production optimization
Over the 2024–2026 window, oil and gas operators have accelerated deployment of AI and advanced analytics to optimize drilling, completion design, and production throttling, with several large integrated oil companies reporting double-digit gains in well productivity and 5–10% reductions in lifting costs on AI-enabled assets compared with legacy fields.
By ingesting petabytes of historical seismic, well-log, and real-time sensor data into AI models hosted on scalable cloud platforms, operators can reduce non-productive time by roughly 10–20%, trim unplanned downtime on rotating equipment by 20–30%, and cut drilling days per well by 5–15%, directly shifting opex profiles and freeing up budget for incremental IT spend.
This materially alters IT commercial models from one-off license purchases to recurring SaaS and managed-analytics contracts, with some upstream portfolios channeling more than 40% of their digital budgets into AI and analytics use cases by the mid-2020s, thereby supporting an incremental uplift of roughly +2.0% on the baseline IT spending CAGR as AI-centric platforms become the default for new field developments and brownfield optimization.
Restraints
| Restraint | (~) % CAGR | Geographic Relevance | Impact Timeline |
|---|---|---|---|
| Persistent upstream price volatility and capex discipline | -2.1% | Global | Short term (≤ 2 years) |
| Legacy OT systems and vendor lock-in | -1.2% | Middle East, CIS, parts of Asia | Medium term (2–4 years) |
| Stringent data privacy and residency rules | -0.9% | Europe, selected APAC markets | Medium term (2–4 years) |
| High cost of specialized industrial connectivity | -0.8% | Remote offshore and onshore | Long term (≥ 4 years) |
| Financing constraints for smaller independents | -0.7% | North America, Latin America | Short term (≤ 2 years) |
| Political instability in key producing regions | -0.6% | Middle East, North Africa | Medium term (2–4 years) |
Persistent upstream price volatility and capex discipline
Since the early 2020s, upstream operators have responded to sharp swings in benchmark crude prices and higher interest rates by tightening capital allocation, with many large producers holding annual upstream capex at roughly flat levels even when prices briefly rose above historical averages, and explicitly prioritizing dividends and buybacks over incremental digital investments.
This discipline means IT programs must compete within constrained capital envelopes where only projects with payback periods below roughly 24–36 months, internal rates of return exceeding 15–20%, and clear opex savings per barrel can be approved, resulting in deferral or downsizing of multi-year ERP, subsurface data-platform, and field-wide automation rollouts.
For the IT spending in the oil and gas market, this behavior translates into an estimated drag of around -2.1% on the otherwise higher potential CAGR, as operators phase implementations into smaller tranches, renegotiate contracts to reduce up-front license fees in favor of subscription models, and postpone large-scale modernization in assets with remaining productive lives under roughly 10 years.
Challenges
| Challenge | (~) % CAGR | Geographic Relevance | Mitigation Horizon |
|---|---|---|---|
| Acute OT cybersecurity skills gap | -1.5% | North America, Europe, Middle East | Medium term (2–4 years) |
| Complex integration of IT and OT stacks | -1.3% | Global brownfield assets | Long term (≥ 4 years) |
| Data quality and governance in legacy fields | -1.1% | Global | Long term (≥ 4 years) |
| Change management and workforce adoption | -0.9% | Global | Medium term (2–4 years) |
| Connectivity reliability for real-time analytics | -0.8% | Remote offshore and frontier basins | Long term (≥ 4 years) |
| Vendor ecosystem fragmentation | -0.7% | Global | Medium term (2–4 years) |
Acute OT cybersecurity skills gap
While cyber incidents targeting energy infrastructure have risen markedly in the mid-2020s, with industry analyses indicating double-digit percentage increases in attempted attacks on pipeline operators and upstream assets, there remains a pronounced shortage of professionals who understand both industrial control systems and modern cybersecurity practices, creating a systemic drag on IT project execution velocity.
Many operators report that fully staffing a single major asset with OT-savvy security engineers can take more than 12–18 months, driving day-rate inflation for such roles by an estimated 20–30% versus generic IT security positions and forcing companies to stagger rollouts of security monitoring, zero-trust architectures, and secure remote-operations platforms across fields.
This structural talent bottleneck effectively caps the number of concurrent cybersecurity and digitalization projects an operator can support, translating into a frictional drag of roughly -1.5% on the market’s attainable growth rate as vendors re-scope engagements around managed services, increased automation, and standardized blueprints to partially offset human-resource constraints over a mitigation horizon of at least 2–4 years.
Opportunities
| Opportunity | (~) % CAGR | Geographic Relevance | Execution Window |
|---|---|---|---|
| Unified cloud-native subsurface platforms | +1.9% | Global | Medium term (2–4 years) |
| Outcome-based AI optimization contracts | +1.6% | North America, Middle East | Short term (≤ 2 years) |
| Specialized energy data sovereignty clouds | +1.3% | Europe, Middle East | Medium term (2–4 years) |
| Integrated LNG and trading analytics suites | +1.2% | Europe, Asia-Pacific | Medium term (2–4 years) |
| M&A-driven consolidation of niche OT vendors | +1.0% | Global | Long term (≥ 4 years) |
| Emissions and methane intensity monetization tools | +0.9% | North America, Europe | Medium term (2–4 years) |
Unified cloud-native subsurface platforms
This opportunity remains largely untapped because most subsurface workflows still run on fragmented, on-premise environments, and only a minority of global reserves and seismic libraries have been fully migrated to cloud-native platforms that can scale analytics elastically and support cross-asset collaboration.
Consolidating seismic, well, and production data into unified environments with high-performance compute can cut data-management and infrastructure costs per well by an estimated 15–25%, reduce project cycle times for field development planning by roughly 10–20%, and enable more accurate volumetric and risk assessments that shift portfolio decisions toward higher-margin barrels, expanding operating margins on new projects by potentially 1–3 percentage points.
Because this architecture change also unlocks new monetization models including tiered SaaS subscriptions, consumption-based compute pricing, and premium collaboration features for joint ventures, vendors capturing this white space can add an estimated incremental upside of around +1.9% to the market CAGR above the baseline, without relying on overall hydrocarbon volume growth but instead on improved unit economics and higher IT spend per barrel developed.
Geopolitical Impact Analysis
Geopolitical tensions and global supply chain disruptions are increasing costs and delaying IT investments in the oil and gas industry. According to UNCTAD, attacks in the Red Sea reduced weekly container ship traffic by 67% compared with the previous year. During the same period, spot freight rates from Shanghai increased by 122% overall, including 256% on routes to Europe and 162% to the U.S. West Coast.
These higher transportation costs have increased the delivered prices of imported servers, industrial computers, networking equipment, sensors, and automation hardware used in oil and gas operations. As a result, companies are experiencing estimated landed cost increases of 20–40% for critical IT and operational technology equipment.
The World Bank also reported that by October 2024, shipping distances for cargo vessels and tankers using alternative routes increased by 48% and 38%, respectively, adding 10–15 days to delivery times. To avoid project delays, many operators are increasing inventories of essential IT components by 25–30%, raising overall project costs.
Energy price fluctuations are also affecting IT spending decisions across the oil and gas sector. The U.S. EIA projects Brent crude oil prices to average around USD 103 per barrel in Q2 2026 before declining to about USD 70 per barrel by Q4 2026, representing a change of roughly 32%. Higher energy prices increase the operating costs of data centers and digital infrastructure that support real-time monitoring, analytics, and production optimization.
In high-cost regions, electricity price increases of 20–30% can raise the total cost of ownership of digital infrastructure by 5–8% over 3–5 years, causing companies to delay large-scale IT modernization projects. The IMF estimates that severe global trade fragmentation could reduce long-term global economic output by up to 7%, increasing investment risks and financing costs for digital transformation projects across the oil and gas industry.
Regional Analysis
North America dominates the global IT spending in the oil and gas market, accounting for 36.0% of total market revenue, equivalent to approximately USD 14.88 billion in 2025. The region’s leadership is supported by its large oil and gas production base, advanced digital infrastructure, and strong investments in cloud computing, cybersecurity, industrial IoT, artificial intelligence (AI), and enterprise software.
The United States and Canada continue to invest heavily in digital technologies to improve drilling efficiency, optimize production, strengthen pipeline monitoring, and enhance refinery operations. Upstream activities account for a significant share of regional IT investments, with an estimated USD 8.2 billion allocated to exploration and production applications.
Asia Pacific is the fastest-growing regional market, driven by rising energy demand, expanding refining capacity, and increasing investments in digital transformation. The region represents an estimated IT spending base of USD 9–10 billion and is expected to grow at a CAGR of approximately 7–9% over the forecast period. China, India, and Southeast Asia together account for nearly 80% of regional IT spending, representing approximately USD 7.2–8.0 billion in annual investments.
Oil and gas companies across the region are rapidly adopting cloud platforms, AI, machine learning, industrial IoT, integrated asset management systems, and centralized data platforms to improve operational efficiency and asset performance. Asia Pacific is expected to add approximately USD 0.7–0.9 billion in new IT spending annually, making it the fastest-growing contributor to global IT spending in the oil and gas market.
Key Regions and Countries
North America
- US
- Canada
Europe
- Germany
- France
- The UK
- Spain
- Italy
- Rest of Europe
Asia Pacific
- China
- Japan
- South Korea
- India
- Australia
- Rest of APAC
Latin America
- Brazil
- Mexico
- Rest of Latin America
Middle East & Africa
- GCC
- South Africa
- Rest of MEA
Key Players Analysis
Tier-1 companies, including Microsoft, IBM, SAP, and Oracle, lead the global IT spending in the oil and gas market by accounting for an estimated 40–50% of digital and cloud investments made by large energy companies. Their strong positions are supported by cloud computing, enterprise resource planning (ERP), artificial intelligence (AI), and data management platforms used across exploration, production, refining, and pipeline operations.
Microsoft reported USD 281.7 billion in revenue in FY2025, including approximately USD 106 billion from its Intelligent Cloud business. IBM generated USD 67.5 billion in FY2025 revenue, while SAP reported EUR 34.2 billion in revenue in 2024, including EUR 17.1 billion from cloud and software, and expects cloud revenue of EUR 21.0–21.02 billion in 2025. Oracle also reported strong growth, with USD 14.1 billion in Q3 FY2025 revenue and USD 11 billion from cloud services and license support.
Tier-2 companies, such as Siemens, Infosys, Tata Consultancy Services (TCS), and Wipro, strengthen their market position by providing industrial automation, system integration, cloud migration, cybersecurity, and managed IT services. Siemens reported EUR 19.4 billion in Q3 FY2025 revenue, including EUR 4.4 billion from Digital Industries, while its software annual recurring revenue increased from EUR 3.7 billion to EUR 4.9 billion, including EUR 2.1 billion in cloud ARR.
Infosys and TCS generated approximately USD 14 billion and USD 25 billion in annual revenue, respectively. As oil and gas companies continue investing in digital transformation, Tier-1 vendors are expanding through cloud platforms and enterprise software, while Tier-2 companies benefit from long-term outsourcing, operational technology integration, and digital modernization projects.
Top Key Players in the Market
- Microsoft
- IBM
- SAP
- Oracle
- Dell
- Cisco Systems
- ABB
- Siemens
- Hitachi
- Huawei Technologies
- GE Oil and Gas (GE Vernova)
- TCS
- Capgemini
- Wipro
- HCL Technologies
Recent Developments
- June 2026, Schneider Electric signed a definitive all-cash agreement to acquire 100% of Cognite Holding B.V. for USD 3.1 billion. Cognite will be integrated with AVEVA and consolidated into Schneider Electric’s Industrial Automation business, strengthening its industrial AI and data software capabilities for the oil and gas sector.
- May 2026, IBM and Oracle expanded their partnership to bring IBM’s watsonx AI portfolio and orchestration tools to Oracle Cloud Infrastructure (OCI). The collaboration aims to accelerate hybrid cloud modernization for asset-intensive industries, including oil and gas, with new capabilities scheduled for rollout later in 2026.
- March 2026, Oceânica Engenharia signed multi-year technical and inspection contracts with Petrobras worth approximately USD 736 million. The agreements run through 2031 and highlight continued investment in long-term digital engineering and technical services across the oil and gas industry.
Report Scope
| Report Features | Description |
|---|---|
| Market Value (2025) | USD 41.3 Billion |
| Forecast Revenue (2035) | USD 77.2 Billion |
| CAGR (2026-2035) | 6.5% |
| Base Year for Estimation | 2025 |
| Historic Period | 2020-2024 |
| Forecast Period | 2026-2035 |
| Report Coverage | Revenue Forecast, Market Dynamics, Competitive Landscape, Recent Developments |
| Segments Covered | By Component (Hardware, Software, Services), By Deployment Mode (Cloud-based, On-premise), By Technology (Artificial Intelligence & Machine Learning, Internet of Things (IoT), Big Data & Analytics, Robotic Process Automation (RPA), Others), By Application (Upstream, Midstream, Downstream), By Organization Size (Large Enterprises, Small and Medium Enterprises (SMEs)) |
| Regional Analysis | North America – US, Canada; Europe – Germany, France, The UK, Spain, Italy, Rest of Europe; Asia Pacific – China, Japan, South Korea, India, Australia, Singapore, Rest of APAC; Latin America – Brazil, Mexico, Rest of Latin America; Middle East & Africa – GCC, South Africa, Rest of MEA |
| Competitive Landscape | Microsoft, IBM, SAP, Oracle, Dell, Cisco Systems, ABB, Siemens, Hitachi, Huawei Technologies, GE Oil and Gas (GE Vernova), TCS, Capgemini, Wipro, HCL Technologies |
| Customization Scope | Customization for segments and region/country-level will be provided. Moreover, additional customization can be done based on the requirements. |
| Purchase Options | We have three licenses to opt for: Single User License, Multi-User License (Up to 5 Users), Corporate Use License (Unlimited Users and Printable PDF) |





























