


Report Overview
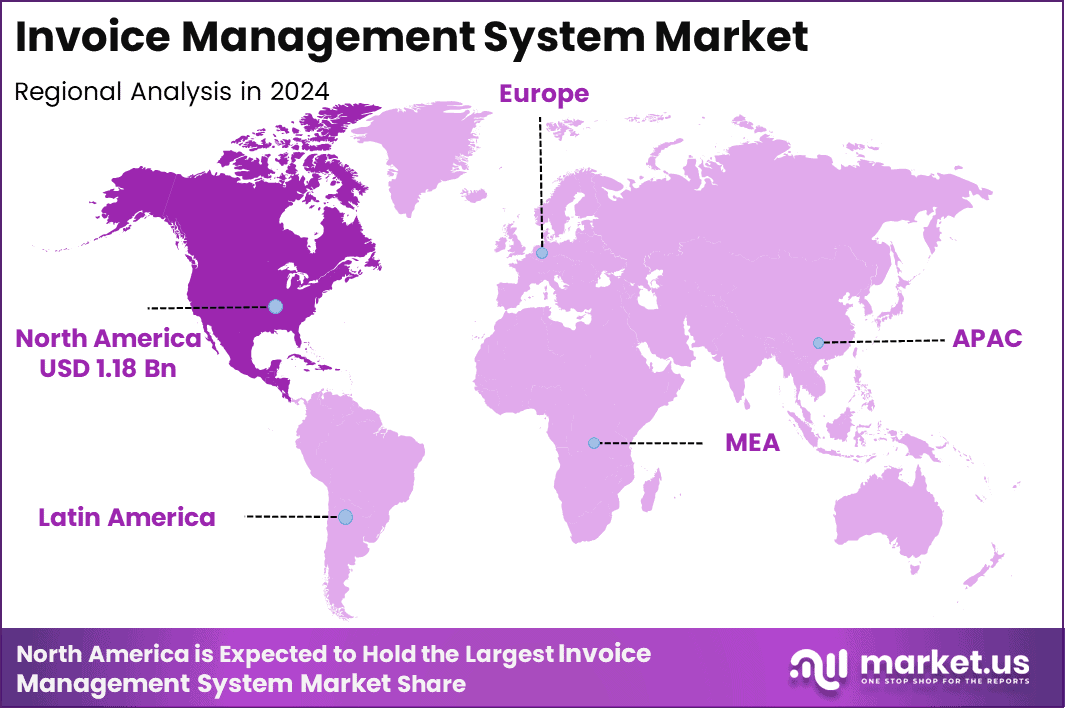
In 2024, the Global Invoice Management System Market was valued at USD 3.48 billion. The market is projected to grow at a CAGR of 8.4% during 2024–2034, reaching approximately USD 7.8 billion by 2034. North America dominated the global market in 2024, accounting for 34.1% of the total market share and generating approximately USD 1.2 billion in revenue.
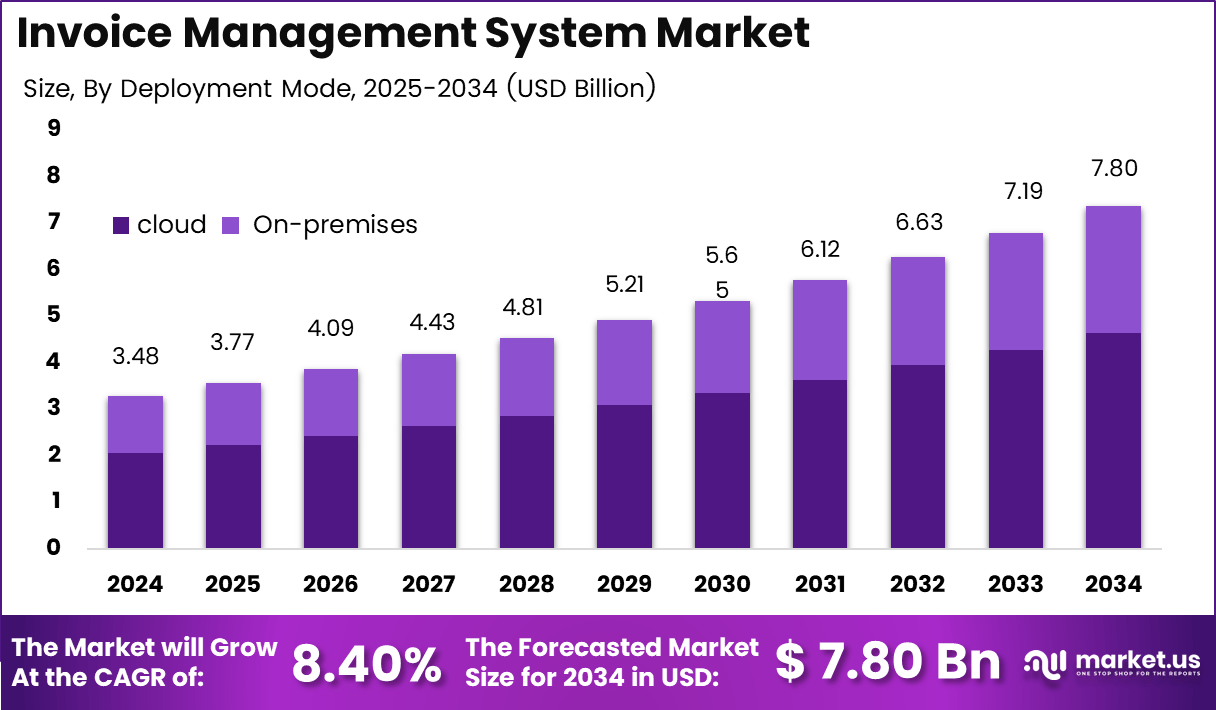
The U.S. Federal Reserve estimates that around 500 billion bills and invoices are generated each year globally, yet only about 8.4% were exchanged electronically in 2015, leaving a huge base still shifting from paper to digital workflows. As governments introduce e‑invoicing mandates for tax reporting and public procurement, the OECD notes that many countries now require electronic invoices at least for larger firms and for dealings with the public sector.
The World Bank reports that small and medium enterprises represent around 90% of businesses worldwide, and their investment in digital tools more than doubled between 2020 and 2022, directly increasing demand for automated invoice management to control cash flow and reduce errors. This combination of regulatory pressure, huge invoice volumes, and SME digital adoption provides a clear, numeric base for sustained, mid‑single‑digit market expansion.
Key Takeaways
- The global Invoice Management System Market was valued at USD 3.48 billion in 2024.
- The global Invoice Management System Market is projected to grow at a CAGR of 8.4% and is estimated to reach USD 7.05 billion by 2034.
- On the basis of deployment mode, the Cloud segment dominated the market, accounting for 59.4% of the total market share.
- Based on organization size, the Large Organization segment dominated the market, accounting for 63.7% of the total market share.
- By end use, the Retail segment dominated the market, accounting for 24.1% of the total market share.
- In 2024, North America was the most dominant region in the Invoice Management System Market, accounting for 34.1% of the total market share, equivalent to approximately USD 1.2 billion.
Analysts’ Viewpoint
The US Invoice Management System Market is undergoing steady growth, primarily driven by the need for improved operational efficiency in the management of invoices across industries. Companies are adopting automated invoice management solutions to streamline financial workflows, reduce manual errors, and enhance transparency.
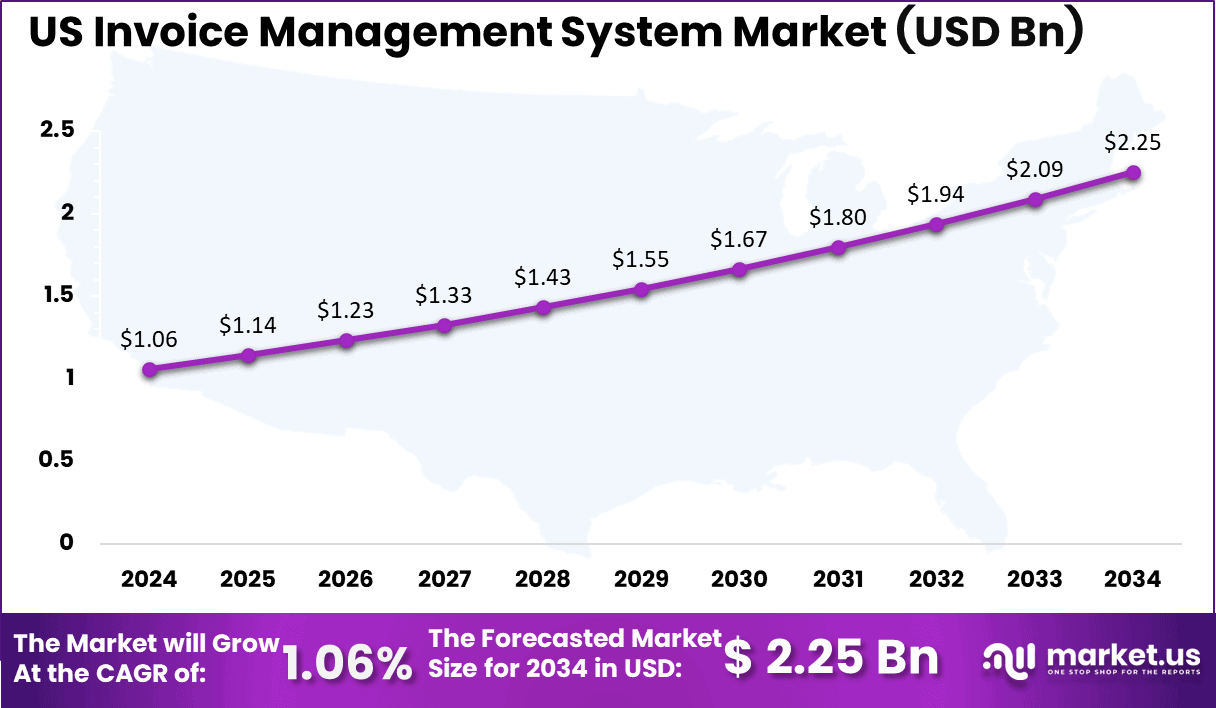
The market is also seeing a shift towards cloud-based solutions, which offer greater flexibility and scalability for businesses of all sizes. Furthermore, the ongoing digital transformation in various sectors, including healthcare, logistics, and manufacturing, is driving this market’s expansion. With a projected USD 2.25 billion by 2034, organizations are expected to prioritize systems that integrate seamlessly with their existing financial infrastructure, offering real-time data and robust analytics.
By Organization Size
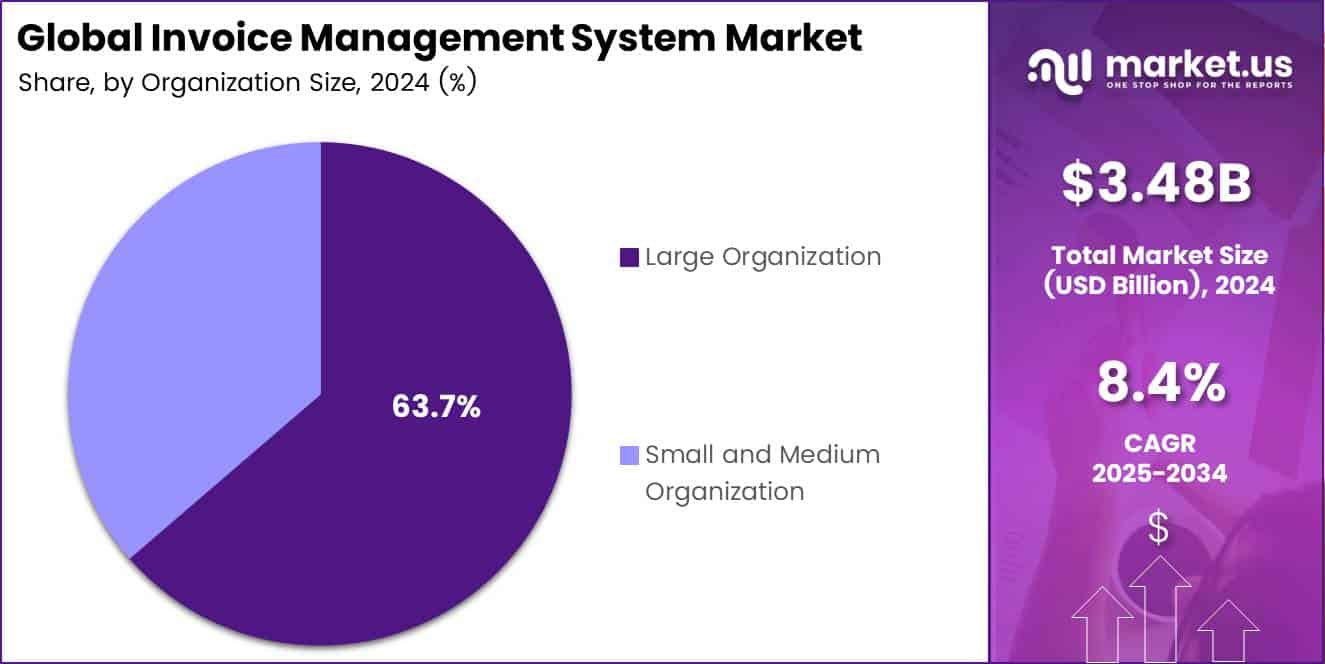
In the US Invoice Management System Market, large organizations dominate with 63.7% of the market share. These organizations benefit from larger budgets, allowing them to invest in robust and scalable invoicing solutions capable of handling high transaction volumes.
The need for comprehensive and automated systems that can streamline invoicing and financial operations drives the dominance of large organizations in the market. It is predicted that by 2034, the market share of large organizations may increase slightly to 65%, as more large enterprises continue to adopt advanced automation technologies.
By Deployment Mode
The cloud deployment mode is projected to lead the US Invoice Management System Market, with an increasing adoption rate expected to reach 59.4% of the market share by 2034. This growth reflects the rising preference for scalable, secure, and cost-effective cloud-based solutions.
By 2034, cloud solutions could comprise up to 67% of the market as businesses continue to prioritize flexibility, remote access, and integration with existing infrastructure. In comparison, on-premises deployments are expected to steadily decrease in market share, highlighting the shift towards more efficient cloud technologies.
By End Use
Among the various end-use sectors, Retail is projected to hold the largest share of the market, accounting for 24.1% in 2024. As the retail sector increasingly embraces digital invoicing for better transaction management, the segment’s market share is expected to grow to 26% by 2034.
The Healthcare and BFSI sectors will also experience growth, but retail’s focus on real-time data, customer service, and streamlined billing solutions will continue to position it as the dominant segment in the market, outpacing other industries in the coming years.
Key Market Segments
By Deployment Mode
- On-premises
- cloud
By Organization Size
- Large Organization
- Small and Medium Organization
By End Use
- IT & Telecom
- BFSI
- Government
- Retail
- Healthcare
- Education
- Others
Regional Analysis
North America is emerging as the dominating region, accounting for a 34.1% share and an estimated market value of around USD 1.2 billion. This leadership is underpinned by high levels of enterprise digitization, mature cloud infrastructure, and rapid adoption of SaaS-based financial applications, particularly in the U.S. and Canada.
Asia Pacific is recognized as the fastest-growing regional market, supported by rapid economic expansion, escalating digital transformation initiatives, and government-backed programs to promote e-invoicing and tax digitization.
Emerging economies across the region are witnessing accelerated adoption of cloud-based billing and invoicing platforms by SMEs, driven by the need to streamline cash-flow management and integrate accounting with broader ERP and payment ecosystems.
US Market Size
The US Invoice Management System Market is projected to reach USD 1.06 billion in 2024, with expectations to grow to USD 2.25 billion by 2034, expanding at a CAGR of 1.06%. The consistent growth of this market reflects the ongoing trend of businesses adopting automated solutions for invoice management. This shift is driven by the need to improve efficiency, reduce human error, and ensure compliance with increasingly complex regulations.
Key Regions and Countries
- North America
- US
- Canada
- Europe
- Germany
- France
- The UK
- Spain
- Italy
- Rest of Europe
- Asia Pacific
- China
- Japan
- South Korea
- India
- Australia
- Singapore
- Rest of Asia Pacific
- Latin America
- Brazil
- Mexico
- Rest of Latin America
- Middle East & Africa
- South Africa
- Saudi Arabia
- UAE
- Rest of MEA
Market Dynamics
Drivers
| Driver | (~) % Impact on CAGR Forecast | Geographic Relevance | Impact Timeline |
|---|---|---|---|
| Mandated e-invoicing for B2G | +2.3% | EU, UK, Latin America, selected APAC | Short term (≤ 2 years) |
| Enterprise AP automation adoption | +1.8% | North America, Western Europe, developed APAC | Medium term (2–4 years) |
| Cloud-first financial system modernization | +1.4% | Global | Medium term (2–4 years) |
| SME digitization of billing workflows | +1.1% | Global, with concentration in Asia and emerging markets | Short term (≤ 2 years) |
| Demand for real-time invoice visibility | +0.9% | Global mid-market and large enterprises | Short term (≤ 2 years) |
| Integration with digital payment rails | +0.7% | Global, strongest in North America & Europe | Medium term (2–4 years) |
Mandated e-invoicing for B2G
Root cause is the progressive rollout of mandatory electronic invoicing standards in public procurement, such as the EU’s Directive 2014/55/EU requiring all contracting authorities to be able to receive EN-compliant e-invoices by April 2020, followed by national implementations that have pulled suppliers onto standardized invoicing rails in 2022–2024.
In several EU states, over 90% of central government invoices are now electronic, with supplier-side processing costs falling from roughly $15–$40 per invoice to low single-digit dollars when automated. Commercially, this regulatory push accelerates the shift from on-premise, license-based billing software to SaaS invoice management platforms that bundle compliance updates, legal archiving for periods of 7–10 years, and multi-tenant security.
Vendors can price per active supplier or per invoice (often $0.10–$0.50 per document), while enterprises unlock AP labor savings equivalent to thousands of hours per year and reduce payment cycle times by 5–10 days, supporting higher recurring revenues and stickier contracts that credibly add around 2.3% to the baseline market CAGR.
Restraints
| Restraint | (~) % Impact on CAGR Forecast | Geographic Relevance | Impact Timeline |
|---|---|---|---|
| High interest rate environment | –2.0% | North America, Europe, selected emerging markets | Short term (≤ 2 years) |
| Legacy ERP lock-in | –1.5% | Global large enterprises | Medium term (2–4 years) |
| Compliance anxiety over tax audits | –1.2% | Emerging markets with evolving GST/VAT regimes | Short term (≤ 2 years) |
| Budget constraints in SMEs | –1.1% | Global micro & small enterprises | Short term (≤ 2 years) |
| Fragmented local invoicing standards | –0.9% | Latin America, parts of APAC, Africa | Medium term (2–4 years) |
| Cybersecurity and data residency concerns | –0.7% | Regulated sectors globally | Long term (≥ 4 years) |
High interest rate environment
The root restraint is the elevated interest rate environment observed through 2023–2024, with policy rates in major economies rising by 300–500 basis points versus pre-2020 levels, according to central bank data, materially increasing the cost of capital for both enterprises and SMEs.
Even though invoice management deployments can cut per-invoice processing costs from around $20 to below $5 and reduce manual keying, still used by about 60% of AP teams, by more than half, discretionary cloud migrations are often postponed.
Strategically, this restraint forces vendors to accept slower new-logo acquisition and more opportunistic upsell cycles, compressing near-term ARR growth by an estimated 2.0% against the baseline CAGR as projects are re-phased, deal sizes trimmed, and multi-year commitments shortened in response to tighter internal hurdle rates.
Challenges
| Challenge | (~) % CAGR Friction Drag | Geographic Relevance | Mitigation Horizon |
|---|---|---|---|
| Complex multi-jurisdiction tax compliance | –1.9% | Global, multi-country enterprises | Long term (≥ 4 years) |
| Integration with heterogeneous back-office | –1.6% | Global, especially mid-market | Medium term (2–4 years) |
| Limited automation skills in AP teams | –1.3% | Global, skewed to SMEs | Medium term (2–4 years) |
| Data quality and supplier master issues | –1.0% | Global | Short term (≤ 2 years) |
| Change management and user adoption | –0.9% | Global | Medium term (2–4 years) |
| Vendor lock-in risk perceptions | –0.8% | Global enterprises | Long term (≥ 4 years) |
Complex multi-jurisdiction tax compliance
A structural challenge is the proliferation of heterogeneous VAT and GST e-invoicing rules across jurisdictions, with countries such as India rolling out phased B2B e-invoicing tied to annual aggregate turnover thresholds (e.g., obligations extending from above 20 crore to above 10 crore and later 5 crore in the 2021–2023 period), while Latin American clearance models and European B2G mandates impose distinct technical schemas and reporting deadlines.
For global enterprises processing hundreds of thousands of invoices annually across more than 20 tax regimes, this raises quantifiable friction. Invoice management vendors must maintain dozens of connectors and rule engines, with ongoing configuration effort consuming up to 15–25% of product engineering capacity and increasing implementation timelines by 3–6 months, while customers face risk of penalties in the low single-digit percent of invoice values if formats or timestamps slip.
Over the long term, corporates respond with centralization of tax technology, creation of specialist compliance teams of 5–20 FTEs, and standardization on a smaller set of invoice management platforms. However, the complexity drag trims the maximum attainable market growth by an estimated 1.9%, as deployments remain slower, customization-heavy, and regionally staggered rather than globally uniform.
Opportunities
| Opportunity | (~) % Potential CAGR Upside | Geographic Relevance | Execution Window |
|---|---|---|---|
| Embedded working-capital financing | +2.1% | Global, strongest in trade-intensive economies | Medium term (2–4 years) |
| AI-driven touchless invoice operations | +1.7% | North America, Europe, advanced APAC | Medium term (2–4 years) |
| Verticalized invoice management solutions | +1.4% | Global sector-specific deployments | Long term (≥ 4 years) |
| SME self-service invoicing ecosystems | +1.2% | Global, with focus on emerging markets | Long term (≥ 4 years) |
| Real-time analytics and cash forecasting | +1.0% | Global mid-market and enterprises | Medium term (2–4 years) |
| M&A consolidation of regional vendors | +0.8% | Europe, APAC, Latin America | Long term (≥ 4 years) |
Embedded working-capital financing
Unlike today’s core driver of mandated e-invoicing adoption, the opportunity in embedded working-capital financing is largely untapped. Most invoice management systems currently stop at workflow and compliance, leaving early-payment discounts and supply chain finance to separate banking relationships, even though AP data shows that over 50% of suppliers would accept 1–3% discounts for payment acceleration of 15–30 days.
By integrating invoice platforms directly with financiers and treasury systems, vendors can enable dynamic discounting and auction-based early payment at scale, turning each processed invoice, often numbering in the tens or hundreds of thousands per buyer annually, into an opportunity for yield generation and margin expansion. Buyers may capture 100–200 basis points of procurement savings, while platforms charge financing origination or take-rate fees in the low single digits of financed volume.
Strategically, this transforms invoice management from a cost-center tool into a revenue-generating infrastructure, improving unit economics so that customer lifetime value can rise by 30–50% versus pure software subscriptions and supporting an incremental upside of around 2.1% above the baseline CAGR once embedded finance capabilities are rolled out across major trade-intensive sectors over the next 2–4 years.
Key Player Analysis
The invoice management system market is dominated by Tier-1 ERP and financial software vendors, which collectively hold an estimated 55–65% share of enterprise-grade invoice automation spend, while Tier-2 AP automation and fintech platforms capture the remaining 35–45%. The broader billing and invoicing software market is estimated at USD 5.43 billion in 2025 and is projected to reach USD 15.7 billion by 2034 at a 12.51% CAGR, with North America accounting for roughly 45% of demand.
Tier-1 leaders such as SAP, Oracle, Microsoft, Salesforce, and Intuit embed invoice management within ERP and financial suites, using cross-selling and bundled subscriptions to drive adoption. SAP’s Intelligent Spend and Business Network segment generated EUR 1.86 billion in 2023, up 19% year-on-year.
Oracle’s Cloud Services and License segment reported USD 36.7 billion in FY 2024 revenue, while Microsoft’s Business Applications segment recorded USD 5.9 billion. Collectively, these platforms realistically control more than 60% of enterprise invoice management software budgets through integrated workflow and financial solutions.
Tier-2 providers such as HighRadius, Stampli, Kofax, Coupa, Tipalti, and regional players like Finifi focus on AI-driven invoice capture, exception handling, and supplier payment orchestration. The broader invoice processing software market was estimated at USD 36.1 billion in 2025 and is projected to reach USD 189.2 billion by 2035 at an 18% CAGR.
Top Key Players
- BILL Holdings, Inc.
- Xero Limited
- Intuit Inc.
- 2ndSite Inc.
- Sage Group plc
- Tipalti Solutions Ltd.
- Airwallex (Hong Kong) Limited
- Airbase, Inc.
- DocuWare GmbH
- Yooz Inc.
- Stampli Inc.
- Pleo Technologies A/S
- Invoicera Global Solutions Pvt. Ltd.
- Zoho Corporation Pvt. Ltd.
- AvidXchange Holdings, Inc.
- Others
Recent Development
- In February 2025, Basware announced that its Invoice Lifecycle Management and AP automation platform had cumulatively processed more than 2 billion invoices, including over 230 million invoices in the prior 12 months, while managing USD 10.1 trillion of spend through its network, marking a large‑scale operational expansion of invoice management capacity and transaction volume globally.
- In May 2024, Basware, a global AP automation and invoice processing provider, acquired AP Matching, adding automated statement‑reconciliation to its invoice processing stack; the transaction unified invoice processing and statement matching for thousands of enterprise AP teams and was disclosed as a strategic acquisition to enhance end‑to‑end invoice lifecycle accuracy and cost savings
Report Scope
| Report Features | Description |
|---|---|
| Market Value (2024) | USD 3.48 Bn |
| Forecast Revenue (2034) | USD 7.8 Bn |
| CAGR(2025-2034) | 8.4% |
| Base Year for Estimation | 2024 |
| Historic Period | 2020-2023 |
| Forecast Period | 2025-2034 |
| Report Coverage | Revenue forecast, AI impact on Market trends, Share Insights, Company ranking, competitive landscape, Recent Developments, Market Dynamics, nd Emerging Trends |
| Segments Covered | By Deployment Mode (On-premises, cloud), By Organization Size (Large Organization, Small and Medium Organization), By End Use (IT & Telecom, BFSI, Government, Retail, Healthcare, Education, Others) |
| Regional Analysis | North America – US, Canada; Europe – Germany, France, The UK, Spain, Italy, Russia, Netherlands, Rest of Europe; Asia Pacific – China, Japan, South Korea, India, New Zealand, Singapore, Thailand, Vietnam, Rest of Latin America; Latin America – Brazil, Mexico, Rest of Latin America; Middle East & Africa – South Africa, Saudi Arabia, UAE, Rest of MEA |
| Competitive Landscape | BILL Holdings, Inc., Xero Limited, Intuit Inc., 2ndSite Inc., Sage Group plc, Tipalti Solutions Ltd., Airwallex (Hong Kong) Limited, Airbase, Inc., DocuWare GmbH, Yooz Inc., Stampli Inc., Pleo Technologies A/S, Invoicera Global Solutions Pvt. Ltd., Zoho Corporation Pvt. Ltd., AvidXchange Holdings, Inc., Others |
| Customization Scope | Customization for segments, region/country-level will be provided. Moreover, additional customization can be done based on the requirements. |
| Purchase Options | We have three licenses to choose from: Single User License, Multi-User License (Up to 5 Users), Corporate Use License (Unlimited Users, Printable PDF) |





























