


Report Overview
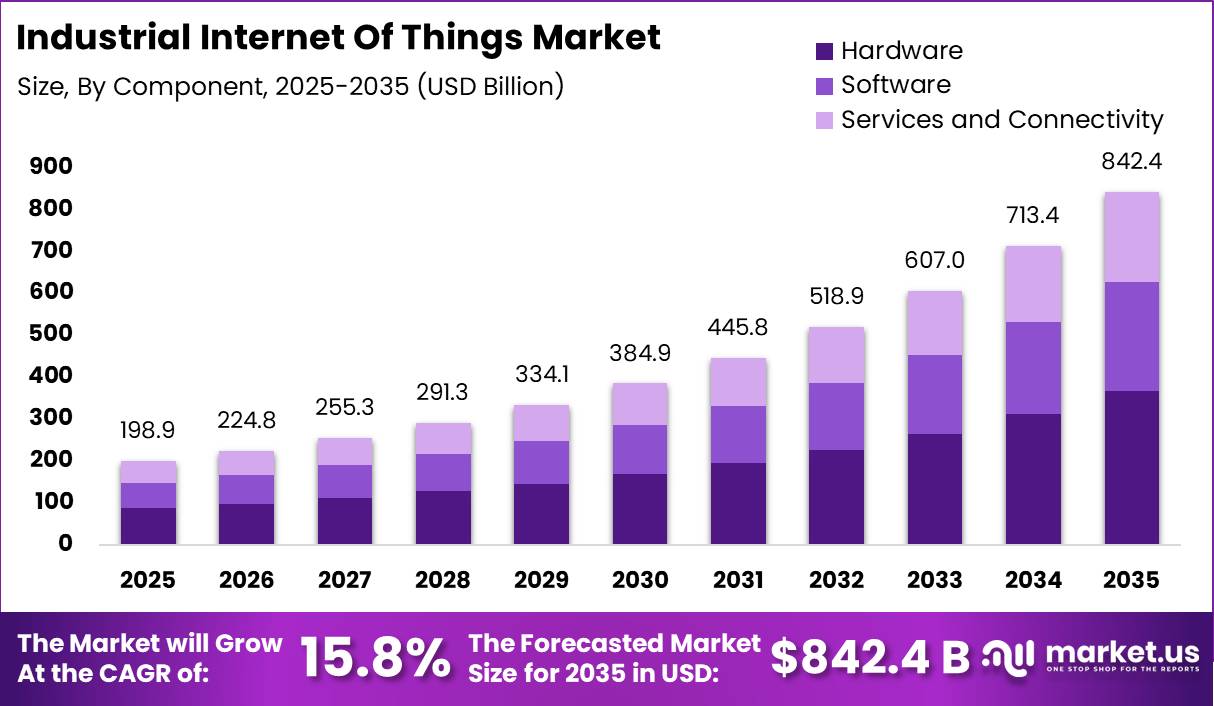
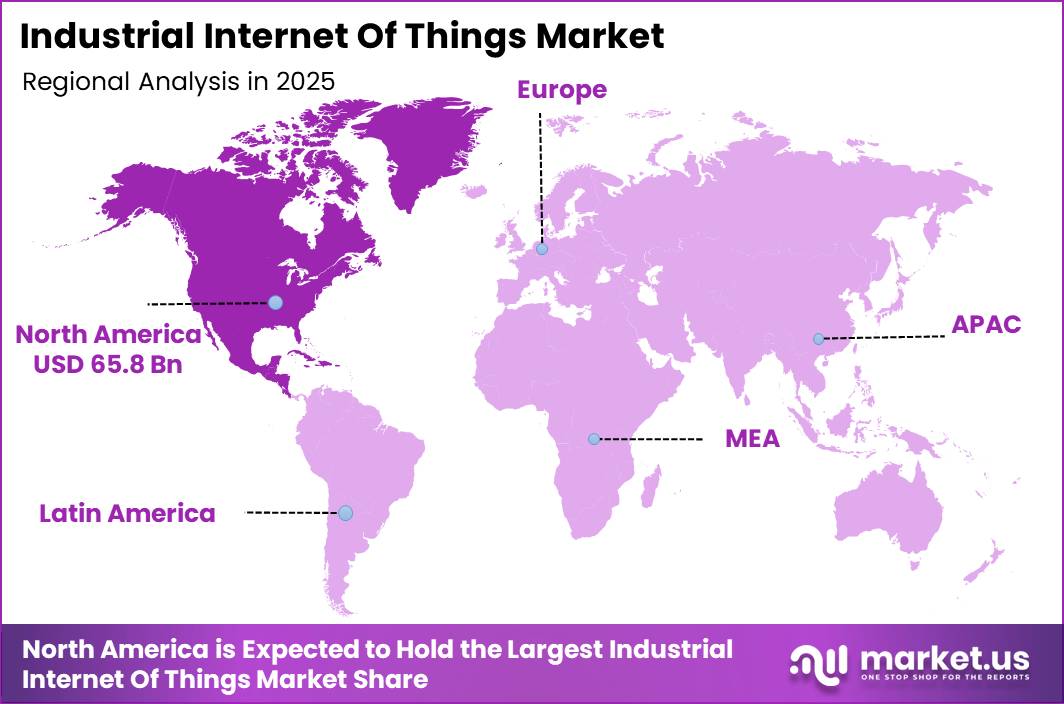
In 2025, the Industrial Internet Of Things (IIoT) Market was valued at USD 198.9 billion. The market is projected to grow at a CAGR of 15.8% during 2026–2035, reaching approximately USD 842.4 billion by 2035. North America dominated the global market in 2025, accounting for more than 33.1% of the total market share and generating approximately USD 65.8 billion in revenue.
Global manufacturing value added exceeded USD 13 trillion during the mid-2020s, while worldwide manufacturing output increased by around 6–7% in 2023. The expansion of industrial production is increasing the number of factories, machines, and production systems that can be connected through IIoT platforms.
Manufacturers are installing sensors, edge devices, and connected equipment to track machine conditions, energy consumption, production speed, and operational performance in real time. North America benefits from high industrial automation and robot adoption. U.S. manufacturing facilities operate approximately 217 industrial robots per 10,000 employees, with nearly 393,700 robots installed across factories.
Automotive, metals, and food and beverage manufacturers in the U.S., Canada, and Mexico continue to install tens of thousands of robots each year. These connected assets require monitoring, integration, cloud analytics, and production-planning systems, creating strong demand for IIoT solutions and supporting the projected 15.8% growth rate through 2035.
Key Takeaway
- The Global IIoT market was valued at USD 198.9 billion in 2025 and is projected to reach USD 842.4 billion by 2035.
- The market is expected to grow at a CAGR of 15.8% between 2026 and 2035.
- The Hardware segment held the largest component share at 43.6%, while software is the fastest-growing component.
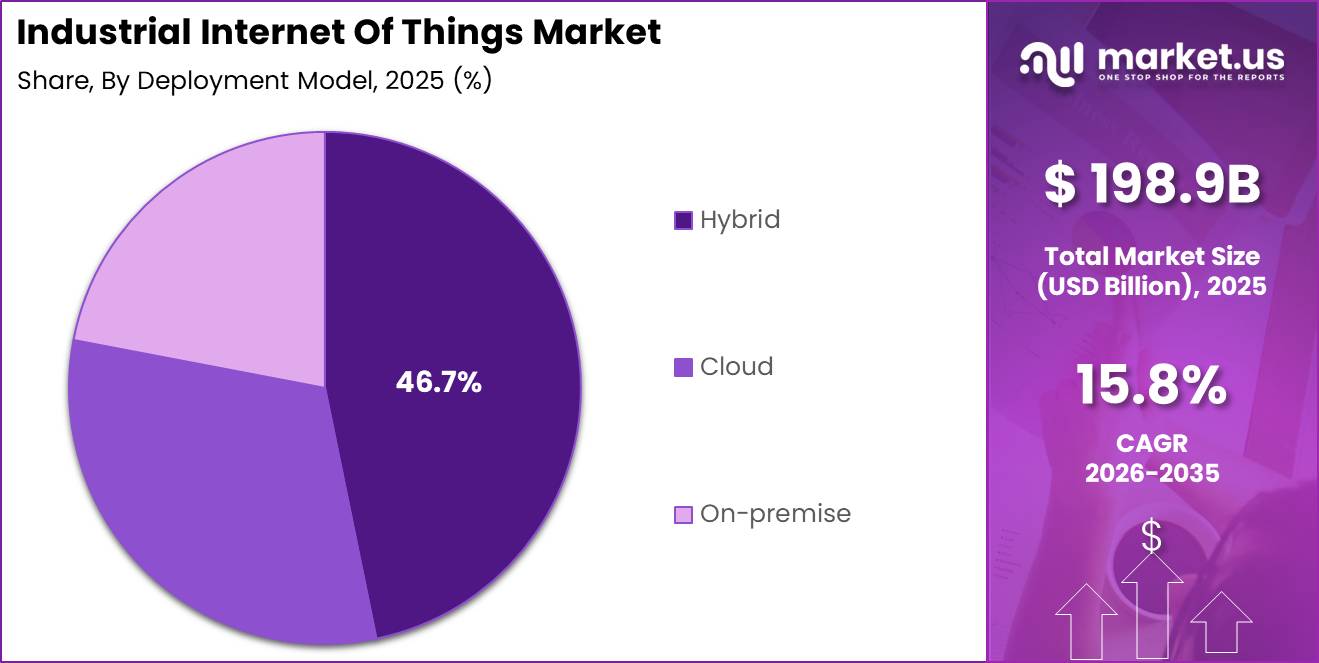
- The Hybrid deployment model led with a 46.7% share, while cloud deployment is the fastest-growing model.
- Cellular connectivity held the largest share at 25.3%, while wired Ethernet is the fastest-growing connectivity segment.
- Manufacturing was the leading end-user segment at 41.4% share, while healthcare is the fastest-growing end user.
- North America led the market with a 33.1% share, generating approximately USD 65.8 billion in 2025.
By Component
The Hardware segment held a dominant 43.6% share of the Industrial Internet of Things market because every connected industrial system first requires physical devices to collect, transmit, and control operational data. Sensors, smart meters, industrial gateways, controllers, communication modules, and embedded chips are installed across machinery, production lines, utilities, and storage systems.
These devices continuously measure temperature, vibration, pressure, energy consumption, equipment speed, and production output. According to the World Bank, digital technologies could help reduce emissions across energy, transportation, and manufacturing by up to 20% by 2050. Achieving this potential requires industries to deploy large numbers of connected meters, monitoring devices, and automated control systems.
By Deployment Model
The Hybrid deployment segment held a dominant 46.7% share of the Industrial Internet of Things market because industrial companies require both secure local control and flexible cloud access. Manufacturing plants, utilities, and transportation facilities depend on on-premise servers and edge gateways for time-sensitive activities, including millisecond-level machine coordination, process monitoring, and emergency shutdowns.
These operations cannot rely entirely on external networks because any delay or connectivity failure may interrupt production or create safety risks. At the same time, cloud platforms allow companies to compare performance across dozens or hundreds of facilities. According to the International Federation of Robotics, global robot density reached 162 units per 10,000 manufacturing employees in 2023, more than double the level recorded seven years earlier.
Cloud deployment is the fastest-growing segment because managing increasing volumes of industrial data only through local infrastructure is expensive and difficult. World Bank research indicates that digital technologies could reduce emissions across manufacturing and energy by up to 20% by 2050. Achieving these gains requires large-scale data analytics, simulation, and energy optimization, which are easier to manage through scalable cloud environments.
By Connectivity Technology
Cellular connectivity technologies, including 4G, LTE-M, and private 5G, held a dominant 25.3% share of the Industrial Internet of Things market because they can connect large numbers of mobile and remote industrial assets. Logistics centers, mines, factories, and transport facilities often operate equipment across wide areas where fixed Ethernet connections are costly or impractical.
According to the International Federation of Robotics, global robot density reached 162 units per 10,000 manufacturing employees in 2023, more than double the level recorded seven years earlier. This expansion has increased the use of connected robots, automated guided vehicles, handheld devices, and yard equipment that require reliable and low-latency communication.
By End User
The Manufacturing segment held a dominant 41.4% share of the Industrial Internet of Things market because factories operate large numbers of machines, production lines, and automated systems that require continuous monitoring. According to UNIDO, manufacturing accounted for nearly 80% of total industrial value added in 2024, while global manufacturing value added increased by approximately 2.9% during the year.
Medium-high and high-technology industries also recorded quarterly production growth of up to 1.6% in 2024. These industries depend heavily on robots, computer numerical control machines, sensors, and automated assembly lines. IIoT systems help manufacturers track equipment condition, production speed, energy consumption, product quality, and machine downtime in real time.
Key Market Segments
By Component
- Hardware
- Software
- Services and Connectivity
By Deployment Model
- Cloud
- On-premise
- Hybrid
By Connectivity Technology
- Wired (Ethernet, PROFINET, Modbus-TCP)
- Short-Range Wireless (BLE, Wi-Fi 6/6E)
- Cellular (4G LTE-M, Private 5G)
- Others
By End User
- Manufacturing
- Energy & Power
- Transportation & Logistics
- Mining
- Oil & Gas
- Healthcare
- Other End-Use Industries
Geopolitical Impact Analysis
Geopolitical tensions are increasing Industrial Internet of Things manufacturing costs by disrupting supplies of semiconductors, communication modules, printed circuit boards, and specialist materials. WTO tariff data indicate that applied duties on electronic equipment and components in several major economies generally range from 5% to 12%.
Recent U.S.–China trade measures have pushed effective tariffs on selected Chinese electronics above 30% and, in some cases, beyond 50% after additional surcharges. IIoT manufacturers that depend on imported chips, radios, and circuit boards may therefore face hardware input-cost increases of 10% to 25%. Companies are responding by raising product prices, changing suppliers, redesigning components, and relocating assembly operations.
Shipping disruptions and energy-price volatility are creating additional pressure across the IIoT value chain. UNCTAD reported that container freight rates on major East–West routes during 2024–2025 remained approximately 30% to 40% above pre-pandemic levels. Security incidents and congestion around important maritime routes also extended some delivery periods by 5 to 10 days.
The IEA projected that European industrial electricity demand would grow by around 2.3% annually between 2024 and 2026, while gas prices in stressed markets could move by more than 50% within 1 year. Higher trade, transport, and energy costs are encouraging IIoT vendors to adopt dual sourcing, near-shoring, and energy-efficient product designs, although these measures may still reduce margins and increase final system prices.
Regional Analysis
North America held the leading position in the Industrial Internet of Things market, accounting for 33.1% of global revenue and reaching an estimated value of USD 65.8 billion in 2025. The region benefits from a well-established base of advanced manufacturing, automotive, aerospace, oil and gas, and utility industries.
These sectors increasingly use connected sensors, industrial controllers, private networks, edge devices, and cloud-based analytics to improve productivity, safety, and equipment performance. High capital spending on automation, strict environmental and workplace safety standards, and the continued rollout of 4G and 5G infrastructure further support IIoT adoption across both existing and newly developed industrial facilities.
Asia-Pacific is expected to be the fastest-growing regional market. Growth is supported by large manufacturing bases in China, Japan, South Korea, India, and Southeast Asia, along with rising investment in smart factories and industrial 5G networks. Expanding electronics, automotive, machinery, and infrastructure production is increasing the number of connected machines and production lines.
Europe represents another major regional market, supported by its mature manufacturing sector and strong focus on industrial efficiency. Companies across discrete manufacturing, chemicals, energy, transportation, and logistics are adopting IIoT solutions for predictive maintenance, asset tracking, process control, and energy management.
Key Regions and Countries
North America
- US
- Canada
Europe
- Germany
- France
- The UK
- Spain
- Italy
- Rest of Europe
Asia Pacific
- China
- Japan
- South Korea
- India
- Australia
- Rest of APAC
Latin America
- Brazil
- Mexico
- Rest of Latin America
Middle East & Africa
- GCC
- South Africa
- Rest of MEA
Market Dynamics
Drivers
| Driver | (~) % CAGR | Geographic Relevance | Impact Timeline |
|---|---|---|---|
| AI & Edge Computing Convergence in Industrial Operations | +4.2% | Global — highest density in North America, Western Europe, East Asia | Short term (≤ 2 years) |
| 5G Private Network Rollout in Manufacturing & Logistics | +2.8% | Global — accelerating in China, South Korea, Germany, United States | Short term (≤ 2 years) |
| Government-Backed Industry 4.0 & Smart Manufacturing Incentives | +2.1% | United States (CHIPS & Science Act), EU (Industry 5.0), India (PLI schemes), China (Made in China 2025 successors) | Medium term (2–4 years) |
| Predictive Maintenance Adoption Reducing Unplanned Downtime | +1.9% | Global — strongest traction in automotive, oil & gas, discrete manufacturing | Short term (≤ 2 years) |
| Expansion of Industrial Edge Computing Infrastructure | +1.5% | Global — North America leads; Asia Pacific fastest-growing | Medium term (2–4 years) |
| Escalating Demand for Real-Time Supply Chain Visibility | +1.2% | Global — concentrated in complex multi-tier manufacturing geographies | Short term (≤ 2 years) |
AI & Edge Computing Convergence in Industrial Operations
The integration of embedded artificial intelligence with edge hardware is transforming Industrial IoT from a basic data-collection system into an autonomous decision-making platform. This shift is moving vendor business models away from one-time hardware sales toward recurring software and analytics subscriptions, which can generate gross margins of 60% to 75%, compared with 25% to 35% for traditional hardware-focused deployments.
By the end of 2025, around 21.1 billion active IoT endpoints were operating globally, representing 14% year-on-year growth. Industrial IoT accounted for nearly 30% of edge-computing workloads by deployment volume. The development of sub-10–millisecond edge-inference hardware during 2024–2025 also enabled OPC UA and MQTT systems to make control decisions without sending data to the cloud, reducing operating latency by approximately 40% to 60%.
Process manufacturers expect digital and AI initiatives to lower annual plant operating costs by about 12% within 3 years. AI-enabled edge deployments can also reduce unplanned downtime by 30% to 50%, lower maintenance capital expenditure by 25% to 30%, and shorten investment payback periods to less than 18 months. These benefits are expanding IIoT adoption beyond large manufacturers to mid-sized industrial companies.
Restraints
| Restraint | (~) % CAGR | Geographic Relevance | Impact Timeline |
|---|---|---|---|
| Mandatory OT Cybersecurity Compliance Freezing Deployment CapEx | -2.8% | Global — most acute in EU (NIS2 Directive), United States (CISA mandates), critical infrastructure operators worldwide | Short term (≤ 2 years) |
| High Upfront Implementation Cost & Uncertain Short-Term ROI | -2.1% | Global — disproportionately restraining SMEs in South & Southeast Asia, Latin America | Short term (≤ 2 years) |
| Semiconductor & Specialized Sensor Component Shortages | -1.6% | Global — concentrated in advanced logic and memory nodes; North America, Europe, Japan most exposed to geopolitical supply risk | Medium term (2–4 years) |
| Data Sovereignty & Cross-Border Data Flow Restrictions | -1.2% | EU (GDPR, Data Act), China (PIPL, MLPS), India (DPDP Act) — suppressing multi-national IIoT cloud deployments | Medium term (2–4 years) |
| Absence of Unified Global IIoT Interoperability Standards | -0.9% | Global — fragmentation highest in heterogeneous multi-vendor brownfield plant environments | Long term (≥ 4 years) |
Mandatory OT Cybersecurity Compliance Freezing Deployment CapEx
Industrial cybersecurity has shifted from voluntary guidance to mandatory compliance, creating a major barrier to near-term Industrial IoT investment. The EU NIS2 Directive became effective in October 2024, while U.S. authorities continued advancing sector-specific operational technology security requirements during 2025. These rules require operators in energy, water, manufacturing, and digital infrastructure to strengthen network security before expanding connected-device deployments.
For a mid-sized brownfield plant, achieving IEC 62443 Security Level 2 compliance may require a multi-year program covering asset inventories, network segmentation, access controls, and continuous monitoring. Initial compliance spending can represent approximately 3% to 7% of a facility’s annual IT and operational technology budget, reducing the funds available for new IIoT projects.
PwC’s 2026 Digital Trends in Operations Survey found that 33% of respondents faced scaling barriers linked to data access and legacy-system integration. As a result, many companies are delaying rather than cancelling IIoT investments. Procurement cycles may extend by 12 to 24 months while legal, cybersecurity, IT, and operations teams complete compliance reviews and system upgrades.
Challenges
| Challenge | (~) % CAGR | Geographic Relevance | Mitigation Horizon |
|---|---|---|---|
| OT/IT Convergence Skills Deficit | -2.4% | Global — most severe in United States, Germany, Japan; emerging in India & Southeast Asia as IIoT adoption accelerates | Long term (≥ 4 years) |
| Legacy System Integration Friction | -1.8% | Global — highest drag in brownfield heavy industry: steel, chemicals, power generation, older automotive plants | Medium term (2–4 years) |
| Multi-Vendor Data Interoperability Complexity | -1.4% | Global — amplified in Asia Pacific and Latin America where heterogeneous vendor ecosystems dominate plant floors | Long term (≥ 4 years) |
| IIoT Pilot-to-Scale Deployment Gap | -1.1% | Global — most pronounced among mid-market enterprises lacking dedicated digital transformation governance structures | Medium term (2–4 years) |
| Edge Hardware Lifecycle & E-Waste Management | -0.7% | EU (WEEE Directive, Ecodesign Regulation), emerging regulatory pressure in North America & South Asia | Long term (≥ 4 years) |
OT/IT Convergence Skills Deficit
The Industrial IoT market faces a major workforce shortage because large-scale deployments require both operational technology and information technology skills. Professionals must understand instrumentation, SCADA systems, PLC programming, industrial controls, cloud platforms, data engineering, artificial intelligence, and cybersecurity.
Around 2 million advanced manufacturing and smart-factory jobs in the United States could remain unfilled by 2033. In addition, approximately 40% of advanced manufacturers identify skill shortages as a direct barrier to faster IIoT adoption. The problem is particularly serious among small and medium-sized companies, which continue to adopt AI and digital technologies more slowly than large enterprises.
Limited access to skilled engineers also extends IIoT integration projects from an expected 6–9 months to approximately 18–30 months. These delays can increase total ownership costs by 20%–40% and cause companies to postpone later deployment phases that generate higher software and analytics revenue. Manufacturers are responding through AI support tools.
Opportunities
| Opportunity | (~) % CAGR | Geographic Relevance | Execution Window |
|---|---|---|---|
| Digital Twin-Enabled Asset Lifecycle Monetization | +3.1% | Global — highest white space in process industries (chemicals, oil & gas, utilities) and heavy discrete manufacturing in North America, Europe, China | Medium term (2–4 years) |
| IIoT-Driven Industrial Decarbonization & ESG Compliance Platforms | +2.4% | Global — regulatory urgency highest in EU (CSRD, Carbon Border Adjustment Mechanism), accelerating in United States, Japan, India | Medium term (2–4 years) |
| SME IIoT Adoption via As-a-Service & Modular Deployment Models | +2.0% | Global — largest untapped pool in South & Southeast Asia, Latin America, Eastern Europe; India particularly high-potential given PLI-driven manufacturing expansion | Medium term (2–4 years) |
| IIoT-Enabled Autonomous Mobile Robotics Integration | +1.6% | Global — greenfield facilities in China, United States, Germany; retrofit opportunity in South Korea, Japan automotive & electronics plants | Long term (≥ 4 years) |
| Cross-Industry IIoT Data Marketplace & Federated Analytics | +1.2% | Global — early formation stage; regulatory enablement strongest in EU (Data Act 2025 implementation) and progressive Asia Pacific jurisdictions | Long term (≥ 4 years) |
| IIoT for Remote Asset Management in Extractive & Energy Sectors | +1.0% | Middle East, Sub-Saharan Africa, Central Asia, offshore energy globally — geographies with high asset dispersion and limited on-site workforce density | Short term (≤ 2 years) |
Digital Twin-Enabled Asset Lifecycle Monetization
Digital twin technology represents a major future opportunity for the Industrial IoT market because its full commercial value remains largely untapped. Most current deployments rely on one-time project and integration fees, while the larger opportunity lies in recurring revenue from virtual commissioning, asset-performance guarantees, predictive analytics, and real-time data services.
A 2026 industry survey found that only 31% of process manufacturers were exploring edge computing and digital twins, meaning nearly 7 in 10 had not started deployment. The financial benefits could be substantial. Traditional project services generally generate gross margins of around 20%–30%, while subscription- and data-based digital twin models may deliver margins of 65%–80%.
AI-supported asset-life optimization can help companies defer replacement expenditure by 15%–25% and reduce maintenance costs by approximately 25%–30% for each asset class. Predictive maintenance applications may also lower unplanned downtime by 35%–45% and reduce energy consumption per production cycle by 15%–20%.
Key Players Analysis
Tier-1 companies in the Industrial Internet of Things market include major automation, cloud, networking, and semiconductor providers with multibillion-dollar industrial portfolios. ABB generated approximately USD 30 billion in FY2025 revenue, with nearly 35%, or USD 10.5 billion, linked to industrial automation and about 15%, or USD 4.5 billion, from robotics and discrete automation. Siemens reported around EUR 79 billion, or approximately USD 85 billion, in FY2025 revenue.
Its Digital Industries and Smart Infrastructure businesses together contributed more than EUR 30 billion. Digital Industries software annual recurring revenue increased from EUR 3.7 billion in Q3 FY2023 to EUR 4.9 billion in Q3 FY2025, including EUR 2.1 billion from cloud services. Together, Tier-1 suppliers are estimated to influence around 50% to 60% of global IIoT platform, control, hardware, and service spending.
Tier-2 participants, including Arm, IBM, and Microsoft, mainly compete through processors, middleware, analytics, and cloud platforms. Arm recorded USD 4.0 billion in revenue for the year ended March 31, 2025. IoT and embedded products represented about 18% of royalty revenue, while automotive and robotics contributed another 7%.
In Q3 FY2025, Microsoft’s Intelligent Cloud revenue increased by USD 4.6 billion, Azure and other cloud services grew 22%, and Azure alone expanded by 33%. Cisco’s FY2025 revenue rose 5%, including 6% growth in products and 3% in services. Leading vendors generally invest around 4% to 6% of annual revenue, often USD 1 billion to USD 2 billion, in research and development.
Top Key Players in the Market
- ABB Ltd.
- ARM Holding Plc
- Atmel Corporation
- Cisco Systems, Inc.
- General Electric Company (GE)
- Honeywell International Inc.
- Intel Corporation
- International Business Machines (IBM) Corporation
- Microsoft Corporation
- Rockwell Automation, Inc.
- Schneider Electric SE
- Siemens AG
Recent Developments
- In March 2025, Schneider Electric announced an investment of more than USD 700 million to expand its U.S. manufacturing operations through 2027. The program supports rising demand for automation, digitalization, data centers, and energy infrastructure, strengthening the company’s ability to supply connected electrical equipment and industrial control technologies used in IIoT systems.
- In July 2025, Intel Corporation confirmed a target of USD 18 billion in gross capital expenditure for 2025. The investment focused on improving semiconductor manufacturing efficiency and expanding advanced processor capacity. This supports the IIoT sector by strengthening the supply of processors and connectivity chips required in industrial gateways, edge servers, controllers, and smart machinery.
- In April 2025, Microsoft reported Intelligent Cloud revenue of USD 26.8 billion for the third quarter of FY2025, representing growth of 21%. Server products and cloud services revenue increased by 22%, while Azure and other cloud services expanded by 33%. The growth highlights increasing demand for scalable cloud, analytics, and edge-to-cloud platforms supporting connected industrial operations.
Report Scope
| Report Features | Description |
|---|---|
| Market Value (2025) | USD 198.9 Billion |
| Forecast Revenue (2035) | USD 842.4 Billion |
| CAGR (2026-2035) | 15.8% |
| Base Year for Estimation | 2025 |
| Historic Period | 2020-2024 |
| Forecast Period | 2026-2035 |
| Report Coverage | Revenue Forecast, Market Dynamics, Competitive Landscape, Recent Developments |
| Segments Covered | By Component (Hardware, Software, Services and Connectivity), By Deployment Model (Cloud, On-premise, Hybrid), By Connectivity Technology (Wired [Ethernet, PROFINET, Modbus-TCP], Short-Range Wireless [BLE, Wi-Fi 6/6E], Cellular [4G LTE-M, Private 5G], Others), By End User (Manufacturing, Energy and Power, Transportation and Logistics, Mining, Oil and Gas, Healthcare, Others) |
| Regional Analysis | North America – US, Canada; Europe – Germany, France, The UK, Spain, Italy, Rest of Europe; Asia Pacific – China, Japan, South Korea, India, Australia, Singapore, Rest of APAC; Latin America – Brazil, Mexico, Rest of Latin America; Middle East & Africa – GCC, South Africa, Rest of MEA |
| Competitive Landscape | ABB Ltd., ARM Holding Plc, Atmel Corporation, Cisco Systems, Inc., General Electric Company (GE), Honeywell International Inc., Intel Corporation, International Business Machines (IBM) Corporation, Microsoft Corporation, Rockwell Automation, Inc., Schneider Electric SE, Siemens AG |
| Customization Scope | Customization for segments and region/country-level will be provided. Moreover, additional customization can be done based on the requirements. |
| Purchase Options | We have three licenses to opt for: Single User License, Multi-User License (Up to 5 Users), Corporate Use License (Unlimited Users and Printable PDF) |





























