


Report Overview
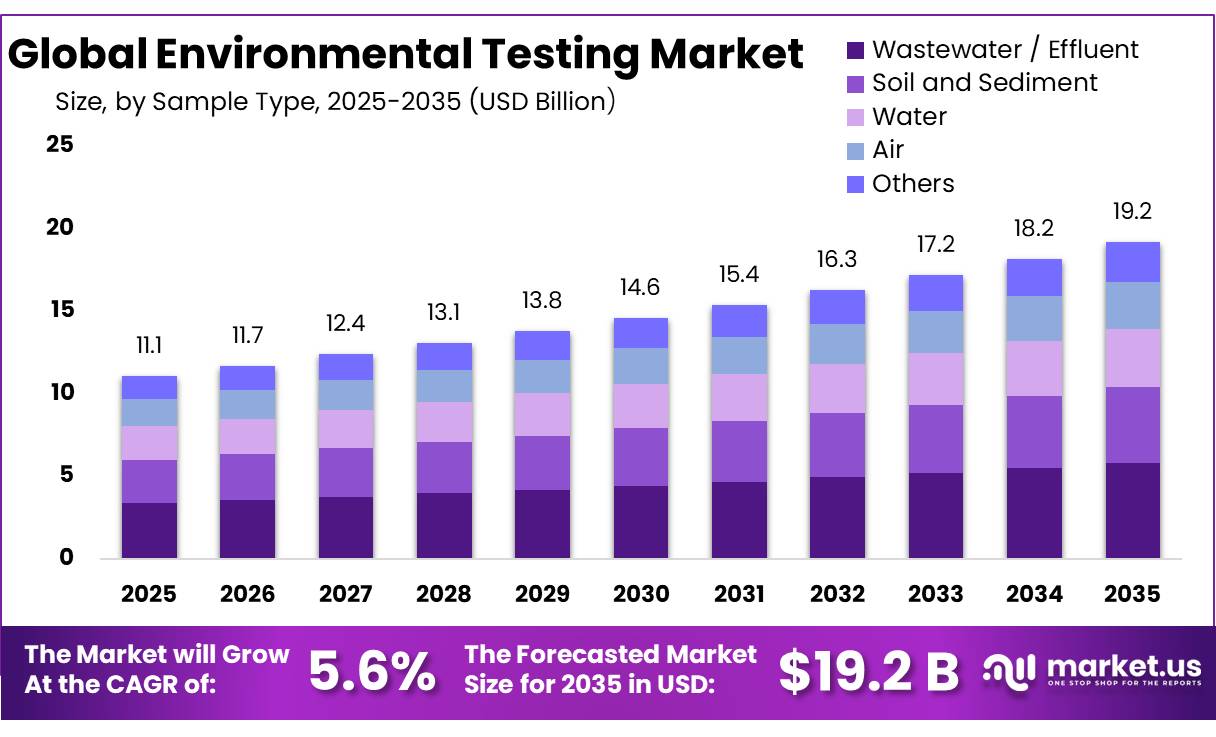
The Global Environmental Testing Market size is expected to be worth around USD 19.2 Billion by 2035, from USD 11.1 Billion in 2025, growing at a CAGR of 5.6% during the forecast period from 2026 to 2035. In 2025, North America held a dominant market position, capturing more than a 34.60% share, holding USD 3.8 Billion revenue.
Environmental testing has become an essential part of environmental protection, public health management, industrial compliance, and pollution control. The industry covers laboratory and field testing of water, wastewater, soil, air, sediments, chemicals, hazardous substances, and industrial emissions. Demand is strengthening as governments introduce tighter limits for emerging contaminants and industries require more accurate analytical data.
- The World Health Organization reported that 2.2 billion people, equal to 27% of the global population, lacked safely managed drinking water services in 2022, demonstrating the continuing need for water-quality monitoring and contamination testing.
The industrial scenario is increasingly shaped by chemical contamination and stricter environmental standards. According to UNEP, around 40,000–60,000 industrial chemicals are estimated to be in global commerce, while about 6,000 chemicals account for more than 99% of total chemical volumes traded. This large chemical base creates continuous requirements for identification, toxicity assessment, environmental sampling, trace-level detection, and compliance testing across manufacturing, utilities, agriculture, waste management, and chemical-processing operations.
- Water-quality concerns remain a major industry driver. The European Environment Agency reported that only 37% of European surface-water bodies achieved good or high ecological status in 2021, while only 29% achieved good chemical status. Groundwater performed better, with 77% of groundwater-body area achieving good chemical status and 91% achieving good quantitative status. These conditions support continued laboratory demand for pesticides, nutrients, metals, persistent chemicals, organic contaminants, and other regulated parameters.
Emerging contaminants are creating another important testing requirement. The U.S. Environmental Protection Agency’s UCMR 5 programme required drinking-water monitoring for 29 PFAS compounds plus lithium between 2023 and 2025. Its monitoring design covered all qualifying systems serving at least 3,300 people, together with a representative sample of 800 smaller water systems. The final UCMR 5 dataset was released in August 2026, supporting wider regulatory and analytical attention toward very-low-concentration contaminants.
Infrastructure spending also supports testing activity. The U.S. EPA estimates that public drinking-water systems require approximately USD 625 billion of capital investment over 20 years, representing a 32% increase compared with its previous infrastructure-needs assessment. As utilities replace pipelines, modernize treatment facilities, improve storage systems, and address contamination, environmental laboratories are expected to remain important for baseline testing, treatment verification, regulatory monitoring, and post-project water-quality assessment.
Soil monitoring is also becoming more structured. The European Commission states that 60–70% of EU soils are currently considered unhealthy. The EU Soil Monitoring Law entered into force on 16 December 2025, creating a stronger framework for evaluating soil condition, contamination, degradation, and restoration needs. Such regulation is expected to increase requirements for standardized sampling, metals analysis, pesticide-residue testing, organic-contaminant screening, and long-term soil-health monitoring.
Future growth opportunities are therefore moving toward PFAS analysis, persistent organic pollutants, mercury monitoring, microplastics, advanced chromatography, mass spectrometry, automated sampling, digital laboratory systems, and real-time environmental sensors. In June 2026, UNEP and the Global Environment Facility launched a USD 23.5 million Global Chemicals Monitoring Programme covering five regional projects to strengthen monitoring of persistent organic pollutants and mercury. Such programmes indicate that environmental testing is evolving from conventional compliance testing toward broader, data-intensive monitoring of emerging pollutants and long-term environmental risks.
Key Takeaways
- Environmental Testing Market size is expected to be worth around USD 19.2 Billion by 2035, from USD 11.1 Billion in 2025, growing at a CAGR of 5.6%.
- Wastewater / Effluent held a dominant market position, capturing more than a 30.30% share.
- Chemical held a dominant market position, capturing more than a 24.80% share.
- Rapid Testing held a dominant market position, capturing more than a 57.20% share.
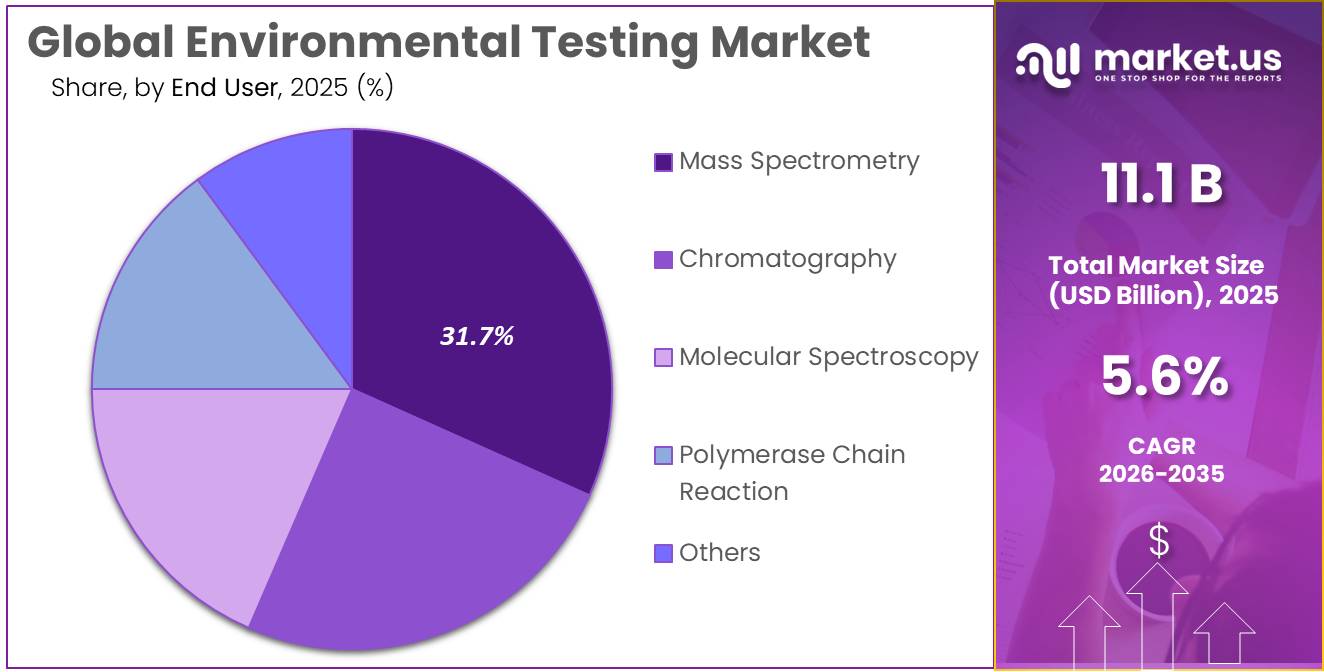
- Mass Spectrometry held a dominant market position, capturing more than a 31.00% share.
- Government and Regulatory Agencies held a dominant market position, capturing more than a 26.67% share.
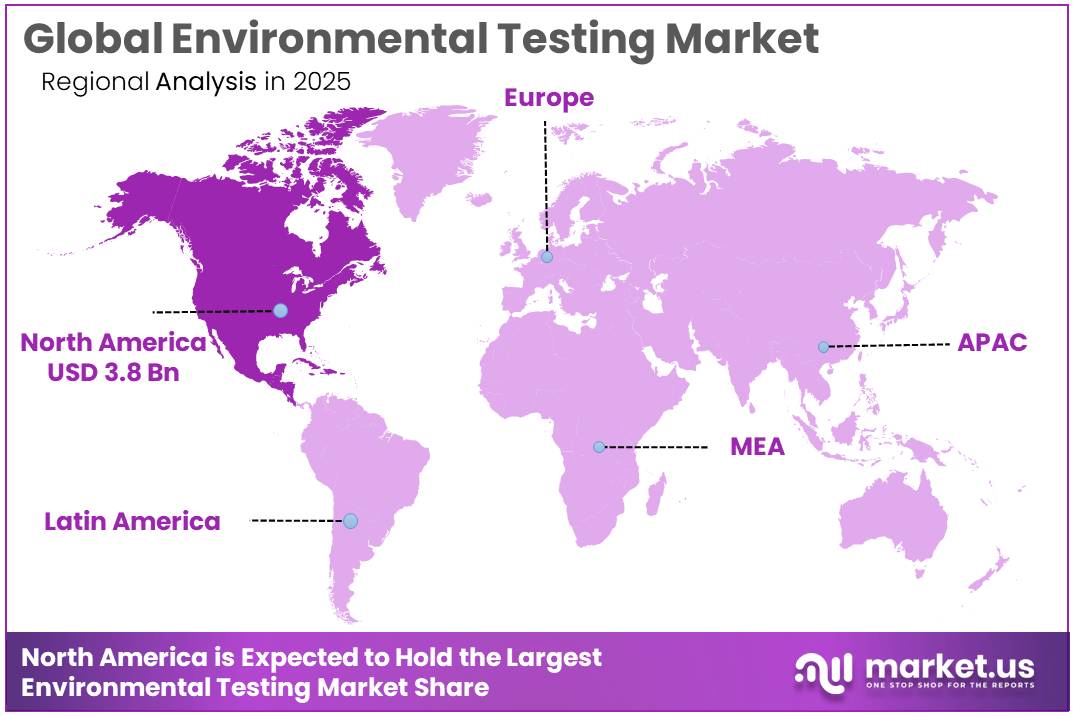
- North America held a dominant Environmental Testing Market position, capturing more than a 34.60% share and generating USD 3.8 billion.
By Sample Type Analysis
Wastewater / Effluent leads the Environmental Testing Market with more than a 30.30% share, supported by tighter discharge controls and rising treatment investment.
In 2025, “Wastewater / Effluent” held a dominant market position, capturing more than a 30.30% share in the Environmental Testing Market. The segment remained important because municipal utilities, chemical plants, manufacturing sites, and other industrial facilities regularly test effluent for nutrients, metals, organic pollutants, microorganisms, PFAS, and other contaminants before discharge. Regulatory monitoring is also becoming stricter as authorities expand testing requirements for emerging pollutants.
Government investment data further supports the strong testing requirement. According to Eurostat, in 2025 wastewater-treatment projects accounted for 37.7% of total EU environmental-protection investment, making wastewater the largest investment area. EU countries invested about €79 billion in environmental-protection assets during the year.
Soil and Sediment represents an important sample type within the Environmental Testing Market as regulators, industrial operators, land developers, agricultural authorities, and remediation specialists increasingly examine soil for heavy metals, pesticides, petroleum compounds, persistent chemicals, nutrients, and other contaminants.
Government policy strengthened this testing environment during 2025. The European Commission reported that 60–70% of EU soils are currently in an unhealthy state, highlighting the scale of degradation and contamination concerns. Soil degradation is also estimated to cost the EU more than €50 billion each year.
By Target Tested Analysis
Chemical testing leads the Environmental Testing Market with more than a 24.80% share, supported by tighter contaminant limits and wider monitoring of PFAS and other pollutants.
In 2025, “Chemical” held a dominant market position, capturing more than a 24.80% share in the Environmental Testing Market. Chemical testing remained widely used because environmental laboratories routinely measure metals, nutrients, pesticides, PFAS, volatile compounds, organic pollutants, and other chemical contaminants in drinking water, wastewater, soil, sediment, and industrial samples.
Government activity in 2025 further strengthened chemical testing requirements. The U.S. EPA continued nationwide monitoring under UCMR 5, which required public water systems to test drinking water for 29 PFAS compounds and lithium between 2023 and 2025. EPA analytical methods can measure 29 PFAS in drinking water, while Method 1633 can determine 40 PFAS compounds across wastewater, groundwater, soil, sediment, biosolids, and tissue samples.
Biological testing represents an important target category in the Environmental Testing Market, covering bacteria, viruses, protozoa, microbial indicators, and other biological contaminants found in water, wastewater, recreational water, and environmental samples. Testing is increasingly used by public-health agencies, wastewater utilities, food-production facilities, and environmental regulators because biological contamination can change rapidly and requires frequent monitoring.
Government surveillance programmes provide clear evidence of this expanding requirement. As of September 2026, the U.S. Centers for Disease Control and Prevention reported 1,258 wastewater monitoring sites contributing data to its National Wastewater Surveillance System. These sites covered an estimated 152 million people, or around 45% of the U.S. population.
By Technology Analysis
Rapid Testing leads the Environmental Testing Market with more than a 57.20% share, supported by faster contaminant detection and growing use of real-time monitoring tools.
In 2025, “Rapid Testing” held a dominant market position, capturing more than a 57.20% share in the Environmental Testing Market. Rapid testing remained widely preferred because laboratories, water utilities, environmental agencies, and industrial facilities increasingly require faster identification of contaminants and quicker decisions on water quality, wastewater discharge, and pollution events. Technologies such as portable sensors, molecular testing, automated analyzers, biosensors, and online monitoring systems help reduce the time between sampling and corrective action.
Government initiatives continued to encourage newer analytical technologies during 2025. On January 16, 2025, the U.S. Environmental Protection Agency approved 2 additional alternative testing methods for drinking-water compliance under its expedited approval process. The programme is designed to provide laboratories and public water systems with faster access to new measurement techniques while maintaining regulatory performance requirements. This supports wider adoption of advanced and quicker analytical approaches within environmental testing.
Conventional Testing continues to hold an important position in the Environmental Testing Market, particularly for regulatory compliance, confirmatory analysis, and complex contaminant identification. Established laboratory techniques such as membrane filtration, culture methods, chromatography, spectroscopy, gravimetric analysis, and wet chemistry remain widely used because they provide standardized and legally recognized results for wastewater, drinking water, soil, sediment, and biosolids.
In 2026, the U.S. EPA continued to maintain approved Clean Water Act methods under 40 CFR Part 136 for compliance testing. Its microbiological framework includes 5 listed methods for wastewater and sewage sludge—Methods 1600.1, 1603.1, 1680, 1681, and 1682—covering organisms such as enterococci, E. coli, fecal coliforms, and Salmonella. For ambient water, the EPA lists 7 microbiological methods, including Methods 1103.2, 1106.2, 1600.1, 1603.1, 1604, 1622, and 1623.
By Rapid Testing Method Analysis
Mass Spectrometry leads the Environmental Testing Market with more than a 31.00% share, supported by highly sensitive detection of PFAS and other trace contaminants.
In 2025, “Mass Spectrometry” held a dominant market position, capturing more than a 31.00% share in the Environmental Testing Market. The method remained important because environmental laboratories require highly sensitive identification and quantification of contaminants present at very low concentrations. Mass spectrometry is widely combined with liquid chromatography for testing PFAS, pesticides, pharmaceuticals, organic pollutants, and other emerging contaminants in water, wastewater, soil, sediment, biosolids, and tissue samples.
Government analytical programmes continued to strengthen its role. The U.S. EPA’s Method 1633A uses liquid chromatography-tandem mass spectrometry, or LC-MS/MS, to determine 40 PFAS compounds across wastewater, surface water, groundwater, soil, biosolids, sediment, landfill leachate, and fish tissue. EPA states that the method was validated across 10 laboratories, 15 challenging aqueous matrices, 9 solid matrices, and 3 aquatic tissue matrices, showing its suitability for complex environmental testing applications.
Chromatography holds an important position in the Environmental Testing Market because it separates complex chemical mixtures before contaminants are identified and measured. Liquid chromatography, gas chromatography, and ion chromatography are widely applied to PFAS, pesticides, volatile and semi-volatile organic compounds, pharmaceuticals, fluorinated chemicals, and other environmental pollutants.
In 2025 and 2026, U.S. EPA analytical frameworks continued to demonstrate the importance of chromatography. EPA Method 1633A combines liquid chromatography with tandem mass spectrometry to measure 40 PFAS compounds across multiple environmental matrices. EPA Method 1621 uses combustion ion chromatography to determine adsorbable organic fluorine in wastewater, while Method 8327 uses LC-MS/MS for 24 PFAS compounds in groundwater, surface water, and wastewater.
By End User Analysis
Government and Regulatory Agencies lead with more than a 26.67% share as environmental rules expand monitoring of drinking water and emerging contaminants.
In 2025, “Government and Regulatory Agencies” held a dominant market position, capturing more than a 26.67% share in the Environmental Testing Market. Government bodies remain major users of environmental testing because they routinely monitor drinking water, wastewater, soil, air, industrial discharges, and emerging pollutants to enforce environmental and public-health standards. Regulatory programmes also generate continuous demand for validated sampling, laboratory analysis, and reporting.
A major example is the U.S. EPA’s Fifth Unregulated Contaminant Monitoring Rule. Its 2023–2025 monitoring programme covered 29 PFAS compounds plus lithium and was designed to include 10,311 public water systems. This included 4,364 large systems, 5,147 systems serving 3,300–10,000 people, and a nationally representative sample of 800 smaller systems. During 2026, EPA’s programme moved into post-sampling activities, including completion of laboratory reporting and integration of monitoring results into the national database. Such large regulatory programmes support continued demand for environmental sampling, PFAS testing, chemical analysis, and compliance services.
Testing Laboratories represent an important end-user segment in the Environmental Testing Market because government agencies, utilities, industrial facilities, and environmental consultants depend on laboratories to identify pollutants at very low concentrations. These facilities perform PFAS analysis, metals testing, microbiological examination, chromatography, mass spectrometry, and other regulated procedures across drinking water, wastewater, soil, sediment, and environmental samples.
The scale of government monitoring highlights the laboratory requirement. Under the U.S. EPA’s UCMR 5 programme, 61 laboratories received approval for one or more approved analytical methods. Of these, 38 laboratories were approved for all three methods, while 49 were approved for EPA Method 533, 52 for Method 537.1, and 49 for Method 200.7. EPA also contracted 6 laboratories specifically to analyze samples from smaller public water systems. Laboratory results were required to be submitted electronically as part of the monitoring programme, which ran through 2025, followed by post-sampling and data-completion work during 2026.
Key Market Segments
By Sample Type
- Wastewater / Effluent
- Soil and Sediment
- Water
- Air
- Others
By Target Tested
- Chemical
- Biological
- Temperature
- Moisture
- Noise
- Others
By Technology
- Conventional Testing
- Rapid Testing
By Rapid Testing Method
- Chromatography
- Mass Spectrometry
- Molecular Spectroscopy
- Polymerase Chain Reaction (PCR)
- Others
By End User
- Government and Regulatory Agencies
- Testing Laboratories
- Energy and Utilities
- Agriculture and Irrigation
- Research and Academic Institutes
- Others
Driver Analysis
PFAS Water Surveillance
PFAS surveillance is the strongest 2026 demand catalyst because its analytical requirements extend beyond a single compliance test into multi-year sampling, confirmatory analysis, public reporting, treatment verification, source attribution, and post-remediation monitoring across drinking-water systems, industrial dischargers, landfills, airports, military sites, biosolids programmes, and groundwater networks. In the United States, public water systems must complete initial monitoring for regulated PFAS by 2027 and begin public disclosure of results in the same year; systems exceeding applicable limits must implement corrective action by 2029, although EPA’s 2026 proposal allows certain PFOA/PFOS systems to seek a two-year extension to 2031 while preserving monitoring and reporting obligations.
The regulated limits are extremely low—4 parts per trillion for PFOA and PFOS—so conventional field-screening is insufficient and laboratories require high-sensitivity LC-MS/MS workflows, contamination-controlled consumables, isotope-labelled standards, clean-room practices, repeat sampling, blank correction, and confirmation protocols; a single public water system can generate 10–100 samples annually once raw water, entry points, distribution zones, treatment trains, seasonal events, and suspected sources are included. EU testing demand accelerated on January 12, 2026, when Member States began harmonized PFAS monitoring under the recast Drinking Water Directive, with limits of 0.5 micrograms per litre for PFAS Total and 0.1 micrograms per litre for the Sum of 20 PFAS.
The business model shifts from occasional chemistry testing to recurring compliance subscriptions that bundle sampling plans, chain-of-custody, accredited analysis, automated exceedance alerts, dashboards, regulatory reporting, treatment-effectiveness testing, and litigation-grade data retention; at USD 250–800 per targeted PFAS sample, a 50-site utility or industrial programme can create USD 0.1–1.0 million of annual analytical spend before consulting, remediation, and forensic work.
Capacity constraints reinforce pricing power because high-sensitivity PFAS methods require validated equipment, specialist analysts, contamination-free laboratory environments, and turnaround times often ranging from 5–15 business days. This driver is estimated to add +2.3 percentage points to environmental-testing CAGR through 2026–2028 across North America, Europe, Australia, Japan, and other jurisdictions adopting PFAS limits.
Drivers Impact Analysis
| Driver | (\~) % Impact on CAGR | Geographic Relevance | Impact Timeline |
|---|---|---|---|
| PFAS water surveillance | +2.3 pp | North America, EU, Australia, Japan | Short term (≤ 2 years) |
| Industrial-emissions monitoring | +1.8 pp | EU, China, North America, India | Medium term (2–4 years) |
| Lead-pipe compliance testing | +1.4 pp | U.S. core, Canada spill-over | Medium term (2–4 years) |
| Digital field-testing adoption | +1.3 pp | North America, EU, China, APAC | Medium term (2–4 years) |
| Climate-risk water monitoring | +1.1 pp | MENA, India, Africa, Australia, LATAM | Long term (≥ 4 years) |
| Chemical-risk assessment | +0.9 pp | U.S., EU, Japan, South Korea | Medium term (2–4 years) |
Restraint Analysis
Accredited-Lab Capacity Gap
EPA’s PFAS drinking-water rules require laboratories supporting compliance monitoring to be certified, while EPA Methods 533 and 537.1 measure 29 PFAS and are approved for UCMR 5 and PFAS National Primary Drinking Water Regulation monitoring. EU laboratories face comparable scale-up requirements after harmonized PFAS drinking-water monitoring began on 12 January 2026, using parameters of 0.5 micrograms per litre for PFAS Total and 0.1 micrograms per litre for the Sum of 20 PFAS.
A single high-throughput LC-MS/MS platform can cost approximately USD 0.4–1.2 million before sample-preparation automation, clean-room upgrades, isotope-labelled standards, service contracts, laboratory-information-system integration, and annual proficiency testing; a new accredited workflow can require 6–18 months of method validation, analyst training, audits, and state or national certification. Capacity bottlenecks increase turnaround times from a normal 5–10 business days to 15–30 days during regional monitoring surges, delaying treatment decisions, permit submissions, construction work, litigation support, and public disclosure; for a water system sampling 100–500 locations, a 20-day delay can defer a USD 1–10 million remediation or treatment procurement cycle by an entire budget quarter.
The margin effect is mixed: laboratories can charge premium pricing, but overtime, reruns, sample subcontracting, instrument downtime, and analyst-retention costs can consume 10–25% of incremental revenue, while smaller laboratories are excluded from regulated work entirely. Operators must invest in multi-instrument redundancy, analyst pipelines, satellite preparation labs, shared capacity networks, automated extraction, and accreditation expansion, but the lead time creates an estimated -2.0-percentage-point short-term drag on environmental-testing CAGR across North America, Europe, Japan, South Korea, Australia, and other mature regulatory markets.
Restraint Impact Analysis
| Restraint | (\~) % Impact on CAGR | Geographic Relevance | Impact Timeline |
|---|---|---|---|
| Accredited-lab capacity gap | -2.0 pp | North America, EU, developed APAC | Short term (≤ 2 years) |
| Regulatory deadline uncertainty | -1.6 pp | U.S. core, EU, Canada, Australia | Short term (≤ 2 years) |
| High analytical cost burden | -1.4 pp | Small utilities, SMEs, emerging markets | Medium term (2–4 years) |
| Sampling contamination risk | -1.2 pp | PFAS-intensive markets, global labs | Medium term (2–4 years) |
| Fragmented method standards | -1.0 pp | Cross-border trade corridors, EU, U.S., APAC | Medium term (2–4 years) |
| Public-budget procurement delays | -0.8 pp | North America, EU, India, LATAM, Africa | Short term (≤ 2 years) |
Opportunity Analysis
Testing-as-a-Service Platforms
Testing-as-a-service is an untapped monetization opportunity because the environmental-testing industry still prices mainly by sample and analyte, while customers increasingly need an ongoing outcome—continuous compliance visibility—combining sampling calendars, field logistics, sensors, accredited confirmation, chain of custody, automated alerts, permit reporting, document retention, and remediation verification. This differs from today’s regulatory driver: PFAS and emissions rules generate test volume, whereas the opportunity is to convert irregular purchase orders into 3–7-year subscriptions with minimum annual volumes and software revenue.
A 50-site industrial or utility account buying 20–60 laboratory samples per site at USD 150–800 per sample already represents roughly USD 0.15–2.4 million of yearly analytical spend; bundling sample planning, IoT telemetry, data validation, regulatory dashboards, and 24-hour exception support can support an additional 10–25% service premium while reducing customer procurement events from dozens annually to one framework contract. The operating model can increase revenue retention above 90%, reduce sales and tender expense by 15–30%, improve instrument scheduling, and shift 5–12% of account revenue toward software and managed data carrying gross margins potentially 15–25 percentage points above field sampling.
The model is commercially credible because EU industrial rules require risk-based inspections every one to three years and expanded emissions-data disclosure, while U.S. drinking-water programmes impose recurring monitoring and public reporting rather than one-off testing. Scale depends on interoperable laboratory information systems, API links, cybersecurity, standardized digital chain-of-custody, and cross-media accreditation, but laboratories acquiring these capabilities can move from commodity analysis to embedded compliance infrastructure. If adopted across 10–15% of large utility, waste, chemical, energy, mining, and manufacturing accounts by 2030, testing-as-a-service could add approximately +2.0 percentage points to market CAGR across North America, Europe, Japan, South Korea, Singapore, and Australia.
Opportunity Impact Analysis
| Opportunity | (\~) % Potential CAGR Upside | Geographic Relevance | Execution Window |
|---|---|---|---|
| Testing-as-a-service platforms | +2.0 pp | North America, EU, developed APAC | Short term (≤ 2 years) |
| Non-target screening services | +1.7 pp | U.S., EU, Japan, South Korea | Medium term (2–4 years) |
| Community sensor networks | +1.4 pp | U.S., EU cities, India, LATAM | Short term (≤ 2 years) |
| Effect-based water testing | +1.2 pp | EU core, UK, North America, APAC | Medium term (2–4 years) |
| Climate-event response labs | +1.1 pp | North America, MENA, APAC, LATAM | Medium term (2–4 years) |
| Regional laboratory roll-ups | +1.0 pp | India, ASEAN, LATAM, Africa, CEE | Medium term (2–4 years) |
Challenges Analysis
Method-Validation Backlog
Method-validation backlog is a systemic growth challenge because emerging contaminants enter regulation faster than laboratories can build, validate, accredit, staff, and intercompare reliable procedures across drinking water, wastewater, groundwater, soil, biosolids, sediment, biota, landfill leachate, indoor air, stack emissions, and complex industrial matrices. EPA’s PFAS portfolio illustrates the gap: established approaches include Method 537.1 for selected PFAS in drinking water, Method 8327 for 24 PFAS in non-potable aqueous samples, and OTM-45 for 50 PFAS from stationary-source emissions, yet the Agency states that methods across environmental media remain in different stages of development and validation, while some research standard-operating procedures are not validated official methods.
Each new method can require 6–18 months of calibration-range definition, recovery studies, matrix-spike work, blanks, detection-limit assessment, interlaboratory validation, standard operating procedures, proficiency testing, accreditation audit, and client acceptance; for a laboratory adding LC-MS/MS or high-resolution mass spectrometry capability, this can consume USD 0.25–1.5 million in instrument, sample-preparation, software, consumables, and specialist labour before full revenue utilization. EU water-law changes widen the queue by adding microplastics, antimicrobial-resistance indicators, sensitive groundwater ecosystems, and effect-based monitoring, with Member States required to transpose the revised rules by 22 December 2027.
The commercial penalty is capacity stranded between regulation and routinization: laboratories either decline work, subcontract at 15–35% lower margin, use non-uniform research methods that customers cannot rely on for compliance, or delay market entry while better-capitalized competitors establish method leadership. Operators must prioritize modular platform methods, shared validation consortia, reference-material partnerships, automated sample preparation, cross-training, and early regulator engagement, but the scientific evidence and accreditation cycle cannot be compressed indefinitely. This creates an estimated -1.4-percentage-point medium-term CAGR friction across North America, Europe, Japan, South Korea, Australia, and other high-regulation markets.
Challenges Impact Analysis
| Challenge | (\~) % CAGR Friction Drag | Geographic Relevance | Mitigation Horizon |
|---|---|---|---|
| Method-validation backlog | -1.4 pp | North America, EU, developed APAC | Medium term (2–4 years) |
| Specialist workforce scarcity | -1.2 pp | North America, EU, APAC hubs | Long term (≥ 4 years) |
| Ultra-trace contamination control | -1.1 pp | Global PFAS testing corridors | Long term (≥ 4 years) |
| Field-to-lab data integrity | -1.0 pp | Global export and utility markets | Medium term (2–4 years) |
| Multi-matrix sample complexity | -0.9 pp | North America, EU, industrial APAC | Medium term (2–4 years) |
| Extreme-event surge logistics | -0.8 pp | North America, MENA, APAC, LATAM | Long term (≥ 4 years) |
Geopolitical Impact Analysis
War-Driven Contamination Increases the Need for Environmental Testing
Ongoing conflicts in the Middle East are increasing the need for environmental testing across air, water, soil, wastewater, and debris. In March 2026, UNEP confirmed strikes on oil facilities, including locations close to urban areas such as Tehran, and warned that burning oil releases hazardous smoke, particulates, and toxic compounds. Such incidents increase requirements for air-quality monitoring, hydrocarbon analysis, soil assessment, and water-contamination testing around affected industrial locations.
The environmental impact is also visible in Gaza. UNEP reported in September 2025 that conflict had generated about 61 million tonnes of debris, while around 15% could carry relatively high contamination risks from asbestos, heavy metals, or industrial waste. Damage reduced the capacity of water storage reservoirs and pumping facilities by 84%, with only 9 of 54 facilities remaining active. Wastewater-treatment facilities were also reported as non-operational, increasing risks to groundwater and coastal environments.
These conditions are creating stronger demand for chemical, microbiological, heavy-metal, asbestos, hydrocarbon, and wastewater testing. However, insecurity and restricted site access can delay sampling and laboratory activity. During reconstruction, environmental assessment and continuous contamination monitoring are expected to become increasingly important for safe infrastructure restoration and land reuse.
Regional Insights
In 2025, North America held a dominant Environmental Testing Market position, capturing more than a 34.60% share and generating USD 3.8 billion. Strong environmental regulation, extensive laboratory infrastructure, and rising attention to PFAS, drinking water, wastewater, and soil contamination support regional testing demand. The U.S. EPA estimates that public drinking-water systems require USD 625 billion in infrastructure investment over the next 20 years, including USD 107 billion for treatment infrastructure and USD 422.9 billion for distribution and transmission improvements. These projects support continued demand for water-quality analysis, contamination monitoring, and regulatory laboratory testing.
North America’s leadership is also supported by increasingly strict testing requirements for emerging chemicals. Health Canada maintains a drinking-water objective of 30 ng/L for the combined concentration of 25 specified PFAS, and recommends monitoring at least annually where PFAS concerns exist. The Canadian government has also monitored PFAS across freshwater environments, examining 13 different PFAS in 566 freshwater samples collected from monitoring locations across the country. Such requirements, together with U.S. federal programmes covering drinking water and industrial discharges, continue to increase the use of chromatography, mass spectrometry, microbiological testing, and rapid environmental analysis.
Asia Pacific is developing as the fastest-growing regional segment, supported by expanding pollution-monitoring networks, industrial environmental controls, and stronger water and air-quality surveillance. China’s Ministry of Ecology and Environment reported that monitoring during 2025 covered 3,641 national surface-water assessment sections, with 91.4% meeting Class I–III water-quality standards. Environmental monitoring also covered 339 prefecture-level and above cities, where average PM2.5 concentration reached 28.0 micrograms per cubic metre, down 4.4% from 2024. Continued investment in monitoring capacity, pollution control, wastewater treatment, and contaminant detection is creating wider opportunities for environmental laboratories and analytical testing technologies across the region.
Key Regions and Countries Insights
- North America
- US
- Canada
- Europe
- Germany
- France
- The UK
- Spain
- Italy
- Rest of Europe
- Asia Pacific
- China
- Japan
- South Korea
- India
- Australia
- Rest of APAC
- Latin America
- Brazil
- Mexico
- Rest of Latin America
- Middle East & Africa
- GCC
- South Africa
- Rest of MEA
Key Players Analysis
SGS S.A. maintains a strong position in environmental testing through laboratory analysis, inspection, compliance, and sustainability services. In 2025, the company generated CHF 6.945 billion in sales and reported CHF 1.108 billion in adjusted operating income. SGS operated 2,456 laboratories and business facilities and employed 102,804 people worldwide. Its broad laboratory network supports environmental testing for water, soil, industrial emissions, chemicals, and other regulated materials across multiple industries.
Eurofins Scientific SE is a major environmental and analytical testing provider with extensive capabilities in water, soil, chemicals, contaminants, and emerging pollutants. In 2025, Eurofins generated €7.296 billion in revenue, representing 5.0% reported growth. The company operated more than 950 laboratories across 59 countries, supported by over 65,000 employees. Its network provides more than 200,000 analytical methods, while the environmental testing business in Europe continued to benefit from expanding wastewater and contaminant regulations. Eurofins
Bureau Veritas S.A. supports environmental testing through laboratory, inspection, certification, and regulatory-compliance services for industrial and infrastructure clients. In 2025, the company reported revenue of €6.466 billion, with adjusted operating profit reaching €1.053 billion and an adjusted operating margin of 16.3%. Bureau Veritas employed 82,049 people and maintained more than 1,600 offices and laboratories globally. Its environmental services help organizations meet requirements related to pollution control, safety, sustainability, and environmental protection.
Top Key Players Outlook
- SGS S.A.
- Eurofins Scientific SE
- Bureau Veritas S.A.
- Intertek Group plc
- ALS Limited
- TÜV SÜD AG
- Element Materials Technology Group
- Mérieux NutriSciences Corporation
- TÜV Rheinland AG
- Pace Analytical Services, LLC
- Montrose Environmental Group, Inc.
- EnviroScience Consultants, Inc.
- Envirolab Services Pty Ltd.
- R J Hill Laboratories Limited
- Microbac Laboratories, Inc.
Recent Developments
- In May 2026, ALS announced a major laboratory investment programme of around A$230 million, including new Environmental hub laboratories in Sydney, Bangkok, and Prague; FY2026 expenditure on the programme reached A$93.7 million.
- TÜV SÜD generated €3.639 billion in revenue, employed 30,526 people, operated more than 1,000 locations, and invested €126.7 million, including spending on laboratories, technical infrastructure, digitalization, and new capabilities.
Report Scope
| Report Features | Description |
|---|---|
| Market Value (2025) | USD 11.1 Bn |
| Forecast Revenue (2035) | USD 19.2 Bn |
| CAGR (2026-2035) | 5.6% |
| Base Year for Estimation | 2025 |
| Historic Period | 2020-2024 |
| Forecast Period | 2026-2035 |
| Report Coverage | Revenue Forecast, Market Dynamics, Competitive Landscape, Recent Developments |
| Segments Covered | By Sample Type (Wastewater / Effluent, Soil and Sediment, Water, Air, Others), By Target Tested (Chemical, Biological, Temperature, Moisture, Noise, Others), By Technology (Conventional Testing, Rapid Testing), By Rapid Testing Method (Chromatography, Mass Spectrometry, Molecular Spectroscopy, Polymerase Chain Reaction (PCR), Others), By End User (Government and Regulatory Agencies, Testing Laboratories, Energy and Utilities, Agriculture and Irrigation, Research and Academic Institutes, Others) |
| Regional Analysis | North America – US, Canada; Europe – Germany, France, The UK, Spain, Italy, Rest of Europe; Asia Pacific – China, Japan, South Korea, India, Australia, Singapore, Rest of APAC; Latin America – Brazil, Mexico, Rest of Latin America; Middle East & Africa – GCC, South Africa, Rest of MEA |
| Competitive Landscape | SGS S.A., Eurofins Scientific SE, Bureau Veritas S.A., Intertek Group plc, ALS Limited, TÜV SÜD AG, Element Materials Technology Group, Mérieux NutriSciences Corporation, TÜV Rheinland AG, Pace Analytical Services, LLC, Montrose Environmental Group, Inc., EnviroScience Consultants, Inc., Envirolab Services Pty Ltd., R J Hill Laboratories Limited, Microbac Laboratories, Inc. |
| Customization Scope | Customization for segments, region/country-level will be provided. Moreover, additional customization can be done based on the requirements. |
| Purchase Options | We have three licenses to opt for: Single User License, Multi-User License (Up to 5 Users), Corporate Use License (Unlimited User and Printable PDF) |





































