Report Overview
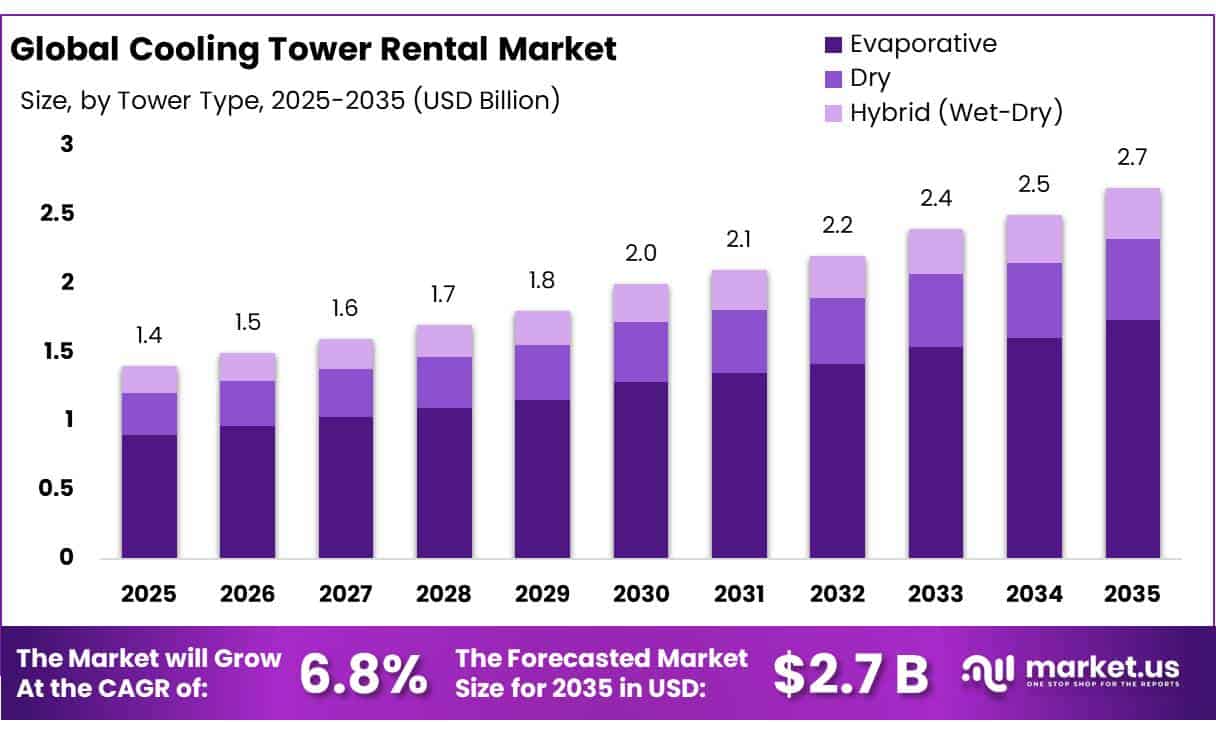
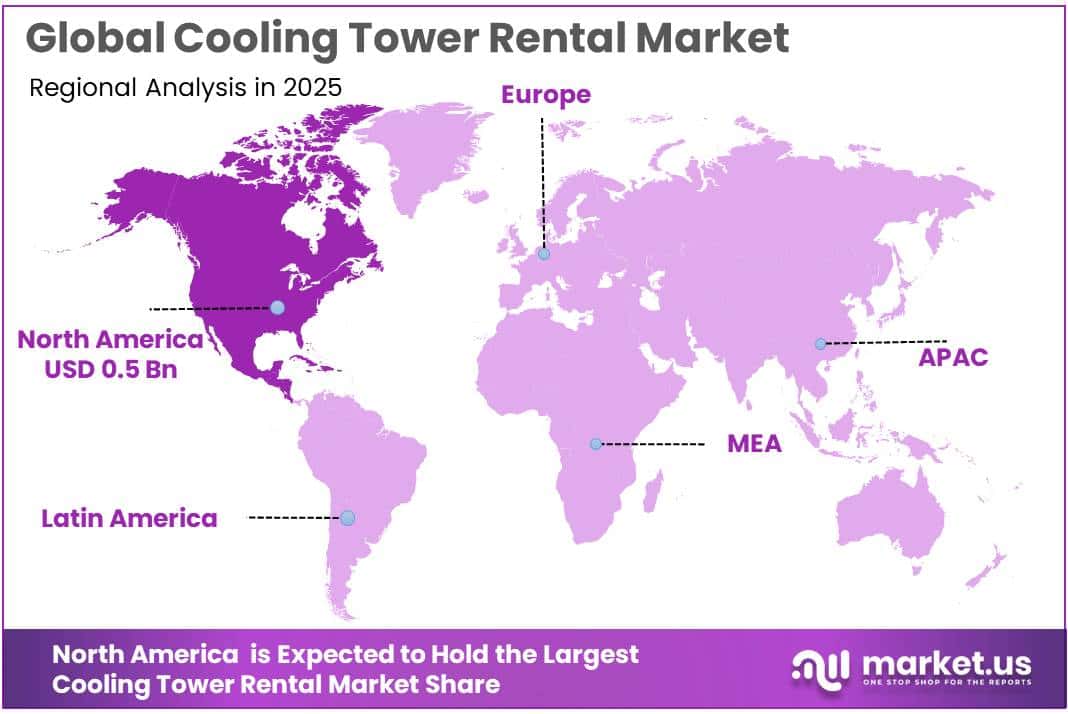
The Global Cooling Tower Rental Market size is expected to be worth around USD 2.7 Billion by 2035, from USD 1.4 Billion in 2025, growing at a CAGR of 6.8% during the forecast period from 2026 to 2035. In 2025, North America held a dominant market position, capturing more than a 36.00% share, holding USD 0.5 Billion revenue.
The cooling tower rental industry plays an important role in supporting industrial operations that require reliable and continuous heat removal without investing in permanent cooling infrastructure. Rental cooling towers are temporary or mobile systems designed to dissipate excess heat from industrial processes, chilled water systems, and production equipment.
- According to the U.S. Environmental Protection Agency (EPA), cooling towers are essential to industries such as petroleum refining, chemical manufacturing, primary metals processing, glass production, and rubber manufacturing. The U.S. Department of Energy (DOE) explains that cooling towers remove heat through evaporation, making them an essential component of industrial heat-management systems.
One of the primary driving factors is the growing requirement for uninterrupted industrial production and reduced equipment downtime. Cooling failures can interrupt manufacturing operations, affect product quality, and increase maintenance costs. Temporary cooling systems help industrial operators maintain process temperatures during planned maintenance, emergency repairs, and equipment replacement. The scale of industrial cooling demand is significant: according to the U.S. EPA Lean and Water Toolkit, cooling operations account for more than 50% of combined industrial and commercial water demand in the United States.
Water conservation and environmental compliance are expected to create additional opportunities for technological development. The DOE identifies evaporation, blowdown, and drift as important factors affecting cooling tower water consumption and efficiency. Rental providers can respond through advanced water-treatment technologies, automated monitoring, improved drift eliminators, and hybrid cooling systems that combine wet and dry operating modes.
The EPA WaterSense program notes that cooling towers can account for 20% to 50% or more of total water use in commercial and institutional facilities. Consequently, water-efficient rental equipment and environmentally compliant cooling solutions are likely to become increasingly important purchasing considerations.
Key Takeaways
- Cooling Tower Rental Market size is expected to be worth around USD 2.7 Billion by 2035, from USD 1.4 Billion in 2025, growing at a CAGR of 6.8%.
- Evaporative held a dominant market position, capturing more than a 64.34% share.
- 5 to 20 MW held a dominant market position, capturing more than a 44.21% share.
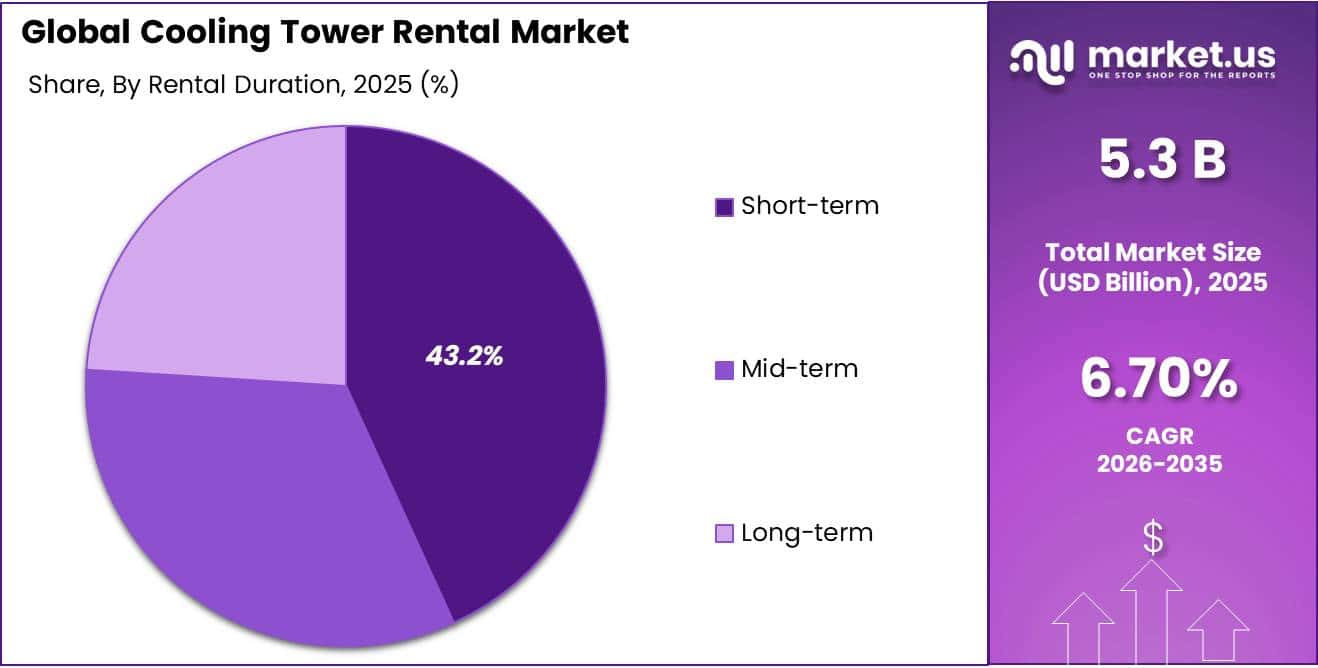
- Short-term (Less than 6 months) held a dominant market position, capturing more than a 43.00% share.
- Oil and Gas held a dominant market position, capturing more than a 29.67% share.
- North America held a dominant position in the Cooling Tower Rental Market in 2025, accounting for 36.00% of the global market, with a valuation of USD 0.5 billion.
By Tower Type Analysis
Evaporative cooling towers dominate due to their effective heat-removal performance and wide industrial application.
In 2025, “Evaporative” held a dominant market position, capturing more than a 64.34% share of the Cooling Tower Rental Market by Tower Type. Evaporative cooling towers are widely preferred because they provide effective heat dissipation by combining water evaporation with air circulation. These systems are suitable for industries that require continuous and reliable cooling, including chemical processing, petroleum refining, power generation, and manufacturing. Their ability to manage substantial thermal loads makes them a preferred choice for temporary cooling requirements during plant maintenance, equipment failure, and production expansion.
Dry cooling towers are used in industrial applications where water availability, environmental considerations, and operational requirements influence cooling system selection. These systems transfer heat to the surrounding air through heat exchangers and fans without depending on evaporative cooling. In 2025, dry cooling tower rental demand was supported by the need for water-efficient cooling solutions in power generation, industrial processing, and facilities operating in water-constrained locations.
According to the U.S. Energy Information Administration (EIA), dry cooling systems use approximately 95% less water than wet cooling systems. The EIA also reported that dry and hybrid cooling systems accounted for 3% of U.S. thermoelectric generating capacity, based on its published data. These figures highlight the water-saving benefits of dry cooling technology and its potential relevance to industrial facilities seeking to reduce water consumption.
By Capacity Range Analysis
The 5 to 20 MW segment leads due to its ability to support large-scale industrial cooling requirements.
In 2025, “5 to 20 MW” held a dominant market position, capturing more than a 44.21% share of the Cooling Tower Rental Market by Capacity Range. This capacity range is widely preferred by industrial facilities that require substantial cooling support without investing in permanent infrastructure. Chemical processing plants, petroleum refineries, power generation facilities, and large manufacturing units use these rental systems during planned maintenance, equipment replacement, emergency shutdowns, and production expansion.
In 2025, demand for 5 to 20 MW rental cooling towers was supported by their ability to accommodate high thermal loads while providing operational flexibility. In 2026, this segment is expected to remain important as industrial facilities increasingly seek reliable temporary cooling solutions to minimize production interruptions and maintain process efficiency.
Below 5 MW cooling towers are suitable for facilities with relatively lower cooling requirements, including small manufacturing units, commercial buildings, food processing facilities, and localized industrial processes. In 2025, demand for this capacity range was supported by its compact design, easier transportation, and suitability for short-term cooling applications. These systems are commonly rented during equipment maintenance, localized cooling failures, seasonal demand increases, and commissioning activities.
By Rental Duration Analysis
Short-term rentals dominate due to their flexibility and suitability for emergency cooling and scheduled industrial maintenance.
In 2025, “Short-term (Less than 6 months)” held a dominant market position, capturing more than a 43.00% share of the Cooling Tower Rental Market by Rental Duration. Short-term rental services are widely preferred by industrial operators seeking immediate cooling support during equipment breakdowns, planned maintenance, seasonal production increases, and temporary shutdowns. Chemical processing, petroleum refining, power generation, and manufacturing facilities rely on these arrangements to maintain production without investing in permanent cooling infrastructure.
Mid-term (6–24 months) rental arrangements are suitable for industrial facilities requiring cooling support over an extended period. These contracts are commonly used during plant modernization, infrastructure development, production line expansion, major equipment replacement, and long-duration maintenance projects. In 2025, demand for mid-term cooling tower rentals was supported by the need to maintain stable cooling performance throughout industrial upgrades without purchasing permanent equipment.
The U.S. Department of Energy (DOE) emphasizes cooling tower performance, energy efficiency, and water management as important aspects of industrial facility operations. These priorities support the relevance of short-term rental solutions, which allow facilities to maintain cooling operations while existing systems undergo maintenance or upgrades. However, these government sources provide industrial context rather than directly measuring rental-duration market shares.
By Application Analysis
Oil and gas dominates due to its continuous cooling requirements and dependence on reliable thermal management.
In 2025, “Oil and Gas” held a dominant market position, capturing more than a 29.67% share of the Cooling Tower Rental Market by Application. The oil and gas industry requires dependable cooling systems across refining, processing, petrochemical operations, and supporting facilities. Cooling tower rentals are widely used during refinery maintenance, turnaround activities, equipment replacement, unexpected cooling system failures, and capacity expansion. These temporary systems help operators maintain process stability while reducing the need for permanent capital investment.
Chemical and Petrochemical applications represent an important segment of the Cooling Tower Rental Market, driven by continuous processing operations and high heat-removal requirements. Cooling towers are essential for managing heat generated during chemical reactions, distillation, condensation, and other industrial processes. In 2025, rental demand was supported by plant maintenance, equipment replacement, turnaround activities, and temporary production expansion.
According to the U.S. Energy Information Administration (EIA), the United States recorded 18.4 million barrels per calendar day of operable atmospheric crude oil distillation capacity as of January 1, 2025. This substantial refining capacity demonstrates the scale of industrial operations requiring dependable heat-management infrastructure.
Key Market Segments
By Tower Type
- Evaporative
- Dry
- Hybrid (Wet-Dry)
By Capacity Range
- Below 5 MW
- 5 to 20 MW
- Above 20 MW
By Rental Duration
- Short-term (Less than 6 months)
- Mid-term (6-24 months)
- Long-term (Greater than 24 months)
By Application
- Oil and Gas
- Chemical and Petrochemical
- Power Generation
- HVACR
- Data Centers
- Pulp and Paper
- Other End User Industry
Driver Analysis
Fiber-Labeling Recognition
The FDA’s dietary-fiber definition includes naturally occurring fibers and isolated or synthetic non-digestible carbohydrates with at least three monomeric units that the agency has determined provide beneficial physiological effects, including effects on blood glucose, blood cholesterol, calorie intake, or bowel-movement frequency. The current US Daily Value for dietary fiber is 28 grams per day on a 2,000-calorie diet, while the label rule sets 14 grams per day for children aged one to three years on a 1,000-calorie diet.
This framework makes fiber a measurable formulation target rather than a vague wellness attribute, encouraging suppliers to develop ingredients with documented analytical performance and label eligibility. A product with 5 grams of fiber per serving delivers approximately 17.9% of the adult Daily Value, a calculated relationship rather than a regulatory threshold.
The +0.6-percentage-point sensitivity reflects the breadth of packaged foods that can use a recognized fiber declaration, although eligibility remains ingredient-specific: FDA has identified seven isolated or synthetic non-digestible carbohydrates under its 2016 rule, and manufacturers must exclude fiber amounts that do not meet the definition. Commercial value therefore shifts toward validated ingredient documentation, analytical consistency, and formulation support rather than simply marketing a plant-derived material as “fiber.”
Drivers Impact Analysis
| Driver | (~) % Impact on CAGR Forecast | Geographic Relevance | Impact Timeline |
|---|---|---|---|
| Fiber-labeling recognition | +0.6 pp | North America core | Short term (≤ 2 years) |
| WHO fiber intake guidance | +0.5 pp | Global; Europe, North America | Medium term (2–4 years) |
| Authorized beta-glucan claims | +0.4 pp | EU core | Medium term (2–4 years) |
| Added-sugar reformulation | +0.4 pp | North America, EU | Short term (≤ 2 years) |
| Traceability-enabled sourcing | +0.2 pp | US import and processing chains | Medium term (2–4 years) |
Restraint Analysis
Make-Up Water Dependence
Evaporative towers require a continuous make-up supply, making water availability and discharge capacity direct constraints on rental adoption rather than merely operating considerations. US Department of Energy guidance estimates evaporation at approximately 1.8 gallons per ton-hour, varying with conditions and load; it also identifies typical cycles of concentration of approximately 2.5–7. These are engineering reference values, not 2026 rental-fleet averages.
For an illustrative 1,000-ton load operating continuously at that evaporation rate, evaporation would reach approximately 43,200 gallons daily; using DOE’s mass-balance relationships and ignoring drift and leaks, operation at three cycles would require approximately 64,800 gallons of make-up water and generate 21,600 gallons of blowdown daily. At six cycles, make-up demand would fall to approximately 51,840 gallons and blowdown to 8,640 gallons.
The improvement reduces—but does not eliminate—the dependence on reliable water supply, treatment, and disposal. DOE cautions that higher cycles remain limited by make-up chemistry and the risk of scaling and corrosion. The −0.6-percentage-point sensitivity represents a scenario in which water-constrained projects are downsized, deferred, or awarded to non-evaporative alternatives; it is not an estimate of current market losses.
Restraint Impact Analysis
| Restraint | (~) % Impact on CAGR Forecast | Geographic Relevance | Impact Timeline |
|---|---|---|---|
| Make-up water dependence | −0.6 pp | Gulf states, US Southwest, Southern Europe | Short term (≤ 2 years) |
| Thermal performance limits | −0.5 pp | US Gulf Coast, Gulf states, Southeast Asia | Long term (≥ 4 years) |
| Biological-control obligations | −0.4 pp | NYC core; regulated US urban sites | Short term (≤ 2 years) |
| Site-access constraints | −0.3 pp | Dense US, European, East Asian sites | Medium term (2–4 years) |
| Short-hire cost burden | −0.4 pp | North America, Western Europe | Short term (≤ 2 years) |
Opportunity Analysis
Water-Managed Rental Packages
The opportunity is to combine temporary towers with engineered make-up-water sourcing, treatment, conductivity controls, and documented water performance, allowing suppliers to serve projects that conventional equipment-only quotations cannot support economically. DOE identifies advanced cooling-tower controls as commercially available technology that continuously manages chemical feed and cycles of concentration; its data-center guidance states that increasing cycles from three to six can reduce make-up requirements by approximately 20%, subject to water chemistry and treatment constraints. These are established technical capabilities, not newly invented rental products.
DOE also documents UC Irvine’s conversion of central-plant towers from potable to recycled water, demonstrating technical precedent without establishing universal suitability for temporary installations. The incremental white space is a standardized rental package incorporating source-water qualification, temporary treatment, metering, and service accountability. Illustratively, reducing a project’s baseline make-up requirement of 60,000 gallons per day by 20% saves 12,000 gallons daily, or 1.08 million gallons over 90 days; these are scenario calculations, not guaranteed savings.
If eligible customers representing 10% of baseline market revenue generate 20% net additional revenue through otherwise unserved projects and attributable services, the resulting 2% endpoint uplift supports approximately +0.5 percentage points of annualized upside. Recycled-water compatibility, biological control, discharge permissions, and treatment costs determine whether the package creates value rather than merely adding expense.
Opportunity Impact Analysis
| Opportunity | (~) % Potential CAGR Upside | Geographic Relevance | Execution Window |
|---|---|---|---|
| Water-managed rental packages | +0.5 pp | US Southwest, Southern Europe, Gulf states | Medium term (2–4 years) |
| Performance-linked cooling contracts | +0.4 pp | US refining hubs; Western Europe | Short term (≤ 2 years) |
| Capacity-reservation subscriptions | +0.3 pp | North America, Western Europe | Short term (≤ 2 years) |
| Thermal-effluent service packages | +0.4 pp | US industrial corridors; European process hubs | Medium term (2–4 years) |
| Compliance-managed rental services | +0.3 pp | NYC core; regulated US urban markets | Short term (≤ 2 years) |
Challenges Analysis
Seasonal Fleet Allocation
Cooling-tower rental providers must balance geographically concentrated peak demand against the cost of holding equipment that may be underutilized outside critical operating windows. WMO’s 2026 climate assessment identifies 2015–2025 as the eleven warmest years recorded, with 2025 approximately 1.43°C above the pre-industrial average; these observations support the need for climate-aware planning but do not establish local wet-bulb conditions, rental bookings, or fleet shortages. The operating challenge is correlated demand: several customers may require supplementary cooling simultaneously, limiting the protection offered by pooling equipment across nearby sites.
In a hypothetical 10,000-ton regional fleet, retaining 15% as contingency reserve leaves 8,500 tons available for committed work; simultaneous requests totaling 10,000 tons would create a 1,500-ton allocation gap, while expanding capacity to satisfy rare peaks could weaken off-season utilization. These figures are planning assumptions, not observed market statistics. The −0.5-percentage-point sensitivity represents possible revenue leakage from unfulfilled peak-period work and inefficient repositioning, rather than an assumption that rentals cease during heatwaves.
Providers need probabilistic demand forecasts, geographically diversified fleets, pre-season maintenance, and reservation contracts that distinguish guaranteed capacity from best-efforts mobilization. Crucially, climate-driven demand growth and fleet-allocation friction can coexist: the same event that generates orders can increase transport costs and reduce available capacity.
Challenges Impact Analysis
| Challenge | (~) % CAGR Friction Drag | Geographic Relevance | Mitigation Horizon |
|---|---|---|---|
| Seasonal fleet allocation | −0.5 pp | US South, Southern Europe, Gulf states | Medium term (2–4 years) |
| Hydraulic integration variability | −0.4 pp | North America, European process hubs | Medium term (2–4 years) |
| Changing water chemistry | −0.3 pp | Gulf states, Southern Europe, US Southwest | Medium term (2–4 years) |
| Performance measurement consistency | −0.3 pp | North America, Western Europe, East Asia | Medium term (2–4 years) |
| Cross-climate operating readiness | −0.2 pp | Northern US, Canada, Northern Europe | Long term (≥ 4 years) |
Geopolitical Impact Analysis
Geopolitical Impact of the 2026 Middle East War on the Cooling Tower Rental Market
The ongoing Middle East war in 2026 has increased uncertainty across global energy markets, industrial supply chains, and equipment procurement, indirectly affecting the Cooling Tower Rental Market. Disruptions to oil and gas production, shipping routes, and energy infrastructure have increased operating costs for industrial facilities. According to the United Nations, Middle East oil output declined by at least 9 million barrels per day in March 2026, compared with approximately 26 million barrels per day in February 2026. These disruptions have affected industrial production and increased pressure on energy-intensive sectors.
For cooling tower rental providers, higher fuel prices, transportation expenses, equipment costs, and supply chain delays can increase installation and maintenance expenditure. The U.S. Energy Information Administration reported that approximately 20.9 million barrels per day of oil passed through the Strait of Hormuz during the first half of 2025, highlighting the strategic importance of this shipping route. Prolonged disruptions may delay the delivery of pumps, heat exchangers, industrial components, and replacement equipment.
Regional Insights
Dominating Region: North America
North America held a dominant position in the Cooling Tower Rental Market in 2025, accounting for 36.00% of the global market, with a valuation of USD 0.5 billion. The region’s leadership is supported by its established industrial infrastructure, extensive oil and gas operations, chemical processing facilities, and power generation capacity. The United States contributes significantly through its large manufacturing base and growing demand for temporary cooling solutions during plant maintenance, equipment replacement, and operational expansion.
According to the U.S. Environmental Protection Agency, industrial water withdrawals in the United States exceed 18.2 billion gallons per day, while thermoelectric power accounts for 49% of total water withdrawals. This highlights the scale of industrial operations requiring water and cooling infrastructure. In 2025, rental cooling towers gained importance as industries sought flexible equipment without significant capital investment. In 2026, infrastructure modernization, increasing cooling requirements, and growing demand for temporary industrial equipment are expected to support regional market expansion.
Key Regions and Countries Insights
- North America
- US
- Canada
- Europe
- Germany
- France
- The UK
- Spain
- Italy
- Rest of Europe
- Asia Pacific
- China
- Japan
- South Korea
- India
- Australia
- Rest of APAC
- Latin America
- Brazil
- Mexico
- Rest of Latin America
- Middle East & Africa
- GCC
- South Africa
- Rest of MEA
Key Players Analysis
Aggreko plc is a leading provider of temporary cooling, power generation, and industrial rental solutions. The company supports oil and gas, petrochemical, manufacturing, and power generation industries through customized cooling systems. Its rental services include short-term and long-term solutions, equipment monitoring, and technical support. In 2025–2026, Aggreko continued strengthening its integrated rental capabilities, focusing on operational reliability and rapid deployment. Its global service network and expertise in industrial temperature control position it strongly in the cooling tower rental market.
Sunbelt Rentals Inc. is a major equipment rental provider offering specialty solutions in power, heating, ventilation, air conditioning, and climate control. In 2026, the company reported approximately 1,600+ locations, a workforce of 26,000 employees, and an equipment fleet exceeding USD 19 billion across North America and the United Kingdom. Its specialty rental services support industrial maintenance, infrastructure development, and temporary cooling requirements. The company continues to strengthen its market presence through equipment availability, technical expertise, and customer-focused rental services.
United Rentals Inc. is one of the world’s largest equipment rental companies, providing industrial equipment and specialty rental solutions to diverse industries. In 2025, the company completed the acquisition of H&E Equipment Services for approximately USD 4.8 billion, strengthening its equipment portfolio and operational reach. Its specialty services include temporary climate control, cooling equipment, power systems, and industrial support solutions. In 2026, United Rentals continued benefiting from its extensive rental network and diversified equipment capabilities, supporting temporary cooling requirements during industrial maintenance and infrastructure projects.
Top Key Players Outlook
- Aggreko plc
- Sunbelt Rentals Inc.
- United Rentals Inc.
- Caterpillar Inc. (Cat Rental)
- Johnson Controls International plc
- SPX Cooling Technologies Inc.
- Cooling Tower Depot Inc.
- Carrier Rental Systems Inc.
- Midwest Cooling Tower Services LLC
- Baltimore Aircoil Company Inc.
- KTK Kuhlturm Karlsruhe GmbH
- ICS Cool Energy
- Other Key Players
Recent Developments
- In October 2025, Caterpillar announced an agreement to acquire RPMGlobal Holdings Limited, an Australian mining software company. The transaction was valued at approximately USD 790 million, excluding cash acquired. In February 2026, Caterpillar completed the acquisition, expanding its digital mining technology and software capabilities. Although the acquisition was not directly related to cooling tower rentals, it strengthened Caterpillar’s broader industrial technology portfolio and its focus on data-driven operational efficiency.
- In February 2026, Johnson Controls introduced Smart Ready YORK Chillers with factory-installed connectivity, providing more than 200 performance data points and reporting 32% fewer unplanned service calls among customers using connected chillers. These developments demonstrate the company’s focus on efficient cooling, predictive maintenance, and reliable thermal management for industrial and data center applications.
Report Scope
| Report Features | Description |
|---|---|
| Market Value (2025) | USD 1.4 Bn |
| Forecast Revenue (2035) | USD 2.7 Bn |
| CAGR (2026-2035) | 6.8% |
| Base Year for Estimation | 2025 |
| Historic Period | 2020-2024 |
| Forecast Period | 2026-2035 |
| Report Coverage | Revenue Forecast, Market Dynamics, Competitive Landscape, Recent Developments |
| Segments Covered | By Tower Type (Evaporative, Dry, Hybrid (Wet-Dry)), By Capacity Range (Below 5 MW, 5 to 20 MW, Above 20 MW), By Rental Duration ( Short-term (Less than 6 months), Mid-term (6-24 months), Long-term (Greater than 24 months)), By Application (Oil and Gas, Chemical and Petrochemical, Power Generation, HVACR, Data Centers, Pulp and Paper, Other End User Industry) |
| Regional Analysis | North America – US, Canada; Europe – Germany, France, The UK, Spain, Italy, Rest of Europe; Asia Pacific – China, Japan, South Korea, India, Australia, Singapore, Rest of APAC; Latin America – Brazil, Mexico, Rest of Latin America; Middle East & Africa – GCC, South Africa, Rest of MEA |
| Competitive Landscape | Aggreko plc, Sunbelt Rentals Inc., United Rentals Inc., Caterpillar Inc. (Cat Rental), Johnson Controls International plc, SPX Cooling Technologies Inc., Cooling Tower Depot Inc., Carrier Rental Systems Inc., Midwest Cooling Tower Services LLC, Baltimore Aircoil Company Inc., KTK Kuhlturm Karlsruhe GmbH, ICS Cool Energy, Other Key Players |
| Customization Scope | Customization for segments, region/country-level will be provided. Moreover, additional customization can be done based on the requirements. |
| Purchase Options | We have three licenses to opt for: Single User License, Multi-User License (Up to 5 Users), Corporate Use License (Unlimited User and Printable PDF) |