


Report Overview
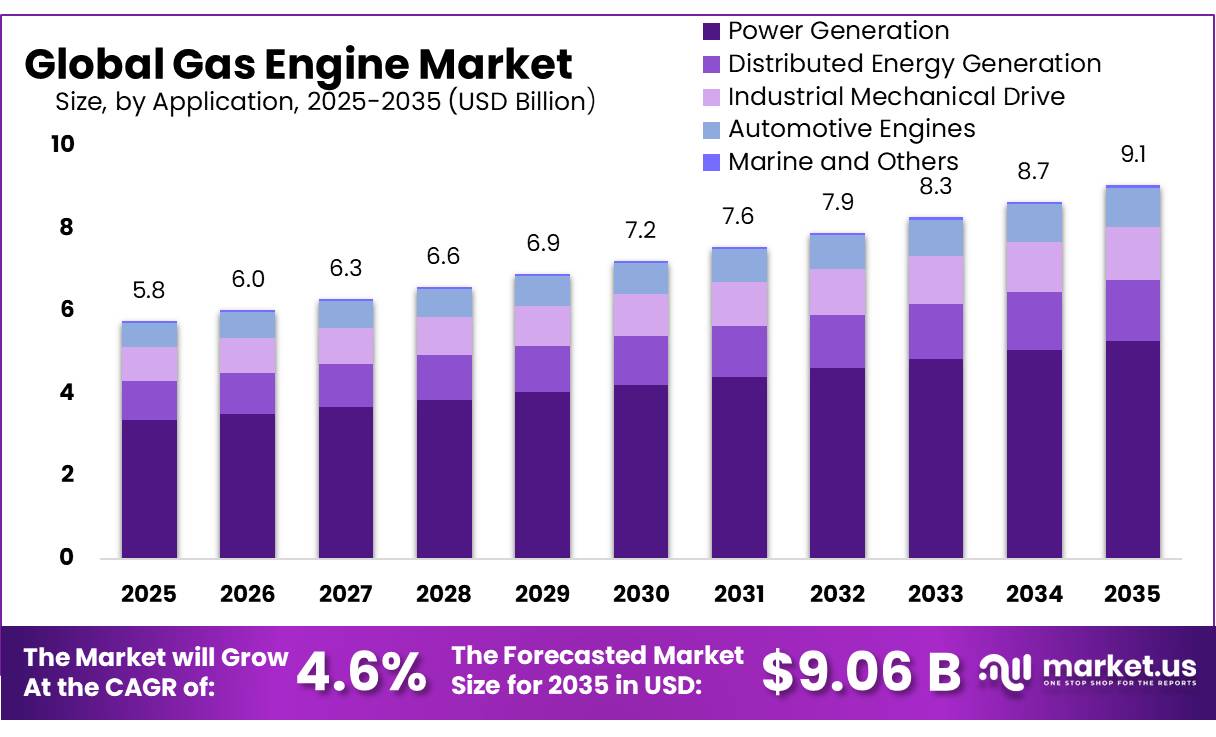
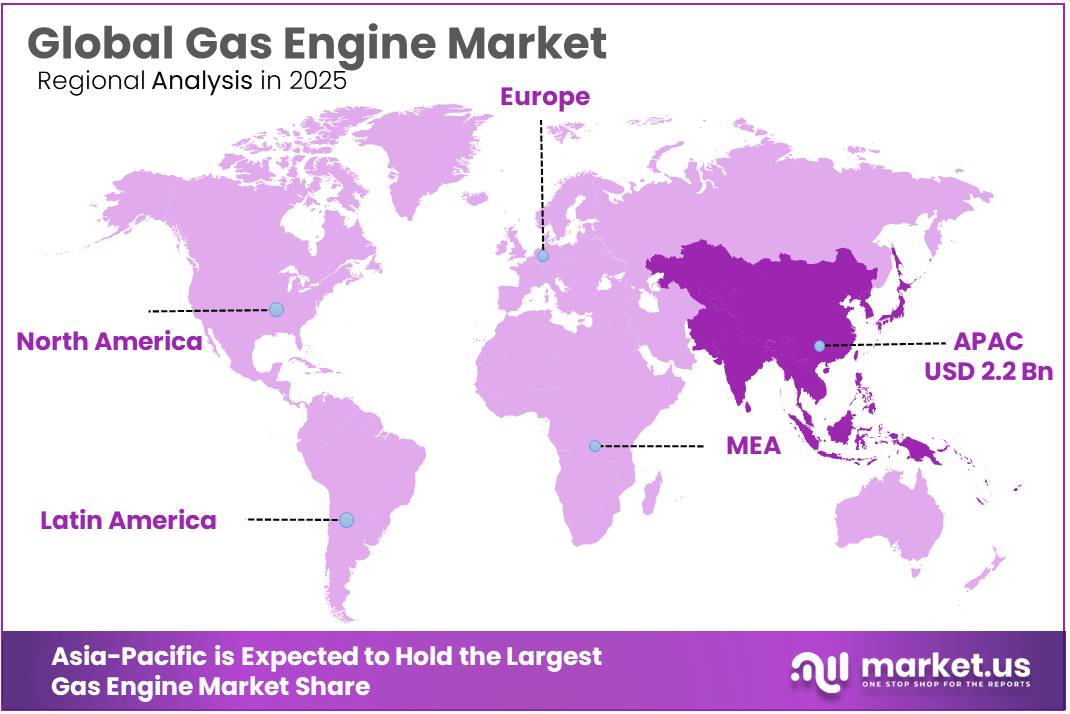
The Global Gas Engine Markett size is expected to be worth around USD 9.0 Billion by 2035, from USD 5.7 Billion in 2025, growing at a CAGR of 4.6% during the forecast period from 2026 to 2035. In 2025, Asia-Pacific held a dominant market position, capturing more than a 38.7% share, holding USD 2.2 Billion revenue.
The gas engine industry plays an important role in power generation, industrial operations, combined heat and power (CHP) systems, and distributed energy infrastructure. Gas engines convert the energy contained in natural gas, biogas, and other gaseous fuels into mechanical or electrical power. They are widely used in manufacturing facilities, commercial buildings, wastewater treatment plants, data centers, and oil and gas operations because they can provide reliable electricity close to the point of consumption.
- According to the U.S. Energy Information Administration (EIA), natural gas accounted for approximately 40% of U.S. utility-scale electricity-generation capacity in 2025, highlighting the importance of gas-based power infrastructure. Although this figure covers natural gas-fired generation overall, rather than reciprocating gas engines alone, it demonstrates the scale of the wider fuel ecosystem supporting gas engine applications.
A major driving factor for the gas engine industry is the demand for reliable and flexible electricity. Gas engines can start and adjust output to meet changing power requirements, making them suitable for industrial plants, commercial facilities, and backup power installations. The U.S. Environmental Protection Agency (EPA) reports that natural gas-fired reciprocating engines used in the natural gas industry range from 50 to 11,000 brake horsepower. These engines support pipeline compression, gas processing, storage operations, and other mechanical applications.
Another important growth factor is the increasing adoption of combined heat and power systems, which produce electricity and useful heat from the same energy source. These systems can improve overall fuel utilization when facilities have consistent electricity and thermal requirements. The U.S. Department of Energy’s 2025 United States Energy and Employment Report reported 31,400 workers in the combined heat and power electric power generation subsector in 2024.
Environmental compliance remains a key consideration for manufacturers and end users. Natural gas engines can produce lower particulate emissions than comparable diesel systems under suitable operating conditions, but they still emit nitrogen oxides, carbon monoxide, and other pollutants. The EPA’s stationary engine regulations establish emission requirements for applicable engine categories.
Key Takeaways
- Gas Engine Markett size is expected to be worth around USD 9.0 Billion by 2035, from USD 5.7 Billion in 2025, growing at a CAGR of 4.6%.
- Natural Gas held a dominant market position, capturing more than a 61.23% share.
- Power Generation (Base and Peak) held a dominant market position, capturing more than a 58.45% share.
- 2.1–5 MW held a dominant market position, capturing more than a 37.56% share.
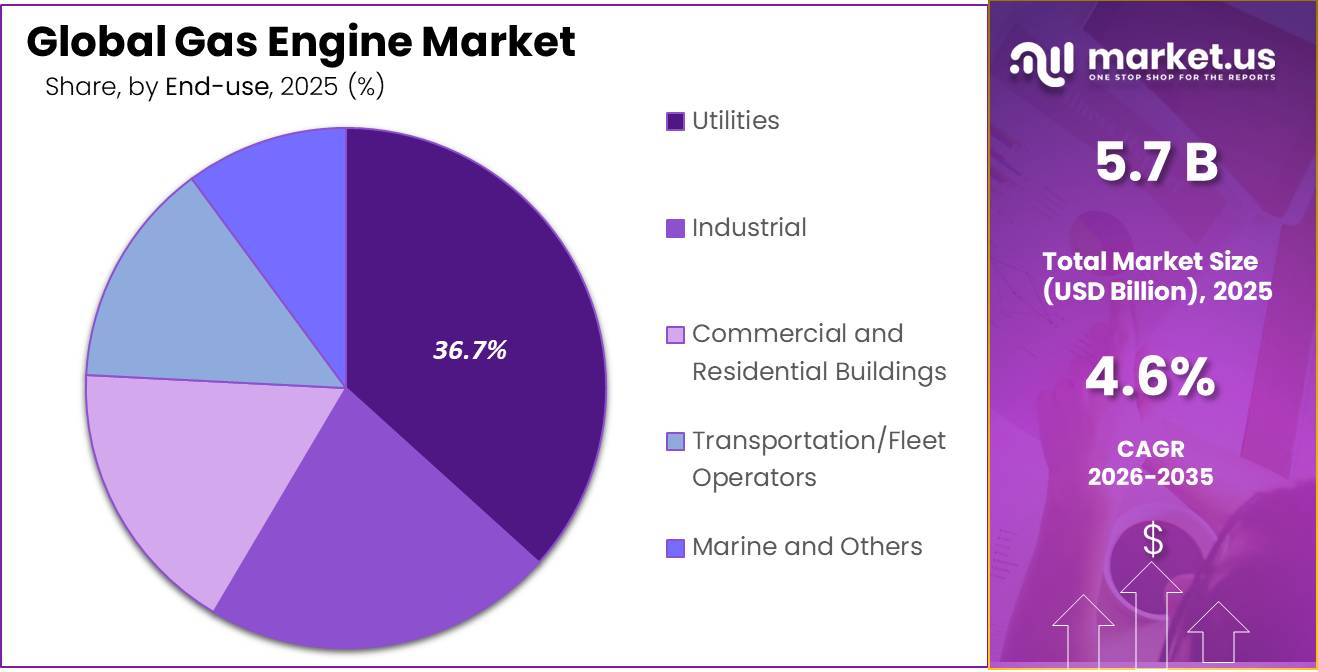
- Utilities held a dominant market position, capturing more than a 36.78% share.
- Asia-Pacific held a dominant position in the gas engine market in 2025, accounting for 38.78% of the market, valued at USD 2.2 billion.
By Fuel Type Analysis
Natural Gas dominates due to its availability, established supply infrastructure, and suitability for reliable power generation.
In 2025, “Natural Gas” held a dominant market position, capturing more than a 61.23% share. Natural gas engines are used in industrial power generation, combined heat and power systems, commercial facilities, and gas infrastructure operations. Their adoption is supported by the ability to generate electricity on-site and provide dependable power for continuous operations. Natural gas engines can also offer lower particulate emissions than diesel engines under suitable operating conditions, although actual emissions depend on engine design and controls.
Government data also supports the importance of natural gas in the wider energy sector. According to the U.S. Energy Information Administration, natural gas accounted for 40.0% of U.S. utility-scale electricity-generation capacity in 2025. This figure covers all natural gas-fired generation technologies and is not specific to gas engines. It highlights the established role of natural gas in electricity infrastructure and the supporting opportunity for engine manufacturers.
Bakery and Confectionery facilities use electricity and thermal energy for mixing, baking, drying, refrigeration, packaging, and other production processes. Gas engines may support on-site electricity generation and combined heat and power systems where the facility’s energy demand and operating conditions make them suitable. However, bakery and confectionery is an application category, not a fuel type, so its classification should be reviewed in the market segmentation. The U.S. Energy Information Administration’s 2025 electricity data records 97,871 thousand megawatt-hours of natural gas-based electricity generation in the U.S. industrial sector.
By Application Analysis
Power Generation (Base and Peak) leads through its ability to provide reliable electricity for continuous demand and peak-load requirements.
In 2025, “Power Generation (Base and Peak)” held a dominant market position, capturing more than a 58.45% share. Gas engines support base-load operations by supplying regular electricity and help meet peak demand when consumption rises. Their flexible output makes them suitable for industrial facilities, commercial buildings, and distributed power systems that require dependable electricity. According to the U.S. Energy Information Administration (EIA), natural gas accounted for 40.0% of U.S. utility-scale electricity-generation capacity in 2025.
Decentralized/Distributed Energy Generation allows businesses and industrial facilities to produce electricity close to where it is needed, reducing reliance on centralized power supply. Gas engines are suitable for this application because they can provide flexible power for manufacturing plants, data centers, commercial buildings, and other facilities requiring reliable electricity. In 2025, the U.S. Energy Information Administration reported 97,871 thousand megawatt-hours of natural gas-based electricity generation in the U.S. industrial sector.
By Power Output Analysis
The 2.1–5 MW segment leads due to its suitability for large industrial facilities and high-demand power generation.
In 2025, “2.1–5 MW” held a dominant market position, capturing more than a 37.56% share. Gas engines in this power range are suitable for industrial plants, commercial facilities, and distributed power installations that require a steady electricity supply. They can support base-load generation, peak-load demand, and combined heat and power systems, depending on the facility’s operating requirements. Their ability to supply substantial power from an on-site installation makes them relevant to businesses seeking dependable electricity and improved energy management.
The 0.5–1 MW segment serves facilities that need a reliable electricity supply without installing a larger power-generation system. These engines can support commercial buildings, hospitals, wastewater treatment plants, and industrial operations. They are also suitable for combined heat and power applications, where recovered engine heat can be used for heating or industrial processes. According to the U.S. Department of Energy’s reciprocating engine technology fact sheet, reciprocating engines used in combined heat and power systems range from 1 kW to 10 MW, and 75% of such systems are sized below 1 MW.
By End User Analysis
Utilities lead through their need for dependable electricity generation and flexible power supply.
In 2025, “Utilities” held a dominant market position, capturing more than a 36.78% share. Gas engines support utility operations by providing electricity for local grids, backup systems, and distributed generation facilities. Their flexible output makes them useful for balancing changes in electricity demand and supporting power supply when renewable generation fluctuates. Utilities may also use gas engines in combined heat and power installations where both electricity and useful heat are required.
Industrial facilities use gas engines for on-site electricity generation, combined heat and power, and selected mechanical operations. Applications include chemical processing, food manufacturing, paper production, and metal processing, where dependable energy supply is essential for daily operations. According to the U.S. Energy Information Administration (EIA), the industrial sector accounted for 33% of total U.S. energy consumption in 2025. The EIA also reports that U.S. manufacturers consumed 18,348 trillion British thermal units of energy in 2022, including fuel and nonfuel feedstocks.
Key Market Segments
By Fuel Type
- Natural Gas
- Special Gas
By Application
- Power Generation (Base and Peak)
- Decentralized/Distributed Energy Generation
- Industrial Mechanical Drive
- Transportation/Automotive Engines
- Marine and Others
By Power Output
- 0.5-1 MW
- 1.1-2 MW
- 2.1-5 MW
- Above 5 MW
By End User
- Utilities
- Industrial
- Commercial and Residential Buildings
- Transportation/Fleet Operators
- Marine and Others
Driver Analysis
Data-Center Prime Power
Data-center developers are increasingly purchasing gas-engine plants as operating infrastructure rather than relying exclusively on grid connections and emergency backup. The IEA reported that data-center electricity consumption increased 17% in 2025, compared with approximately 3% growth in global electricity demand, and identified an expanding pipeline of on-site natural-gas generation projects, particularly in the United States.
This evidence covers gas generation broadly, but manufacturer orders establish direct relevance to reciprocating engines: INNIO announced a 1.1 GW order in July 2026 involving more than 200 Jenbacher J624 engines for behind-the-meter prime power, followed by a separate 450 MW order in September with delivery expected by 2028.
Wärtsilä also disclosed a 282 MW US data-center order using 15 engines in its October 2026 interim report. Commercially, prime-power deployment can generate substantially greater operating-hour exposure than standby-only applications, strengthening demand for maintenance, spare parts, and availability management.
The +1.0-percentage-point sensitivity assumes that disclosed procurement momentum translates into deliveries and additional orders during 2026–2030; it is not calculated by extrapolating these individual contracts into a global market share. Fuel infrastructure, air permits, financing, and rapidly fluctuating AI loads remain execution conditions, so booked capacity must not be presented as commissioned capacity.
Drivers Impact Analysis
| Driver | (~) % Impact on CAGR | Geographic Relevance | Impact Timeline |
|---|---|---|---|
| Data-center prime power | +1.0 pp | US core; North America | Short term (≤ 2 years) |
| Renewable-grid balancing | +0.7 pp | Australia, Europe, Central Asia | Medium term (2–4 years) |
| Industrial CHP economics | +0.5 pp | North America, Europe, East Asia | Medium term (2–4 years) |
| Biogas resource utilization | +0.3 pp | US, EU; agricultural clusters | Medium term (2–4 years) |
| Lifecycle service attachment | +0.3 pp | North America, Europe; global fleets | Short term (≤ 2 years) |
Restraint Analysis
Fuel-Cost Exposure
Gas-engine investment is constrained when delivered fuel costs leave insufficient margin against electricity prices or customer tariffs, particularly for electricity-only operation without useful heat recovery. US Department of Energy reference systems show natural-gas reciprocating-engine electrical efficiencies of approximately 29.6%–41.9% on a higher-heating-value basis, implying fuel requirements of roughly 11.5–8.1 MMBtu per MWh; these are engineering benchmarks rather than 2026 fleet averages.
At an illustrative delivered gas price of USD 4/MMBtu, fuel-only generation costs would therefore range from approximately USD 33–46/MWh; at USD 8/MMBtu, they would increase to approximately USD 65–92/MWh, before maintenance, emissions controls, financing, and network charges. These prices are scenario assumptions, not regional market quotations. Importantly, current evidence does not justify assuming continuously rising US gas prices: EIA’s October 2026 outlook projected Henry Hub averages of USD 3.48/MMBtu in 2026 and USD 3.16/MMBtu in 2027, although hub prices exclude site-specific delivery costs.
The restraint is consequently fuel-price exposure and an inadequate spark spread—the difference between electricity revenue and fuel expense—rather than an asserted universal gas-price increase. The −0.6-percentage-point sensitivity assumes that marginal projects lose economic viability or are deferred; fuel-indexed contracts and useful heat sales can reduce that exposure but cannot guarantee an acceptable investment return.
Restraint Impact Analysis
| Restraint | (~) % Impact on CAGR | Geographic Relevance | Impact Timeline |
|---|---|---|---|
| Fuel-cost exposure | −0.6 pp | Europe, Northeast Asia; US distributed power | Short term (≤ 2 years) |
| Low-utilization economics | −0.5 pp | North America, Europe, Australia | Medium term (2–4 years) |
| Operating-permit restrictions | −0.4 pp | US emergency-power applications | Short term (≤ 2 years) |
| Battery substitution | −0.6 pp | US Southwest, Europe, Australia | Medium term (2–4 years) |
| Carbon-cost exposure | −0.4 pp | EU ETS-covered installations | Long term (≥ 4 years) |
Opportunity Analysis
Hybrid Retrofit Platforms
The opportunity is to retrofit existing gas-engine installations with integrated battery interfaces, supervisory controls, and performance services, rather than simply benefit from current demand for new microgrids. Jenbacher already offers a microgrid controller integrating engines, renewables, and storage, and explicitly supports both new projects and modernization of existing microgrids; therefore, the hardware capability itself belongs in the baseline.
The additional white space is a repeatable retrofit product sold across previously independent installations, supported by recurring optimization and availability contracts. As a hypothetical engineering case, a 2 MW/4 MWh battery added to a 10 MW engine site could supply 2 MW for approximately two hours before losses and reserve requirements, allowing controls to manage selected load changes while engines serve longer-duration requirements; this configuration does not establish guaranteed fuel savings or eliminate the need for full transient analysis.
A scenario in which eligible installations representing 10% of baseline market revenue generate net additional controls, integration, and service spending equivalent to 25% of that cohort’s existing revenue produces a 2.5% endpoint uplift, supporting approximately +0.6 percentage points of annualized upside. Only gas-engine-attributable integration and services should be counted, not the entire battery purchase. Commercial viability requires interoperability across controller generations, clear warranty boundaries, validated dispatch strategies, and evidence that savings exceed integration costs.
Opportunity Impact Analysis
| Opportunity | (~) % Potential CAGR Upside | Geographic Relevance | Execution Window |
|---|---|---|---|
| Hybrid retrofit platforms | +0.6 pp | US, Europe, Australia | Medium term (2–4 years) |
| Contracted power platforms | +0.5 pp | North America, Western Europe | Short term (≤ 2 years) |
| Hydrogen conversion packages | +0.3 pp | EU hydrogen hubs; North America | Long term (≥ 4 years) |
| Clustered biogas services | +0.4 pp | US dairy belts; EU farming clusters | Medium term (2–4 years) |
| Independent fleet consolidation | +0.3 pp | North America, Western Europe | Medium term (2–4 years) |
Challenges Analysis
Production Ramp Coordination
Large, phased orders require manufacturers to coordinate engine assembly, component procurement, factory testing, packaging, and customer-site readiness without allowing quality or delivery consistency to deteriorate. INNIO’s April 2026 framework agreement with Rehlko secured 1.25 GW of engine capacity over three years, explicitly including an existing 700 MW reservation; the incremental allocation was therefore approximately 550 MW, not an additional 1.25 GW on top of the earlier reservation. Separately, a July 2026 customer order covered approximately 1.1 GW and more than 200 J624 engines, followed by a 620 MW order that brought that customer’s cumulative orders to approximately 1.72 GW in October.
These are contracted volumes, not completed installations or evidence of existing delivery failures. The operational challenge is synchronizing multiple production and project milestones as demand scales, rather than an absolute inability to manufacture engines.
Illustratively, deferring 5% of a planned 1 GW annual delivery program would shift 50 MW of equipment recognition beyond the intended period; recovery in a later year would make this a timing effect rather than permanent lost demand. The −0.5-percentage-point sensitivity assumes that some conversion delays persist through the forecast endpoint. Mitigation requires qualified alternative suppliers, component-level capacity planning, standardized configurations, and customer schedules tied to realistic factory and site milestones.
Challenges Impact Analysis
| Challenge | (~) % CAGR Friction Drag | Geographic Relevance | Mitigation Horizon |
|---|---|---|---|
| Production ramp coordination | −0.5 pp | European factories; US projects | Medium term (2–4 years) |
| Transient load integration | −0.4 pp | US data centers; European microgrids | Medium term (2–4 years) |
| Variable fuel conditioning | −0.3 pp | EU biogas; US landfill clusters | Medium term (2–4 years) |
| Distributed service readiness | −0.4 pp | North America, Europe; remote APAC | Long term (≥ 4 years) |
| Multi-engine commissioning complexity | −0.3 pp | US campuses; Australian grid projects | Medium term (2–4 years) |
Geopolitical Impact Analysis
Geopolitical Impact of the Middle East War on the Gas Engine Market
The ongoing war in the Middle East has increased uncertainty in the gas engine market by disrupting natural gas supplies, raising fuel price volatility, and affecting energy infrastructure. Restrictions on shipping through the Strait of Hormuz have created challenges for liquefied natural gas (LNG) deliveries, particularly from Qatar and the United Arab Emirates.
- According to the International Energy Agency (IEA), July 2026, the disruption affected a route that previously carried around 20% of global LNG supply, while global natural gas demand was forecast to decline by 0.5% in 2026.
Higher fuel costs can increase operating expenses for gas engine users, especially in countries dependent on imported LNG. Manufacturers may also face higher transportation, component, and project costs, potentially delaying installations. At the same time, the conflict has strengthened interest in energy security, local power generation, and flexible electricity systems. Gas engines can support these needs where natural gas remains available at competitive prices.
However, prolonged supply disruptions could encourage some customers to consider alternative fuels, renewable energy, or other generation technologies. The market’s near-term performance will depend on the restoration of gas shipments, regional fuel prices, and the security of energy infrastructure.
Regional Insights
Asia-Pacific held a dominant position in the gas engine market in 2025, accounting for 38.78% of the market, valued at USD 2.2 billion. The region’s position is supported by industrial expansion, rising electricity requirements, and demand for reliable power generation across manufacturing and commercial facilities.
Natural gas engines can provide on-site electricity and combined heat and power for operations that require a stable energy supply. According to the International Energy Agency (IEA), electricity demand across Asia-Pacific increased by 6% in 2024, contributing almost 75% of global electricity demand growth that year. However, gas engine adoption varies by country and depends on fuel availability, gas prices, infrastructure, and competition from renewables and other generation technologies.
Asia-Pacific offers further growth opportunities for gas engines as electricity consumption, industrial activity, and demand for flexible power systems continue to shape regional energy needs. The IEA’s Gas 2025 outlook projects that natural gas demand in the region could increase by approximately 20% between 2024 and 2030, equivalent to an additional 190 billion cubic metres per year in its base case. China and emerging Asian economies are expected to contribute significantly to this expansion.
Key Regions and Countries Insights
- North America
- US
- Canada
- Europe
- Germany
- France
- The UK
- Spain
- Italy
- Rest of Europe
- Asia Pacific
- China
- Japan
- South Korea
- India
- Australia
- Rest of APAC
- Latin America
- Brazil
- Mexico
- Rest of Latin America
- Middle East & Africa
- GCC
- South Africa
- Rest of MEA
Key Players Analysis
INNIO strengthens its position in the gas engine market through its Jenbacher engine portfolio, serving power generation, industrial facilities, and data centers. In July 2026, the company announced an order for approximately 1.1 gigawatts (GW) of gas engine capacity, involving more than 200 Jenbacher J624 engines for data center power generation. This order highlights its focus on reliable, on-site electricity solutions.
Caterpillar Inc. competes in the gas engine market through its natural gas engines, generator sets, and integrated power systems. In 2025, Caterpillar reported total company sales and revenues of USD 67.6 billion, an increase of 4% from 2024. Its Power & Energy segment reported fourth-quarter sales of USD 9.4 billion, up 23% year over year, supported by higher demand across power generation and oil and gas applications. Its global dealer network also supports equipment servicing and customer operations.
Cummins Inc. maintains its position in the gas engine market through its engine technologies, generator sets, and power generation systems for industrial and commercial applications. In 2025, Cummins reported total company sales of USD 33.67 billion. Its Power Systems segment recorded external sales of USD 4.114 billion, compared with USD 3.5 billion in 2024. The company serves customers requiring dependable power equipment and related services, supporting opportunities in distributed generation, industrial power supply, and backup electricity systems.
Top Key Players Outlook
- INNIO
- Caterpillar Inc
- Cummins Inc
- Fairbanks Morse, LLC
- Kawasaki Heavy Industries Ltd
- Liebherr
- Everllence (MAN Energy Solutions SE)
- Mitsubishi Heavy Industries Ltd
- R Schmitt Enertec GmbH
- Wartsila Corp
- 2G ENERGY AG
- Other Key Players
Recent Developments
- In July 2025, Fairbanks Morse, LLC secured a U.S. Navy contract for its FM 175D diesel generator engine for the DDG(X) land-based propulsion test program. The engine offers a power range of 1,740 to 4,400 kilowatts, supporting high-power marine applications.
- In February 2025, Liebherr also presented its D9612 engine with a maximum output of 950 kW, alongside hydrogen-engine development and an ammonia-engine concept at Bauma 2025. These developments demonstrate investment in engine technology and future fuel options.
Report Scope
| Report Features | Description |
|---|---|
| Market Value (2025) | USD 5.7 Bn |
| Forecast Revenue (2035) | USD 9.0 Bn |
| CAGR (2026-2035) | 4.6% |
| Base Year for Estimation | 2025 |
| Historic Period | 2020-2024 |
| Forecast Period | 2026-2035 |
| Report Coverage | Revenue Forecast, Market Dynamics, Competitive Landscape, Recent Developments |
| Segments Covered | By Fuel Type (Natural Gas, Special Gas), By Application (Power Generation (Base and Peak), Decentralized/Distributed Energy Generation, Industrial Mechanical Drive, Transportation/Automotive Engines, Marine and Others), By Power Output (0.5-1 MW, 1.1-2 MW, 2.1-5 MW, Above 5 MW), By End User (Utilities, Industrial, Commercial and Residential Buildings, Transportation/Fleet Operators, Marine and Others) |
| Regional Analysis | North America – US, Canada; Europe – Germany, France, The UK, Spain, Italy, Rest of Europe; Asia Pacific – China, Japan, South Korea, India, Australia, Singapore, Rest of APAC; Latin America – Brazil, Mexico, Rest of Latin America; Middle East & Africa – GCC, South Africa, Rest of MEA |
| Competitive Landscape | INNIO, Caterpillar Inc, Cummins Inc, Fairbanks Morse, LLC, Kawasaki Heavy Industries Ltd, Liebherr, Everllence (MAN Energy Solutions SE), Mitsubishi Heavy Industries Ltd, R Schmitt Enertec GmbH, Wartsila Corp, 2G ENERGY AG, Other Key Players |
| Customization Scope | Customization for segments, region/country-level will be provided. Moreover, additional customization can be done based on the requirements. |
| Purchase Options | We have three licenses to opt for: Single User License, Multi-User License (Up to 5 Users), Corporate Use License (Unlimited User and Printable PDF) |








