


Report Overview
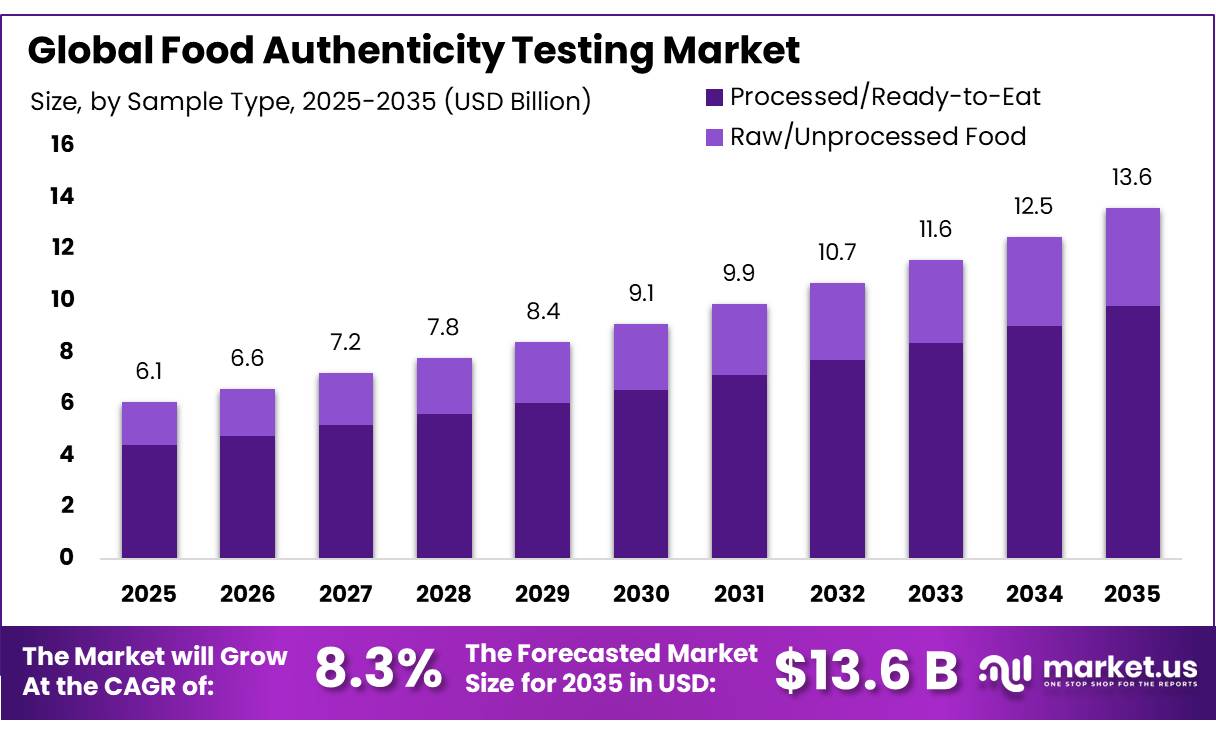
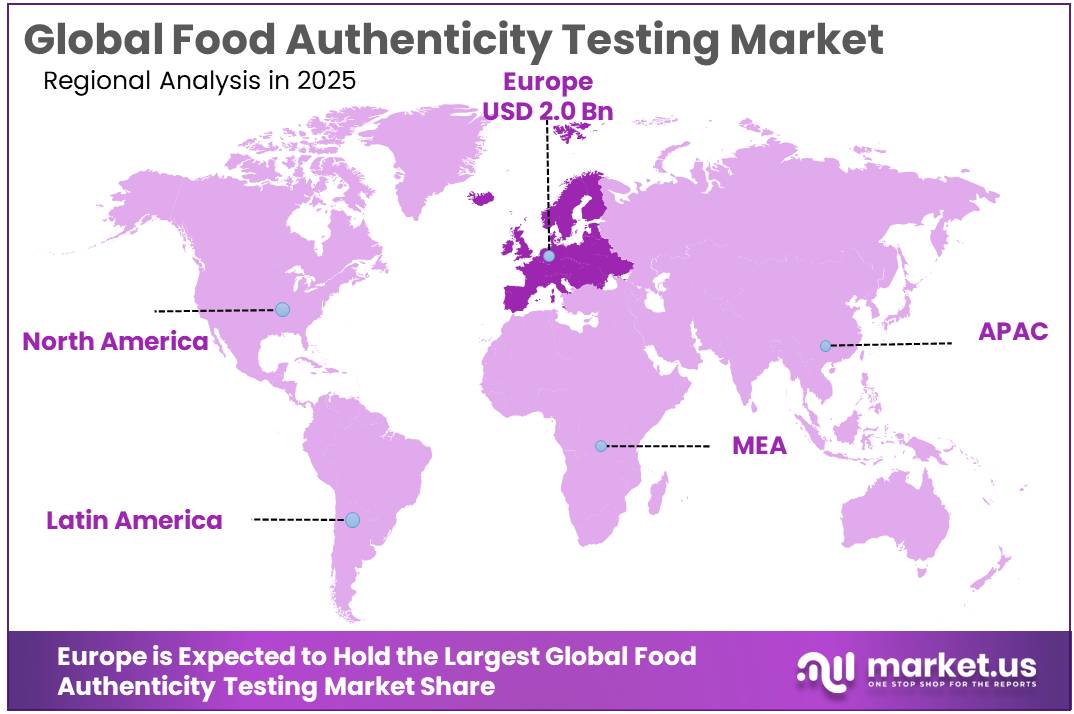
The Global Food Authenticity Testing Market size is expected to be worth around USD 13.6 Billion by 2035, from USD 6.1 Billion in 2025, growing at a CAGR of 8.3% during the forecast period from 2026 to 2035. In 2025, Europe held a dominant market position, capturing more than a 33.78% share, holding USD 2.0 Billion revenue.
Food authenticity testing has become an important part of modern food-quality control as regulators, manufacturers, retailers, and laboratories work to confirm that food matches its declared species, origin, composition, and ingredients. Testing is increasingly used for meat, fish, honey, edible oils, fruit juices, dairy products, spices, coffee, and premium foods. The U.S. FDA defines economically motivated adulteration as the intentional substitution, addition, omission, or concealment of food components for economic gain, making analytical verification an important tool for both consumer protection and regulatory enforcement.
- The UK Food Standards Agency’s 2025/26 retail surveillance programme collected 845 food products, while 285 samples were specifically assessed for authenticity. Only 81% of these authenticity samples were satisfactory. Among 125 meat products tested, b, contained meat different from that declared on the label. These findings strengthen the need for routine DNA, chemical, isotopic, and spectroscopic testing throughout food supply chains.
Government surveillance is also driving laboratory demand in North America. During FY2025, the FDA tested 102 honey samples, comprising 54 domestic and 48 imported samples, for undeclared sweeteners. The agency found 4 samples to be violative, representing an overall violation rate of about 4%. Imported samples were sourced from 20 countries, demonstrating how authenticity testing is increasingly connected with international trade controls and border inspection programmes.
Canada provides further evidence of growing regulatory activity. Between 2024 and 2025, the Canadian Food Inspection Agency tested 886 authenticity samples, including 246 marketplace-monitoring samples and 640 targeted inspectorate samples. Enforcement actions prevented more than 150,000 kg of misrepresented food from being sold. Targeted testing found satisfactory results in 67% of olive-oil samples, 81% of honey samples, and 90% of fish samples, highlighting continued opportunities for advanced laboratory verification.
Key Takeaways
- Food Authenticity Testing Market size is expected to be worth around USD 13.6 Billion by 2035, from USD 6.1 Billion in 2025, growing at a CAGR of 8.3%.
- Processed/Ready-to-Eat held a dominant market position, capturing more than a 72.10% share.
- PCR held a dominant market position, capturing more than a 32.10% share.
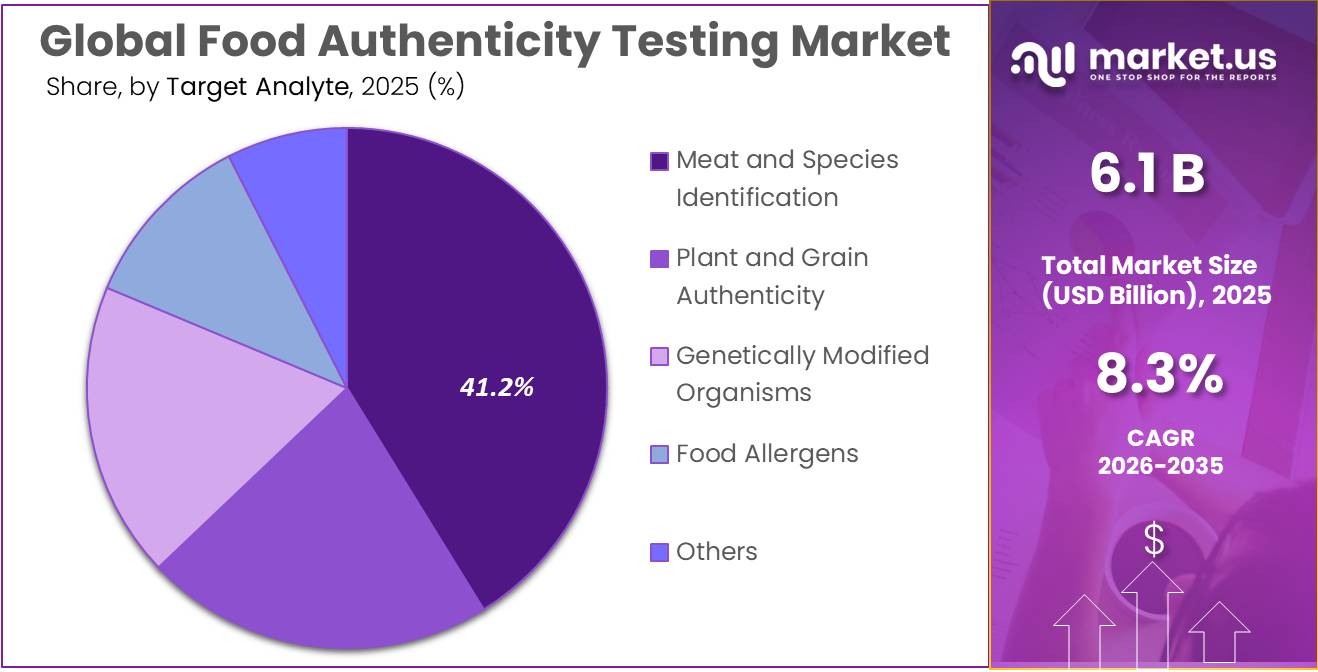
- Species Identification held a dominant market position, capturing more than a 41.23% share.
- Europe held a dominant market position, capturing more than a 33.78% share and reaching USD 2.0 Bn.
By Sample Type Analysis
Processed/Ready-to-Eat foods dominate with a 72.10% share as complex ingredients create greater need for authenticity verification..
In 2025, “Processed/Ready-to-Eat” held a dominant market position, capturing more than a 72.10% share. These foods require strong authenticity testing because processing can make ingredient substitution, species mixing, and incorrect composition harder to detect visually.
The UK Food Standards Agency’s 2025/26 surveillance programme tested 285 samples specifically for authenticity and found 81% satisfactory. Among 125 meat products, 48 contained meat different from the declared species. Prepared fish products also underwent DNA testing, with 40 samples examined and 95% found satisfactory.
Raw/Unprocessed Food represents an important segment of food authenticity testing, particularly for honey, meat, fish, oils, grains, herbs, and agricultural commodities. Testing at the raw-material stage allows food companies to detect substitution or dilution before questionable ingredients move further through processing and distribution.
In 2025, the U.S. FDA tested 102 honey samples, including 54 domestic and 48 imported samples, using stable carbon isotope ratio analysis to detect undeclared sweeteners. The UK Food Standards Agency also tested 40 raw goat-meat samples during its 2025 surveillance work; 20 contained only sheep meat, while additional samples contained mixed species or deer.
By Technology Analysis
PCR dominates the Food Authenticity Testing Market with a 32.10% share due to its accuracy in detecting species substitution and undeclared ingredients.
In 2025, “PCR” held a dominant market position, capturing more than a 32.10% share. PCR remains widely used in food authenticity testing because it can identify specific plant or animal DNA even when foods are processed and difficult to verify visually. The European Commission’s Joint Research Centre uses real-time PCR for species identification and authenticity control.
JRC scientists also developed quantitative PCR methods for 6 commonly used herbs and spices and identified the top 5 adulterants for each group. In addition, 13 methods entered inter-laboratory validation to support harmonised food-control testing. These government-backed activities show why PCR remains important for detecting substitution, undeclared species, and economically motivated adulteration in complex foods.
Next-Generation Sequencing (NGS) is gaining importance in food authenticity testing because it can screen mixed foods containing several plant, animal, or microbial species in a single analysis. The UK Government Chemist describes NGS as a technology capable of rapidly identifying and characterising species within complex food samples, making it particularly useful when targeted PCR cannot cover every possible adulterant.
By Target Analyte Analysis
Species Identification dominates the Food Authenticity Testing Market with a 41.23% share as meat substitution remains a major control issue.
In 2025, “Species Identification” held a dominant market position, capturing more than a 41.23% share. The segment remains important because meat and seafood products can be vulnerable to substitution, mixing, or incorrect species declaration. In the UK Food Standards Agency’s 2025/26 retail surveillance programme, 165 samples were examined for meat and fish speciation.
Among 125 meat products, 48 samples, or 38%, contained meat different from that stated on the label. Goat products showed particular authenticity problems, while sausages and lamb burgers also contained undeclared meat species. These findings support continued use of PCR, DNA sequencing, and molecular identification techniques across meat-processing and food-control laboratories.
Plant and Grain Authenticity is an important testing area covering spices, herbs, rice, wheat, cereals, and other botanical ingredients. Testing helps identify undeclared plant material, lower-value varieties, incorrect botanical species, and adulteration during processing.
European Commission Joint Research Centre work has developed quantitative real-time PCR methods for 6 widely consumed herbs and spices, including paprika/chilli, turmeric, saffron, cumin, oregano, and black pepper, targeting the top 5 adulterants for each commodity. Earlier EU coordinated testing involved nearly 10,000 analyses, showing the scale of regulatory attention given to botanical authenticity.
Key Market Segments
By Sample Type
- Raw/Unprocessed Food
- Processed/Ready-to-Eat
By Technology
- PCR
- ELISA
- DNA Sequencing/Barcoding
- Next-Generation Sequencing (NGS)
- Mass Spectrometry (LC-MS/GC-MS)
- NMR/Molecular Spectrometry
- Other Technologies
By Target Analyte
- Meat and Species Identification
- Plant and Grain Authenticity
- Genetically Modified Organisms (GMO)
- Food Allergens
- Others
Driver Analysis
Risk-Based Fraud Enforcement
The enforcement funnel is already large enough to support recurring laboratory demand—August 2025 alone contained 166 fraud suspicions extracted from 643 iRASFF notifications—and the 2024 OPSON XIII operation across 29 European countries conducted 5,821 checks, issued 104 arrest warrants, dismantled 11 criminal networks, and removed approximately 22,000 tonnes of food plus 850,000 litres of beverages valued above EUR 91 million.
An analyst operating model for a 20-site food group assumes risk-based controls raise annual authenticity-test intensity from 0.5–1.0% to 1.5–3.0% of incoming high-risk lots; across 40,000 lots, that means 400–1,000 incremental tests at an estimated blended laboratory price of USD 180–650, creating USD 72,000–650,000 of recurring spend before investigation, legal-chain-of-custody, and confirmatory work.
Commercially, laboratories shift from sporadic sample revenue to 12–36-month surveillance contracts containing commodity risk scoring, quarterly sampling, secure evidence management, and regulator-ready reporting; utilization improves because routine panels fill base capacity while suspected failures trigger higher-margin LC-MS, isotope-ratio, NMR, or sequencing confirmation. Using 2026 testing penetration, inspection intensity, and contract-conversion assumptions, this enforcement-led transition is estimated to add 2.3 percentage points to attainable CAGR through 2028, concentrated in the EU and UK with spill-over into North American suppliers and non-EU exporters serving European customers.
Drivers Impact Analysis
| Driver | (~) % Impact on CAGR Forecast | Geographic Relevance | Impact Timeline |
|---|---|---|---|
| Risk-based fraud enforcement | +2.3 pp | EU core; UK, North America | Short term (≤ 2 years) |
| High-value commodity fraud | +1.9 pp | EU, Americas, APAC trade hubs | Short term (≤ 2 years) |
| Digital traceability integration | +1.6 pp | North America core; EU spill-over | Medium term (2-4 years) |
| Import-chain verification | +1.4 pp | U.S., EU, GCC, developed APAC | Short term (≤ 2 years) |
| Multi-modal analytics adoption | +1.2 pp | North America, EU, Japan, Korea | Medium term (2-4 years) |
| Origin-claim protection | +1.0 pp | EU core; global premium exports | Medium term (2-4 years) |
Restraint Analysis
High-End Instrument Cost
An analyst-modelled full-service authenticity laboratory requires USD 1.8–5.5 million in initial equipment, method development, clean-room modifications, data infrastructure, validation materials, and installation, before USD 0.6–1.5 million in annual payroll, maintenance, proficiency testing, calibration, reagents, and quality-system cost; isotope-ratio or NMR platforms can each absorb USD 300,000–900,000 of the initial budget, while service contracts commonly add 7–12% of instrument value per year.
A laboratory processing fewer than 2,000–4,000 premium samples annually may therefore struggle to cover a USD 250–600 blended cost per analysis without charging USD 500–1,500 per sample, which discourages routine screening by cost-sensitive food companies and restricts testing to post-incident investigations. This is especially acute in India, ASEAN, Africa, Latin America, and smaller Eastern European markets, where locally available sample volumes may not support specialist equipment utilization above 40–55%.
The business effect is delayed regional laboratory expansion, concentration of advanced testing in a small number of hubs, sample-shipping lead times of 5–14 days, and margin pressure when laboratories subsidize capital through low-price contract work. This capital-intensity restraint is estimated to deduct -1.7 percentage points from baseline CAGR across emerging APAC, Latin America, Africa, and peripheral European markets through 2030.
Restraint Impact Analysis
| Restraint | (~) % Impact on CAGR | Geographic Relevance | Impact Timeline |
|---|---|---|---|
| High-end instrument cost | -1.7 pp | Emerging APAC, LATAM, Africa | Medium term (2-4 years) |
| Reference database gaps | -1.5 pp | Global; emerging origins | Long term (≥ 4 years) |
| Fragmented method acceptance | -1.3 pp | EU, U.S., APAC, GCC | Medium term (2-4 years) |
| Sampling-chain integrity costs | -1.1 pp | Global import corridors | Short term (≤ 2 years) |
| Traceability-rule enforcement delay | -1.0 pp | North America core | Medium term (2-4 years) |
| Accreditation capacity constraints | -0.8 pp | U.S., developing markets | Short term (≤ 2 years) |
Opportunity Analysis
Traceability-Linked Testing SaaS
FDA’s Food Traceability Rule requires additional records for foods on the Food Traceability List and was originally due for compliance on 20 January 2026, but the enforcement timetable has been deferred to 20 July 2028, giving providers a defined 24-month-plus build-and-integrate runway rather than an immediate mandatory revenue event. A testing platform serving a food group with 25,000 traceable lots annually could charge USD 1–4 per digitally verified lot, USD 25,000–150,000 in annual enterprise software and workflow fees, plus USD 150–600 for 3–8% of lots selected for risk-based authenticity testing, generating analyst-modelled account revenue of USD 187,500–1.35 million before audit, API, and compliance-management modules.
The economic shift is substantial: results that normally deliver USD 200–800 of one-time laboratory revenue can be converted into a multi-year data asset, raising customer retention from an estimated 55–70% for transactional testing to 80–95% for embedded workflow systems, reducing client acquisition cost by 15–30% through integration-led switching friction, and adding 10–25 percentage points to gross margin on software revenue after initial development.
This is not baseline growth from rising test volumes; it requires labs to acquire LIMS vendors, build APIs, standardize result ontologies, secure data-governance approval from brands, and offer insurer- and regulator-ready audit trails. Firms that establish the platform before 2028 enforcement can lock in preferred laboratory status across importers, retailers, and co-manufacturers, with an estimated +2.0 percentage-point CAGR upside across North America, EU supply chains, and export-oriented APAC over two to four years.
Opportunity Impact Analysis
| Opportunity | (~) % Potential CAGR | Geographic Relevance | Execution Window |
|---|---|---|---|
| Traceability-linked testing SaaS | +2.0 pp | North America, EU, export APAC | Medium term (2-4 years) |
| Honey-origin verification hubs | +1.7 pp | EU, China, Turkey, Americas | Short term (≤ 2 years) |
| At-line rapid screening networks | +1.5 pp | North America, EU, ASEAN, LATAM | Short term (≤ 2 years) |
| Authenticity-data consortiums | +1.3 pp | EU, U.S., Japan, Korea | Long term (≥ 4 years) |
| Importer risk-subscription models | +1.1 pp | U.S., EU, GCC, Singapore | Medium term (2-4 years) |
| Lab roll-up and hub networks | +0.9 pp | India, ASEAN, LATAM, Africa | Medium term (2-4 years) |
Challenges Analysis
Reference Data Drift
NIST identifies well-characterized food-matrix reference materials as critical to accurate food measurement and notes that food authenticity requires advanced methods, data tools, and reference-material suites rather than a single standalone test. A laboratory serving honey, olive oil, seafood, coffee, cocoa, spices, dairy, meat, and botanical ingredients may need 500–3,000 verified reference samples per major commodity, covering 10–30 source regions and 3–5 seasonal vintages; at an analyst-modelled USD 150–750 per sample for sourcing, custody, preparation, characterization, storage, and metadata, a usable library requires USD 0.1–2.25 million per commodity before annual refreshes of 10–25%.
If these libraries are incomplete, false-positive or inconclusive findings can rise from an operating target below 3% toward 7–12%, creating disputed lot holds, repeat testing, supplier friction, and 5–15 additional days before product release. The strategic response is not a one-time database purchase but a permanent reference-sample procurement network, shared producer agreements, annual geographic resampling, uncertainty monitoring, and machine-learning model recalibration; these activities typically consume 4–8% of annual laboratory revenue for high-complexity portfolios but preserve the defensibility of premium origin and adulteration claims. This evolving data burden is estimated to impose a -1.3-percentage-point drag on maximum market CAGR across global high-value food chains and emerging-origin markets over four or more years.
Challenges Impact Analysis
| Challenge | (~) % CAGR Friction | Geographic Relevance | Mitigation Horizon |
|---|---|---|---|
| Reference Data Drift | -1.3 pp | Global; emerging-origin markets | Long term (≥ 4 years) |
| Cross-Method Result Harmonization | -1.1 pp | EU, North America, developed APAC | Medium term (2-4 years) |
| Specialist Talent Pipeline | -1.0 pp | North America, EU, Japan, Korea | Long term (≥ 4 years) |
| Sampling Network Integrity | -0.9 pp | Global import corridors | Medium term (2-4 years) |
| Digital Chain Interoperability | -0.8 pp | U.S., EU, APAC export hubs | Medium term (2-4 years) |
| Adulteration Method Evolution | -0.7 pp | Global high-value commodity trade | Long term (≥ 4 years) |
Geopolitical Impact Analysis
Ongoing Wars Increase Food Supply Disruption and Strengthen Demand for Authenticity Testing
Ongoing conflicts in Ukraine and the Middle East are increasing supply-chain uncertainty across the global food industry, creating a stronger need for food authenticity testing. The Russia–Ukraine war continues to affect grain production and Black Sea exports. FAO reported that Ukraine’s 2025 cereal production was about 5% below average, while export volumes in 2025/26 remained below pre-conflict levels. Around 5.4 million hectares of winter cereals were planted for 2026, also 5% lower than the previous year.
Middle East conflict has added further pressure through energy and shipping disruption. UNCTAD reported that ship transits through the Strait of Hormuz fell by about 95% during the 2026 disruption, while oil prices initially surged by more than 60% and gas prices more than doubled. Higher freight, insurance, and ingredient costs can increase incentives for substitution or supply changes.
Regional Insights
Europe Leads Food Authenticity Testing with 33.78% Share and USD 2.0 Bn
In 2025, Europe held a dominant market position, capturing more than a 33.78% share and reaching USD 2.0 Bn. Strong enforcement activity and laboratory infrastructure support this position. During 2025, the UK Food Standards Agency funded authenticity and speciation checks on more than 350 samples. Among 40 raw goat-meat samples, 20 contained only sheep meat, while other samples contained mixed species or deer. The FSA also plans to allocate around 35% of its research spending in 2026/27 to improved surveillance, strengthening demand for PCR, sequencing, isotope analysis, and other authenticity technologies.
Asia-Pacific is emerging as the fastest-growing regional opportunity as governments expand food inspection and laboratory surveillance. China’s market regulators completed 6,661,030 food-safety inspection batches in 2025, with an overall non-compliance rate of 2.82%. Among failed samples, excessive pesticide residues represented 42.49%, while improper food-additive use accounted for 15.74%. Australia also coordinated 92 food recalls in 2025, above its 10-year average of 87, while undeclared allergens caused 38% of recalls. Growing testing volumes, imported-food controls, and expanding processed-food trade are supporting wider adoption of authenticity testing technologies across the region.
Key Regions and Countries Insights
- North America
- US
- Canada
- Europe
- Germany
- France
- The UK
- Spain
- Italy
- Rest of Europe
- Asia Pacific
- China
- Japan
- South Korea
- India
- Australia
- Rest of APAC
- Latin America
- Brazil
- Mexico
- Rest of Latin America
- Middle East & Africa
- GCC
- South Africa
- Rest of MEA
Key Players Analysis
Eurofins Scientific maintains a strong position in food authenticity and analytical testing through its global laboratory network and advanced molecular capabilities. In 2025, the company generated €7.296 billion in revenue, increasing 5.0% year over year, while organic growth reached 3.7%. Europe contributed €3.829 billion, representing 52% of total revenue. Eurofins reported solid growth in European Food and Feed Testing, supported by higher testing volumes, laboratory optimisation, digitalisation, and increasing regulatory requirements across food supply chains.
SGS SA remains a leading testing, inspection, and certification provider supporting food safety, quality, traceability, and authenticity programmes worldwide. In 2025, SGS recorded sales of CHF 6.945 billion, with organic growth of 5.6%. Adjusted operating income reached CHF 1.108 billion, while its adjusted operating margin improved to 16.0%. Free cash flow reached CHF 841 million. Its broad laboratory and inspection capabilities support food manufacturers and retailers requiring verification of composition, origin, contaminants, species, and regulatory compliance.
Intertek Group PLC provides food authenticity, safety, inspection, and assurance services through its global ATIC platform. In 2025, company revenue reached £3.432 billion, while adjusted operating profit increased to £619.6 million and adjusted operating margin reached 18.1%. Its Health and Safety-related business generated £336.8 million in like-for-like revenue, while the Food business delivered double-digit like-for-like growth at constant currency. Rising demand for food testing, factory hygiene audits, and supply-chain assurance continues to strengthen its position.
Top Key Players Outlook
- Eurofins Scientific
- SGS SA
- Intertek Group PLC
- Bureau Veritas SA
- ALS Limited
- NSF International
- Merieux NutriSciences
- Thermo Fisher Scientific
- FOSS Analytics
- Neogen Corporation
- Bio-Rad Laboratories
- Waters Corporation
- Other Key Players
Recent Developments
- Bureau Veritas remained active in Agri-Food & Commodities, which generated €1.164 billion in 2025 revenue and delivered 3.7% organic growth. Group revenue reached €6.466 billion in 2025, with adjusted operating profit of €1.053 billion and a 16.3% margin.
- In May 2026, ALS reported continued momentum, with Food organic revenue increasing 7.2% and total Life Sciences revenue reaching A$2.026 billion, up 6.0% year over year. The division generated A$448.9 million in underlying EBITDA and a 22.2% margin.
Report Scope
| Report Features | Description |
|---|---|
| Market Value (2025) | USD 6.1 Bn |
| Forecast Revenue (2035) | USD 13.6 Bn |
| CAGR (2026-2035) | 8.3% |
| Base Year for Estimation | 2025 |
| Historic Period | 2020-2024 |
| Forecast Period | 2026-2035 |
| Report Coverage | Revenue Forecast, Market Dynamics, Competitive Landscape, Recent Developments |
| Segments Covered | By Sample Type (Raw/Unprocessed Food, Processed/Ready-to-Eat), By Technology (PCR, ELISA, DNA Sequencing/Barcoding, Next-Generation Sequencing (NGS), Mass Spectrometry (LC-MS/GC-MS), NMR/Molecular Spectrometry, Other Technologies), By Target Analyte (Meat and Species Identification, Plant and Grain Authenticity, Genetically Modified Organisms (GMO), Food Allergens, Others) |
| Regional Analysis | North America – US, Canada; Europe – Germany, France, The UK, Spain, Italy, Rest of Europe; Asia Pacific – China, Japan, South Korea, India, Australia, Singapore, Rest of APAC; Latin America – Brazil, Mexico, Rest of Latin America; Middle East & Africa – GCC, South Africa, Rest of MEA |
| Competitive Landscape | Eurofins Scientific, SGS SA, Intertek Group PLC, Bureau Veritas SA, ALS Limited, NSF International, Merieux NutriSciences, Thermo Fisher Scientific, FOSS Analytics, Neogen Corporation, Bio-Rad Laboratories, Waters Corporation, Other Key Players |
| Customization Scope | Customization for segments, region/country-level will be provided. Moreover, additional customization can be done based on the requirements. |
| Purchase Options | We have three licenses to opt for: Single User License, Multi-User License (Up to 5 Users), Corporate Use License (Unlimited User and Printable PDF) |





































