


Report Overview
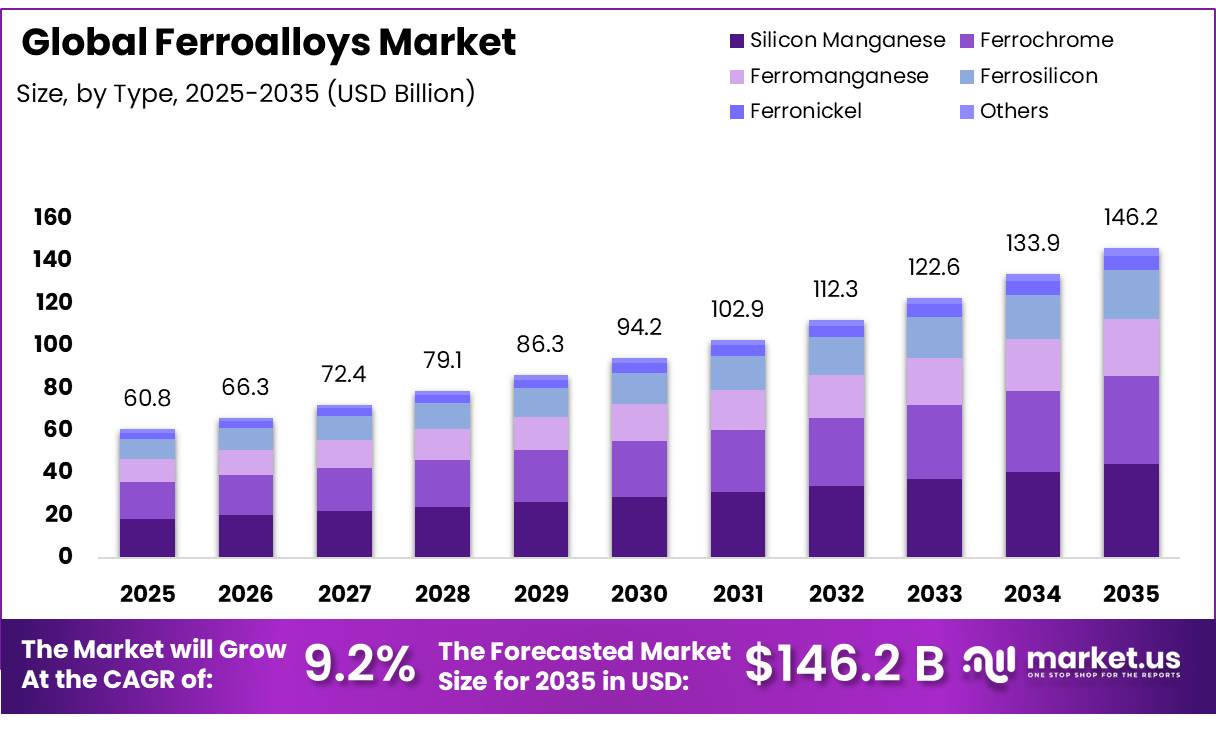
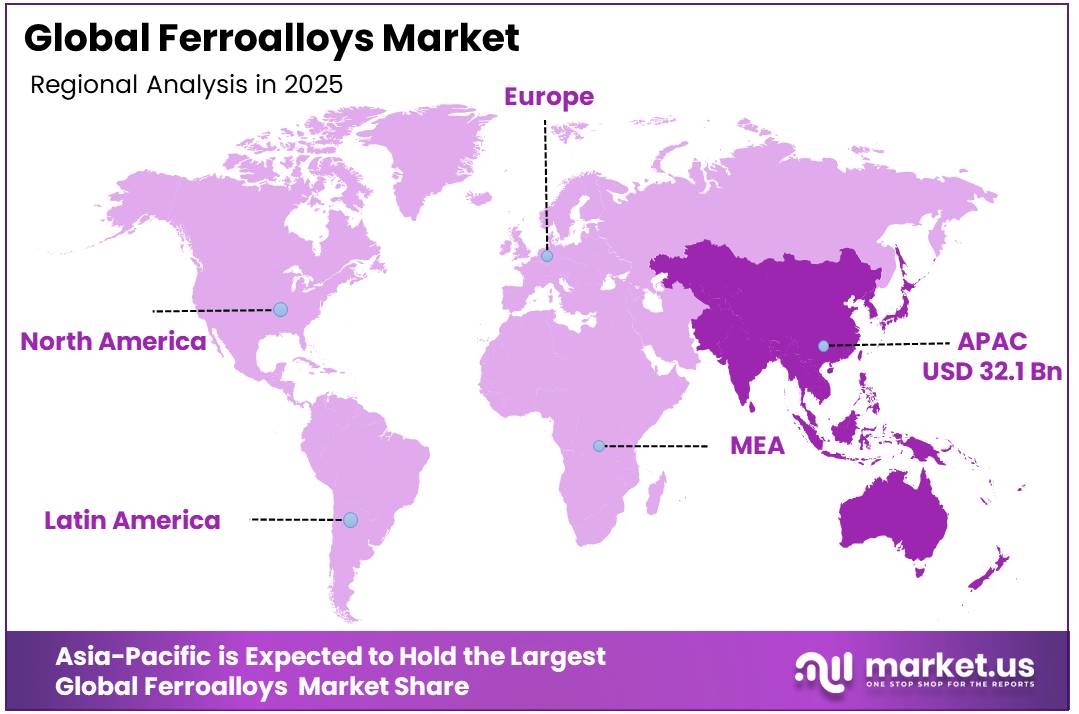
In 2025, the Global Ferroalloys Market was valued at USD 60.8 billion, and between 2026 and 2035, this market is estimated to register a CAGR of 9.2%, reaching about USD 146.2 billion by 2035. In 2025, Asia Pacific led the market, achieving over 52.8% share with a revenue of USD 32.1 Billion.
The global ferroalloys market is expanding due to ferroalloys’ relevance in reinforcing steel and automotive components. According to data from the United States Geological Survey (USGS), mineral-dependent manufacturing sectors contributed more than $4.09 trillion to the US GDP. The rapid development of infrastructure in emerging economies has been fueling this expansion. High fluctuation in electricity and energy prices presents a significant operational concern.
- According to the U.S. Geological Survey’s Mineral Commodity Summaries 2026, published on February 6, 2026, global chromite mine production was estimated at 51 million tonnes in 2025, representing a 3% increase from 2024. Global manganese ore production reached approximately 20 million tonnes of contained manganese in 2025, up from 18.7 million tonnes in 2024. The individual commodity reports are dated February 2026.
- According to the World Steel Association’s April 2026 Short-Range Outlook, global steel demand is nearing the end of its long-term structural adjustment cycle. Market demand rises by 0.3% to 1.724 billion tons, establishing a stable consumption foundation for bulk alloys. Decreasing contraction rates in China, along with steady industrial development in India, underpin this stabilization.
Key Takeaways
- The Global Ferroalloys Market was valued at USD 60.8 billion in 2025.
- The global Market is projected to grow at a CAGR of 9.2% and is estimated to reach USD 146.2 billion by 2035.
- Silicon Manganese serves as the dominant product type within the global ferroalloys market, capturing a 30.5% segment share.
- Bulk Ferroalloys function as the dominant product category, overwhelmingly commanding 85.6% of the total market share.
- Deoxidizer operates as the leading market application, accounting for 34.7% of all ferroalloy utilization.
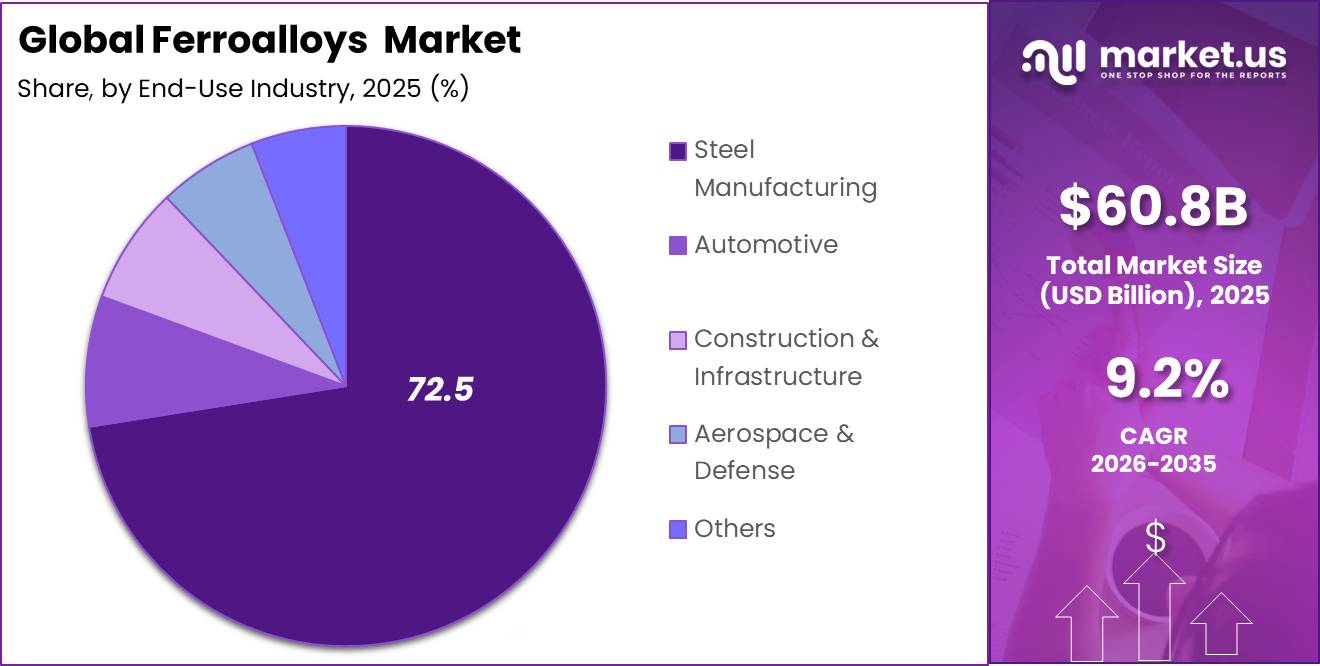
- Steel Manufacturing acts as the dominant end-use industry, standing as the primary growth driver with a massive 72.5% share.
- Asia Pacific emerges as the dominant geographic region, holding a 52.8% share of the global market
The production scope includes smelting methods such as submerged arc furnace and electric arc furnaces. Decarbonization of industries has emerged as the fastest-growing factor for demand. This means a quick move away from coal-dependent systems to more hydro-based manufacturing systems. The future forecast rests on the integration of artificial intelligence in the smelting processes. Smart AI programs optimize energy utilization to counteract price volatility.
Ferroalloys industries face dynamic changes in the sector, characterized by an ever-changing political environment and stringent regulations, including environmentally conscious measures. Protectionist policies, such as the EU CBAM, change conventional supply chain networks by targeting the carbon emissions of metal imports.
In response to such trade barriers, producers are rapidly changing their metallurgy processes to include the use of green metallurgy by substituting metallurgical coal with renewable biocarbon as well as electric arc furnaces that use scrap steel. Precise segmentation in the market distinguishes the unique consumer profile of bulk alloys like silicomanganese and ferrosilicon compared to specialty noble alloys used in making stainless and electrical steels. Producers monitor benchmarking measures such as specific energy consumption (SEC).
Ferroalloys Market Segmentation
Type Analysis
Silicon Manganese leads with 30.5% due to its strong use in steelmaking.
In 2025, Silicon Manganese held a dominant market position, capturing more than a 30.5% share. By December 2025, its leadership remained supported by wide use in carbon steel and alloy steel production. Steelmakers rely on silicon manganese because it removes oxygen and improves strength, hardness, and surface quality. Its balanced alloying properties also help mills simplify production and control costs. Demand stayed firm across construction steel, automotive components, machinery, rail equipment, and infrastructure products.
Ferrochrome emerged as the growing segment during December 2025. Its demand increased with wider stainless steel production and rising need for corrosion-resistant materials. Producers serving transport, energy, engineering, and processing industries benefited from this shift. Greater use of durable steel grades is expected to support continued ferrochrome consumption steadily worldwide.
Product Category Analysis
Bulk Ferroalloys lead with 85.60% due to their essential role in large-scale steel production.
In 2025, Bulk Ferroalloys held a dominant market position, capturing more than a 85.60% share. By December 2025, the segment remained central to steelmaking because products such as ferromanganese, silicomanganese, and ferrosilicon are used in large volumes for deoxidation, alloying, and strength improvement. Their broad availability, established production base, and suitability for carbon and low-alloy steels supported steady demand. Construction, automotive, machinery, rail, and infrastructure industries continued to depend on bulk ferroalloys for consistent steel quality and cost-efficient output.
Noble Ferroalloys emerged as the growing segment in December 2025. Demand increased as producers focused on specialty steels with better heat resistance, corrosion protection, hardness, and performance. Their use in aerospace, energy, defence, and advanced engineering applications supported wider adoption, especially where precise alloy composition and superior material properties were required across demanding and high-value manufacturing environments.
Application Analysis
Deoxidizer leads with 34.70% due to its essential role in producing clean, high-quality steel.
In 2025, Deoxidizer held a dominant market position, capturing more than a 34.70% share. By December 2025, the segment remained widely used because ferroalloys remove dissolved oxygen from molten steel and reduce defects during casting. Steel producers depend on deoxidizers to improve strength, surface finish, consistency, and overall product quality. Their regular use across carbon steel, stainless steel, construction steel, automotive components, machinery, and rail products supported stable demand.
Alloying Element Additive emerged as the growing segment in December 2025. Its use increased as manufacturers developed steel grades with better hardness, wear resistance, heat tolerance, and corrosion protection. Rising demand from energy, transport, defence, and advanced engineering applications encouraged greater consumption of ferroalloys as performance-enhancing additives in demanding and specialized manufacturing environments.
By End-Use Industry Analysis
Steel Manufacturing leads with 72.50% because ferroalloys remain essential for producing strong and reliable steel.
In 2025, Steel Manufacturing held a dominant market position, capturing more than a 72.50% share. By December 2025, the segment continued to lead because ferroalloys are widely used to improve steel strength, hardness, cleanliness, and resistance to wear and corrosion. Steel producers depend on manganese, silicon, chromium, and other alloying materials during melting and refining. Strong demand from construction, infrastructure, machinery, railways, energy equipment, and industrial fabrication supported regular ferroalloy consumption.
Automotive emerged as the growing segment in December 2025. Vehicle manufacturers increasingly used high-strength and specialty steels to reduce weight, improve safety, and extend component life. This trend supported rising ferroalloy use in body structures, engines, transmissions, suspension systems, and electric vehicle components globally.
Key Market Segments
By Type
- Silicon Manganese
- Ferrochrome
- Ferromanganese
- Ferrosilicon
- Ferronickel
- Others
By Product Category
- Bulk Ferroalloys
- Noble Ferroalloys
By Application
- Deoxidizer
- Alloying Element Additive
- Stainless Steel Production
- Desulfurizer
- Others
By End-Use Industry
- Steel Manufacturing
- Automotive
- Construction & Infrastructure
- Aerospace & Defense
- Others
Driver Analysis
Global Steel Production Expansion & Infrastructure-Led Demand
Ferroalloys derive approximately 83% of their end-use demand from the steel manufacturing sector, making global crude steel output the single most deterministic variable in ferroalloy market sizing. As of mid-2026, this foundational driver is reinforcing baseline CAGR by an estimated +2.2 percentage points, underpinned by a trifecta of structural demand signals: India’s steel consumption growing approximately 9% annually per World Steel Association projections, with domestic finished steel consumption in April 2026 registering 12.99 million tonnes up 8.1% YoY driven by construction, infrastructure, and manufacturing end-use; global crude steel demand for 2026 estimated at 1.72 billion tons, with a further 2.2% acceleration projected for 2027; and India’s total steel capacity reaching approximately 220 MTPA in FY 2025–26, firmly on track toward the National Steel Policy target of 300 MTPA by 2030.
The World Steel Association projects that developing economies excluding China will log steel demand growth of 4.7% in 2026, while the US market is forecast to expand 1.7–1.8% supported by continued public infrastructure spending and policy-backed private-sector investment. This broad-based demand recovery directly translates to ferroalloy pull-through, as every tonne of crude steel production requires approximately 10–15 kg of ferroalloys as deoxidants, grain refiners, and alloying agents structural offtake that cannot be substituted in conventional blast furnace and basic oxygen furnace routes. India’s crude steel production in May 2026 stood at 14.21 million tonnes, up 2.9% YoY, with sustained momentum from construction, automotive, and capital goods sectors, providing clear near-term volume signal for ferro manganese, ferrosilicon, and ferro silico manganese producers operating within the subcontinent and export-linked Asian markets.
Drivers Impact Analysis
| Driver | (~) % Impact on CAGR Forecast | Geographic Relevance | Impact Timeline |
|---|---|---|---|
| Global Steel Production Expansion & Infrastructure-Led Demand | +2.2% | APAC core (China, India); MENA spill-over; North America & EU moderate recovery | Short–Medium term (1–4 years) |
| CBAM Full Implementation & Green Ferroalloy Premium Regime | +1.5% | EU definitive zone; South Asia & Africa supply-side response; North America adjacency | Short–Medium term (1–3 years) |
| Stainless Steel & Specialty Alloy Demand Surge | +1.3% | APAC (India, China, South Korea); North America aerospace corridor; EU stainless belt | Medium term (2–5 years) |
| Renewable Energy Infrastructure Build-Out | +1.0% | APAC (India 500 GW target); EU Green Deal corridors; North America IRA-backed capex | Medium term (2–4 years) |
| Industry 4.0 & AI-Driven Furnace Optimization | +0.7% | East Asia manufacturing hubs; EU efficiency mandates; North America smart-plant initiatives | Medium–Long term (3–6 years) |
| Vertical Integration & Supply Chain Reshoring | +0.5% | Global; concentrated in APAC, MENA, and Southern Africa raw material zones | Long term (≥ 4 years) |
Restraint Analysis
Carbon compliance costs
The EU’s CBAM moves into its definitive regime in 2026 after the 2023–2025 transition period, requiring importers above the threshold to purchase CBAM certificates linked to EU ETS pricing and annually surrender embedded-emissions coverage and supplier-data requirements for carbon-intensive metal value chains feeding Europe.
For ferroalloy-adjacent steel inputs and covered upstream categories, the commercial effect is not just the certificate outlay itself but the full landed-cost uplift from emissions accounting, verification systems, contract redesign, and non-compliance exposure that can run to penalties of 10–50 EUR per tonne of unreported emissions, meaning exporters with coal-heavy power mixes face a margin haircut that can easily equal 2%–5% of invoice value on Europe-bound business, slow booking velocity, and delay debottlenecking CapEx until carbon pass-through mechanisms are proven, supporting a modeled 1.1 percentage-point CAGR drag across EU-linked trade lanes.
Restraint Impact Analysis
| Restraint | (~) % Impact on CAGR Forecast | Geographic Relevance | Impact Timeline |
|---|---|---|---|
| Power tariff inflation | -1.4% | South Africa core, India core, EU | Short term (≤ 2 years) |
| Carbon compliance costs | -1.1% | EU, Turkey-to-EU, India-to-EU, MENA-to-EU | Medium term (2-4 years) |
| Ore supply concentration | -0.9% | Gabon-linked APAC, India, EU, China | Medium term (2-4 years) |
| Steel demand substitution | -0.8% | EU, North America, mature APAC | Long term (≥ 4 years) |
| Freight and corridor volatility | -0.7% | EU imports, Middle East, APAC corridors | Short term (≤ 2 years) |
| Working-capital squeeze | -0.6% | Emerging-market exporters, SMEs in APAC and Africa | Short term (≤ 2 years) |
Opportunity Analysis
African beneficiation roll-up
This is a future strategic pivot because current market growth mostly reflects trading of ore and standard alloys, whereas the larger upside sits in consolidating underutilized African ore positions, power-linked smelting assets, and export infrastructure into regional beneficiation platforms that capture more value before material leaves the continent. South Africa remains structurally advantaged by dominant manganese resources and major chrome relevance, while policy direction explicitly aims to support domestic beneficiation and streamline junior-miner permitting, creating a rare setup for M&A roll-ups, mine-to-smelter integration, and brownfield restarts.
If a regional consolidator acquires distressed or subscale assets at 4-6 times EBITDA, lifts utilization from 55-65% to 80-85%, and captures logistics and procurement synergies worth 6-9% of cost of goods sold, the platform could generate 12-18% IRRs and add about +2.1 percentage points to sector CAGR by converting fragmented supply into export-grade alloy hubs for India, the Middle East, and Europe rather than remaining trapped in low-margin ore shipment models
Opportunity Impact Analysis
| Opportunity | (~) % Potential CAGR Upside | Geographic Relevance | Execution Window |
|---|---|---|---|
| Green alloy premium platforms | +1.6% | EU, China, North America core | Short term (≤ 2 years) |
| Battery-grade manganese pivot | +2.4% | South Africa, Gabon, China, EU, US | Medium term (2-4 years) |
| Silicon-alloy adjacency expansion | +1.8% | China, India, North America, EU | Medium term (2-4 years) |
| Slag and circular recovery monetization | +1.3% | EU, North America, India, China | Short term (≤ 2 years) |
| African beneficiation roll-up | +2.1% | South Africa core, Zimbabwe, Zambia, Middle East | Medium term (2-4 years) |
| Low-carbon alloy offtake integration | +1.9% | EU, India, ASEAN, North America | Long term (≥ 4 years) |
Challenges Analysis
Skilled Smelter Talent Deficit
Typical projections such as the World Economic Forum’s indicated 40% skills gap by 2027 across enterprises and observed Baby Boomer retirement rates of about 10,000 persons per day point to a thinning pool of experienced technical staff, which in ferroalloys translates into measurable operational penalties: furnace availability can be 2–4 percentage points lower in plants with inexperienced teams, defect rates in tapping and burden management can push recoveries down by 1.5–3.0%, unplanned downtime can increase by 10–20% due to preventable maintenance errors, and ramp-up timelines for new capacity may extend by 3–6 months relative to fully staffed benchmarks.
Companies are responding by implementing skills-first hiring, cross-border recruitment, in-house academies, OEM-led training programs, and greater automation in furnace monitoring and control systems, but because tacit knowledge in pyrometallurgy takes years to build and demographic trends cannot be reversed quickly, this remains a long-horizon friction with an estimated -0.6 percentage point drag on the market’s maximum growth potential.
Challenges Impact Analysis
| Challenge | (~) % CAGR Friction Drag | Geographic Relevance | Mitigation Horizon |
|---|---|---|---|
| Volatile power economics | -1.2% | India alloy belt, EU smelting hubs, South Africa, US localized | Medium term (2-4 years) |
| Raw material cost swings | -1.0% | India clusters, APAC import corridors, EU import-dependent | Medium term (2-4 years) |
| Regulatory & trade uncertainty | -0.8% | EU regulatory hubs, Russia-adjacent routes, global exporters | Long term (≥ 4 years) |
| Logistics & infrastructure gaps | -0.7% | India inland, APAC ports, African export nodes | Short term (≤ 2 years) |
| Decarbonization yield penalty | -0.9% | China green pilots, EU high-spec plants, export-oriented units | Long term (≥ 4 years) |
| Skilled smelter talent deficit | -0.6% | India expansion, South Africa legacy, SEA new capacity | Long term (≥ 4 years) |
Geopolitical Impact Analysis
The Russia-Ukraine War and the Ferroalloys Market
The current conflict between Russia and Ukraine is a major disruptor, changing trade routes, pricing baselines, and supply vulnerabilities in the global ferroalloys market. Previously positioned as significant upstream exporters of vital bulk and specialty alloys, both states have seen their production and logistical networks severely changed by targeted military actions and international economic reprisal.
Localized frontline wars in Ukraine, as well as continuous energy infrastructure degradation, have directly harmed domestic smelting capacity. Massive processing operations, including big Ukrainian silicomanganese and ferromanganese factories, frequently drop to minimal capabilities or come to a complete halt as a result of severe localized electricity shortages and unsustainable power rates. Concurrently, damaged rail links and frontline transport bottlenecks have reduced regional export volumes to historic lows, interrupting supplies to important consumer countries such as Poland, Turkey, and Italy.
Regional Analysis
Asia Pacific Held the Largest Share of the Global Ferroalloys Market.
The Asia-Pacific region accounted for a leading 52.8% share in the global ferroalloys market. This clear dominance is driven directly by the massive concentration of primary crude steel manufacturing hubs, rapid urbanization, and extensive civil infrastructure developments across the territory. According to the World Population Review’s demographic and economic findings, Asia-Pacific is home to more than 60% of the world’s human population, with nations such as India and China leading the way in growing population concentration and megacity expansion.
The region’s overwhelming supremacy is bolstered by its easy access to low-cost mineral riches and extremely advantageous government manufacturing projects. Upstream mining operations and massive localized submerged arc furnace installations across major regional corridors, such as China’s inner manufacturing provinces and India’s mineral-rich eastern belt, benefit from vertically integrated supply chains that protect refiners from external logistical shocks. Furthermore, the rapid expansion of industrial production programs in growing Southeast Asian nations produces a highly localized, insatiable need for heavy alloying elements.
Key Regions and Countries Covered
- North America
- The US
- Canada
- Europe
- Germany
- France
- The UK
- Spain
- Italy
- Russia & CIS
- Rest of Europe
- APAC
- China
- Japan
- South Korea
- India
- ASEAN
- Rest of APAC
- Latin America
- Brazil
- Mexico
- Rest of Latin America
- Middle East & Africa
- GCC
- South Africa
- Rest of MEA
Key Players Analysis
The global ferroalloys market exhibits a highly consolidated, oligopolistic structure where the market is controlled by a small number of leading global players. Market concentration is particularly strong across bulk alloy divisions, where massive initial capital expenditures and significant energy access barriers prevent smaller competitors from entering the market. The top market leaders control significant portions of worldwide output by running tightly integrated operations that include everything from raw manganese and chromium ore mines to high-capacity submerged arc furnace plants.
In contrast, the specialty noble ferroalloy segments of ferrovanadium, ferromolybdenum, and ferrotungsten exhibit more fragmented and competitive behavior, as do limited downstream processing corridors. In these technological niches, multiple medium-sized refiners and secondary recycling operators fight for market share using product purity, chemical precision, and tailored formulation criteria rather than sheer volume scale. In these regions, various independent local smelters use their closeness to regional steel mills and different localized power subsidies to compete with worldwide suppliers.
Market Key Players
- Glencore plc
- Eurasian Resources Group (ERG)
- Tsingshan Holding Group Co., Ltd.
- Samancor Chrome
- Erdos Group
- Jiangsu Delong Nickel Industry Co., Ltd.
- Nikopol Ferroalloy Plant
- Shandong Xinhai Technology Co., Ltd.
- OM Holdings Ltd.
- Sakura Ferroalloys Sdn. Bhd.
- Vale S.A.
- Tata Steel Limited
- ArcelorMittal S.A.
- China Minmetals Corporation
- OFZ, a.s.
- Ferro Alloys Corporation Limited (FACOR)
- Georgian American Alloys, Inc.
- Gulf Ferroalloys Company (SABAYEK)
- Outokumpu Oyj
- Sheng Yan Group
- Others
Key Development
- In May 2026, Vale advanced production agreements with the U.S. DOE, which published NEPA compliance reviews for Phase 1 of its industrial briquette facility using cold-agglomeration technology to supply low-carbon inputs for high-strength steel-making.
- In May 2026, Glencore signed a follow-on strategic collaboration and equity investment agreement with Chilean Cobalt Corp (C3), officially disclosed in U.S. SEC filings. The agreement strengthens Glencore’s strategic position in critical mineral supply chains.
Report Scope
| Report Features | Description |
|---|---|
| Market Value (2025) | USD 60.8 Bn |
| Forecast Revenue (2035) | USD 146.2 Bn |
| CAGR (2026-2035) | 9.2% |
| Base Year for Estimation | 2025 |
| Historic Period | 2020-2024 |
| Forecast Period | 2026-2035 |
| Report Coverage | Revenue Forecast, Market Dynamics, Competitive Landscape, Recent Developments |
| Segments Covered | By Type (Silicon Manganese, Ferrochrome, Ferromanganese, Ferrosilicon, Ferronickel, Others), By Product Category (Bulk Ferroalloys, Noble Ferroalloys), By Application (Deoxidizer, Alloying Element Additive, Stainless Steel Production, Desulfurizer, Others), By End-Use Industry (Steel Manufacturing, Automotive, Construction & Infrastructure, Aerospace & Defense, Others) |
| Regional Analysis | North America – The US & Canada; Europe – Germany, France, The UK, Spain, Italy, Russia & CIS, Rest of Europe; APAC– China, Japan, South Korea, India, ASEAN & Rest of APAC; Latin America– Brazil, Mexico & Rest of Latin America; Middle East & Africa– GCC, South Africa, & Rest of MEA |
| Competitive Landscape | Glencore plc, Eurasian Resources Group (ERG), Tsingshan Holding Group Co. Ltd., Samancor Chrome, Erdos Group, Jiangsu Delong Nickel Industry Co. Ltd., Nikopol Ferroalloy Plant, Shandong Xinhai Technology Co. Ltd., OM Holdings Ltd., Sakura Ferroalloys Sdn. Bhd., Vale S.A., Tata Steel Limited, ArcelorMittal S.A., China Minmetals Corporation, OFZ a.s., Ferro Alloys Corporation Limited (FACOR), Georgian American Alloys Inc., Gulf Ferroalloys Company (SABAYEK), Outokumpu Oyj, Sheng Yan Group, Others |
| Customization Scope | Customization for segments, region/country-level will be provided. Moreover, additional customization can be done based on the requirements. |
| Purchase Options | We have three licenses to opt for: Single User License, Multi-User License (Up to 5 Users), Corporate Use License (Unlimited Users and Printable PDF) |





































