
Quick Navigation
Report Overview
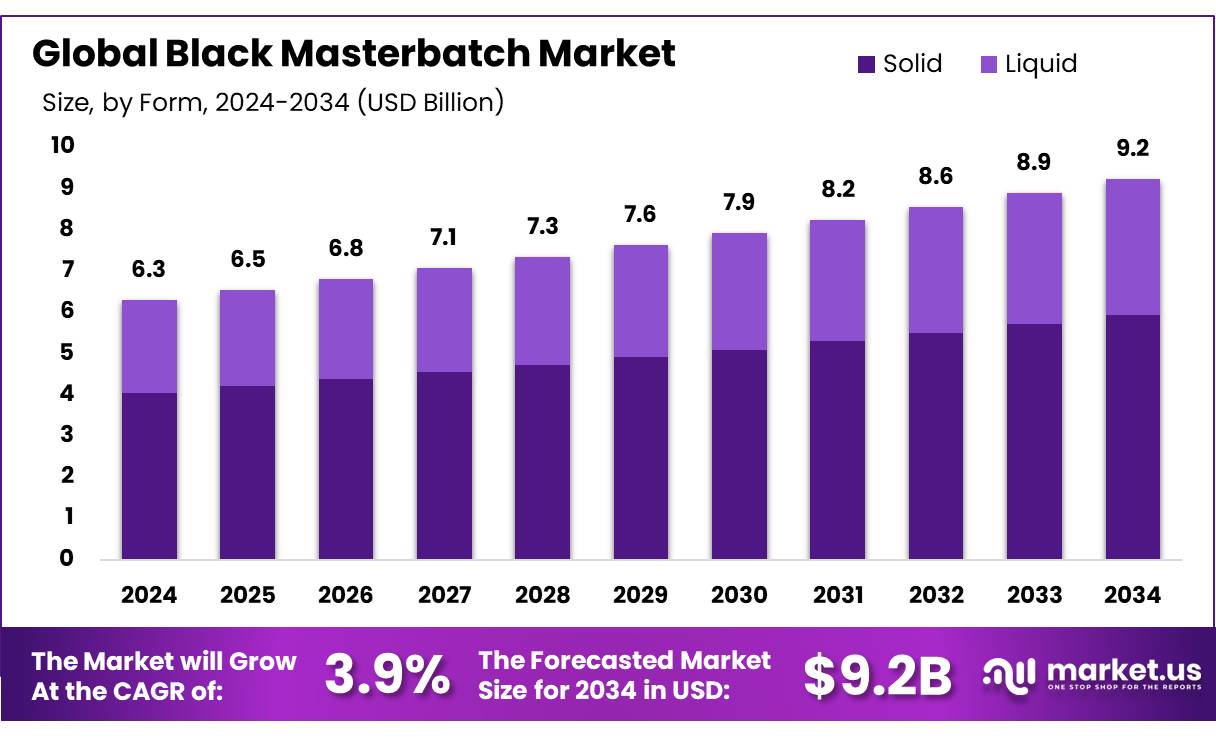
The Global Black Masterbatch Market size is expected to be worth around USD 6.2 Bn by 2034, from USD 9.2 Bn in 2024, growing at a CAGR of 3.9% from 2025 to 2034.
Black masterbatch is a concentrated blend of carbon black, a powerful pigment, and carrier resins. Widely used in the plastic industry to provide deep black colour and enhance the functional properties of plastic products. Black masterbatch offers a cost-effective solution for colouring plastic resins while enhancing their mechanical, electrical, and UV-resistant properties.
It provides deep pigmentation, UV protection, heat reduction, and improved opacity, making products more durable and visually appealing. Widely used in automotive, electronics, construction, packaging, and agriculture, it ensures longevity and reliability across various applications. Its versatility and functional benefits drive steady demand in multiple industries.
The global black masterbatch market is growing steadily due to rising demand for durable, UV-resistant plastic products across industries like automotive, electronics, construction, and packaging. Companies are increasingly using black masterbatch to enhance product performance, longevity, and aesthetics. Its cost-effectiveness and versatility make it an essential component in plastics manufacturing. With continued demand for high-quality plastic products, the black masterbatch market is expected to expand, offering significant opportunities for manufacturers and suppliers.
- Black masterbatch is an essential additive in the plastic industry, comprising a high concentration of carbon black, usually ranging from 15% to 50%.
Key Takeaways
- The global black masterbatch market was valued at USD 6.3 Billion in 2024.
- The global Black Masterbatch market is projected to grow at a CAGR of 3.9 % and is estimated to reach USD 9.2 Billion by 2034.
- Among Forms, Solid accounted for the largest market share of 64.3%.
- Among Polymer Types, Polypropylene (PP) accounted for the majority of the market share at 29.4%.
- By Application, Blow Molding accounted for the largest market share at 34.1%.
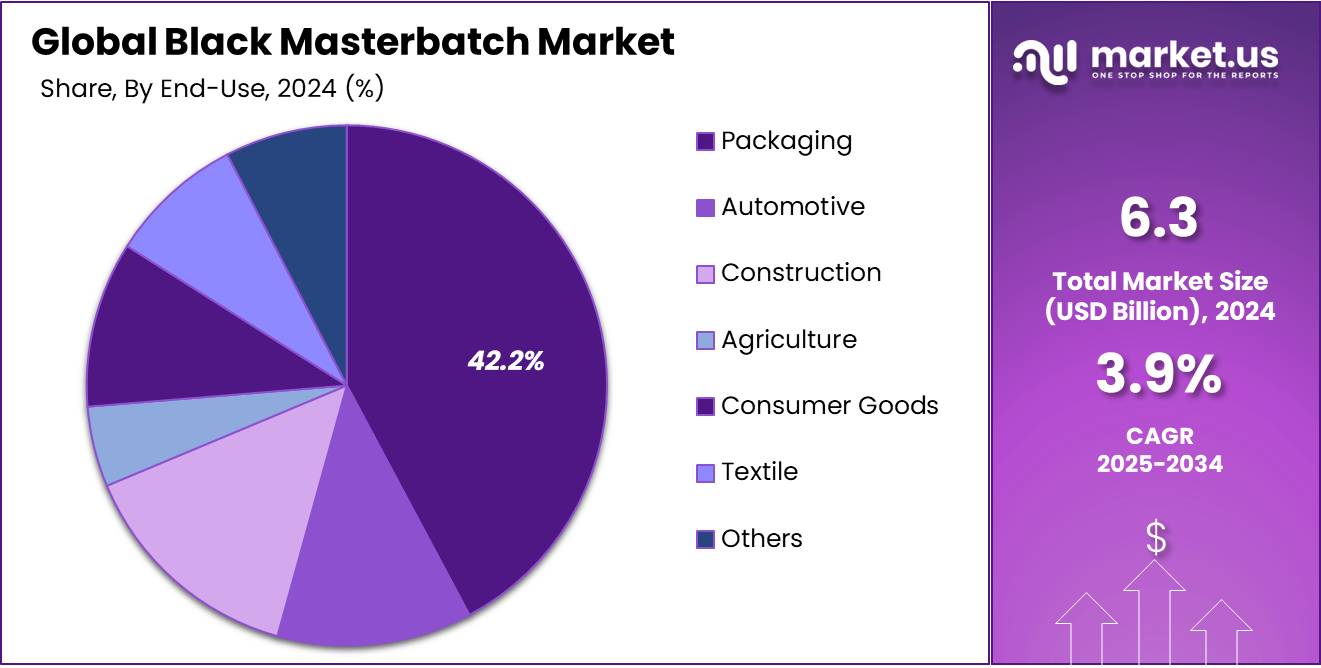
- By End-Used, Packaging accounted for the majority of the market share at 42.2%.
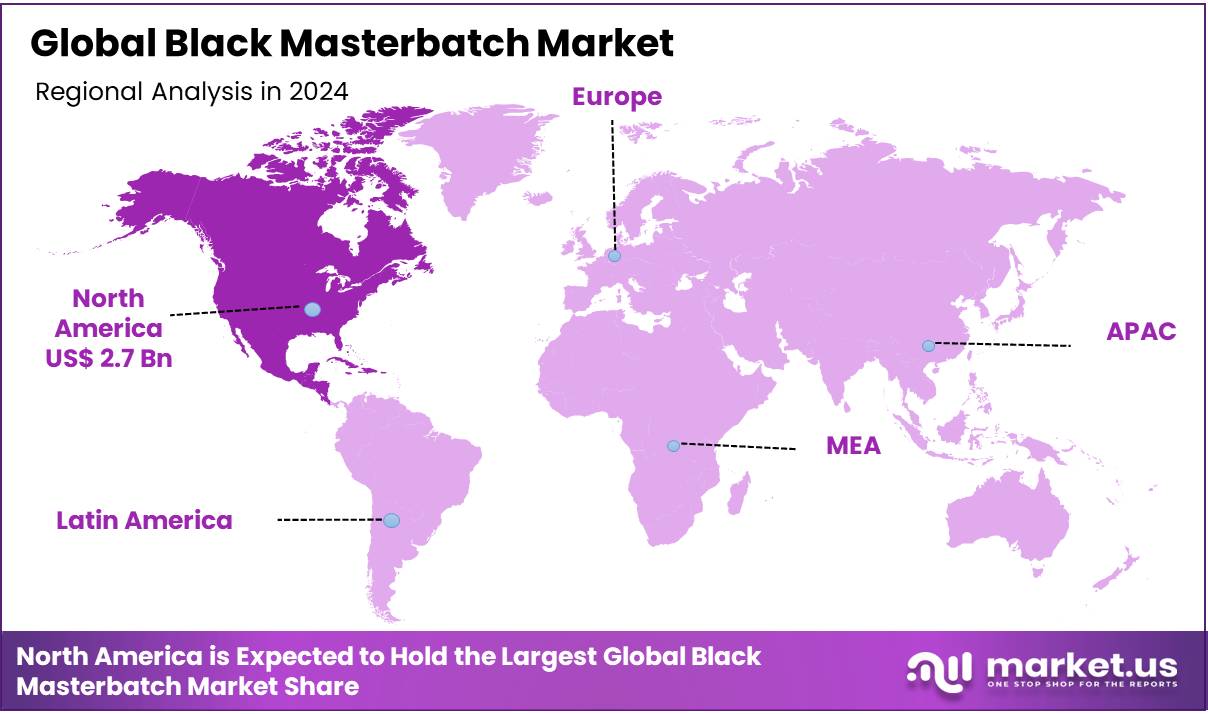
- North America is estimated as the largest market for Black Masterbatch with a share of 43.4% of the market share.
Forms Analysis
The Solid Form Segment Of The Black Masterbatch Market Dominates Due To Its Wide Application In Plastics And Packaging.
The black masterbatch market is segmented based on form into Solid, and Liquid. In 2024, the solid segment held a significant revenue share of 64.3%. Due to its widespread application in various industries, including plastics and packaging, where solid masterbatches offer ease of handling, stability, and compatibility with different polymers. Additionally, solid black masterbatches are cost-effective, versatile, and widely preferred for their consistent performance in producing high-quality black products.
Polymer Type Analysis
Polypropylene (PP) leads the Black Masterbatch Market Share, Driven By Its Versatility And Strong Demand In The Packaging And Automotive Industries.
Based on Polymer types, the market is further divided into Polypropylene (PP), Polyethylene, Polyvinyl Chloride (PVC), Polyethylene Terephthalate (PET), Polyamide (PA), Acrylonitrile Butadiene Styrene (ABS), Polystyrene (PS), Polyurethane (PUR), Others. The predominance of the Polypropylene (PP), commanding a substantial 29.4% market share in 2024. Due to its versatility, cost-effectiveness, and widespread use in various industries such as packaging, automotive, and textiles. PP offers excellent chemical resistance, durability, and ease of processing, making it a preferred choice for a wide range of applications.
Application Analysis
Blow Molding will dominate the Black Masterbatch market, driven by its efficiency, low waste, and suitability for large-volume plastic products.
Based on application, the market is further divided into Blow Molding, Roto Molding, Extrusion, Injection Molding, and Others. The predominance of the Blow Molding, commanding a substantial 34.1% market share in 2024. Due to its widespread use in the production of large-volume, hollow plastic products such as bottles and containers.
Blow molding offers advantages like high production efficiency, low material waste, and the ability to create complex shapes, which makes it ideal for industries such as beverages, pharmaceuticals, and consumer goods. Its cost-effectiveness and ability to produce lightweight yet durable products further contribute to its dominance in the market.
End-Use Analysis
Packaging dominates the Black Masterbatch market with a 42.20% share in 2024, driven by high demand for durable and cost-effective materials.
Based on End-Use, the market is further divided into Packaging, Automotive, Construction, Agriculture, Consumer Goods, Textile, and Others. The predominance of the Packaging commanding a substantial 42.2% market share in 2024. Due to the high demand for materials used in the packaging of food, beverages, and consumer products.
Packaging requires materials that are durable, versatile, and cost-effective, with black masterbatch being widely used to enhance the color, opacity, and UV protection of packaging products. The growth of e-commerce, increasing consumer demand for sustainable packaging, and the need for visually appealing packaging solutions further drive the dominance of packaging in the market.
Key Market Segments
By Form
- Solid
- Liquid
By Polymer Type
- Polypropylene (PP)
- Polyethylene (PE)
- LDPE
- LLDPE
- HDPE
- Polyvinyl Chloride (PVC)
- Polyethylene Terephthalate (PET)
- Polyamide (PA)
- Acrylonitrile Butadiene Styrene (ABS)
- Polystyrene (PS)
- Polyurethane (PUR)
- Others
By Application
- Blow Molding
- Roto Molding
- Extrusion
- Injection Molding
- Others
By End-use
- Packaging
- Rigid Packaging
- Flexible Packaging
- Automotive
- Interior
- Exterior
- Construction
- Pipes & Fittings
- Doors & Windows
- Fences & Fenestrations
- Siding
- Others
- Agriculture
- Consumer Goods
- Textile
- Others
Drivers
Growing Plastic Consumption In The Automotive Industry
The growing use of plastics in the automotive industry is driving the demand for black masterbatch, which enhances both interior and exterior components. It provides deep pigmentation, UV stability, and mechanical strength, improving durability and reducing the weight of electric vehicle (EV) batteries. Used in parts like bumpers, dashboards, and body panels, black masterbatch helps improve aesthetics, safety, and long-lasting performance. As EVs continue to rise in popularity, the demand for black masterbatch is expected to increase, supporting the automotive industry’s need for sustainable, high-performance materials.
- In 2023, the average automobile contained 426 pounds of plastics and polymer composites, accounting for 9.6% of the vehicle’s total weight, an 18% increase from a decade ago. Key resins include 100 pounds of polypropylene, 85 pounds of polyurethane foam, 45 pounds of nylon, 33 pounds of high-density polyethylene, and 32 pounds of polyvinyl chloride, underscoring the growing importance of black masterbatch.
- According to the Electric Vehicle Council, with 85,319 EVs sold in Australia by September 2024 and a 150% increase in market share compared to 2022, lightweight EV sales are projected to reach approximately 110,000 units by the end of the year, this growing adoption of electric vehicles drives increased demand for plastics and black masterbatch.
Restraints
Heath Concerns Regarding Carbon Black Exposure
The negative health impacts of black masterbatch, especially due to its content of black carbon, are one of the key factors restraining the growth of the global black masterbatch market. Exposure to black carbon, a major component of particulate matter, can lead to lung diseases, respiratory issues, and an increased risk of cancer due to the presence of harmful substances like polycyclic aromatic hydrocarbons (PAHs). As industrial concerns over worker safety and public health grow, stricter regulations are being implemented, limiting the use of black carbon in various applications and pushing industries to seek safer alternatives.
- According to the Spartan Network reports, black carbon significantly contributes to particulate matter (PM) pollution, accounting for 5-25% of PM2.5 concentrations globally. This highlights the negative health impacts of black carbon, which could limit the growth of the global black masterbatch market as industries face increasing pressure to reduce harmful emissions and comply with stricter environmental regulations.
Opportunity
Boosting Geosynthetics Performance with Black Masterbatch
The growing demand for geosynthetics in construction, engineering, and environmental applications presents a significant opportunity for the global black masterbatch market. Black masterbatch enhances the durability, UV resistance, and thermal stability of geosynthetics like geotextiles, geomembranes, and geogrids. As applications such as landfill lining, water containment, and mining expand, the need for black masterbatch to improve performance and extend the lifespan of these materials continues to rise. This increasing reliance on black masterbatch for geosynthetics is expected to drive sustained market growth.
- According to the Confederation of Indian Industry, a 5% penetration of geosynthetics in road infrastructure could generate an Rs 50 billion market annually. This growth in geosynthetics demand will drive the need for black masterbatch, which is crucial for enhancing UV protection, thermal stability, and mechanical strength in materials like geomembranes and geotextiles.
Trends
Rising Trend of Matte Black Finishes in the Consumer Goods Industry
The rising trend of matte black finishes in consumer goods is fuelling the growth of the global black masterbatch market. As industries such as electronics, automotive, and household goods increasingly adopt matte black designs, the demand for black masterbatches is on the rise. Known for its deep pigmentation, durability, and UV protection, black masterbatch offers several advantages, including heat dissipation and enhanced product performance. This trend is especially notable in products ranging from smartphones and home appliances to automotive parts. As matte black finishes continue to gain traction, the global demand for black masterbatch is expected to see a substantial increase, providing a significant opportunity for future market expansion.
Geopolitical Impact Analysis
Geopolitical Tensions and Trade Tariffs Have Disrupted Supply Chains And Increased Costs, Impacting The Black Masterbatch Market.
Recent geopolitical events, such as the ongoing Russia-Ukraine conflict and the trade tariffs imposed by President Trump, have had a significant impact on the black masterbatch market. The Russia-Ukraine conflict has disrupted supply chains, leading to shortages and price volatility, particularly in carbon black, a key component in masterbatch production. This has contributed to higher prices for black masterbatch, as the cost of raw materials such as oil and natural gas, which are critical for carbon black production, has risen.
Furthermore, the global masterbatch market is reliant on imports from countries such as Switzerland, Germany, Taiwan, and India. This dependence on international suppliers makes the market vulnerable to fluctuations in global trade and economic conditions. Additionally, the automotive industry’s demand for black masterbatch, particularly in the production of rubber components like tires, remains robust. These geopolitical tensions and tariff uncertainties present challenges in maintaining consistent growth and market stability.
- For instance, President Donald Trump’s proposed 25% tariffs on auto parts and vehicles from Canada and Mexico could disrupt North America’s automotive sector, potentially affecting $300 billion in U.S. trade. These tariffs might result in higher vehicle prices and disrupt existing supply chains, indirectly impacting the demand for masterbatch materials used in automotive production.
Regional Analysis
North America’s Strong Manufacturing Base And High Demand From Industries Such As Automotive, Electronics, And Packaging Drive Its Dominance In The Global Black Masterbatch Market.
In 2024, North America dominated the global Black Masterbatch market, accounting for 43.40% of the total market share, Driven by strong demand from key industries such as automotive, electronics, packaging, and construction. The region’s advanced manufacturing capabilities and technological advancements have provided companies to support black masterbatch for high-performance applications, ensuring both functional and aesthetic benefits.
The automotive sector heavily depends on black masterbatch to produce durable and visually appealing vehicle components, such as bumpers, dashboards, and trims. This demand is further supported by the increasing trend toward sleek and modern designs in vehicles.
In the electronics industry, North America remains a key player due to its technological innovation and the growing demand for consumer electronics, where black masterbatch is used for components like housings and screens, ensuring UV protection, durability, and sleek finishes. The packaging sector also contributes significantly to the region’s dominance, as black masterbatch is widely used in flexible packaging, especially in food and beverage industries, for its UV resistance and aesthetic appeal.
Additionally, in the construction and geosynthetics sectors, North America’s demand for black masterbatch is driven by its use in products like pipes, roofing materials, and landfills, where durability, UV protection, and longevity are crucial. These industries, combined with North America’s strong manufacturing and R&D capabilities, position the region as a dominant force in the global black masterbatch market, driving both demand and innovation across various sectors.
- According to the reports published by Oberlo, it is stated that 97.6% of U.S. consumers own a smartphone, marking a 1.2% increase from 2023. This growing smartphone ownership is significantly boosting the demand for black masterbatch in North America, as it is widely used in manufacturing smartphone components like housings and screens, providing UV protection, durability, and sleek finishes.
Key Regions and Countries
- North America
- The US
- Canada
- Europe
- Germany
- France
- The UK
- Spain
- Italy
- Russia & CIS
- Rest of Europe
- APAC
- China
- Japan
- South Korea
- India
- ASEAN
- Rest of APAC
- Latin America
- Brazil
- Mexico
- Rest of Latin America
- Middle East & Africa
- GCC
- South Africa
- Rest of MEA
Key Players Analysis
Key players in the Black Masterbatch market focus on product innovation, sustainability, geographical expansion, cost leadership, and customer-centric strategies to maintain dominance.
Key players in the Black Masterbatch market are focusing on product innovation by developing advanced, high-performance solutions with enhanced properties such as better UV protection and dispersion. They are also prioritizing sustainability initiatives by shifting towards eco-friendly and recyclable products to meet growing environmental demands.
Additionally, geographical expansion through strategic partnerships and acquisitions helps tap into emerging markets. Companies are leveraging cost leadership strategies to optimize production efficiency and offer competitive pricing, while also adopting a customer-centric approach by providing tailored solutions for various industries.
Major Players in the Industry
- Cabot Corporation
- LyondellBasell Industries Holdings B.V.
- Clariant AG
- Avient Corporation
- Ampacet Corporation
- Plastika Kritis S.A.
- Hubron International
- Tosaf Group
- RTP Company
- Plastiblends
- Blend Colours
- Penn Color Inc.
- Americhem
- Broadway
- Global Colors Group
- Other Key Players
Recent Development
- In July 2024-Black Swan Graphene launched its fourth commercial Graphene Enhanced Masterbatch (GEM) product, a thermoplastic polyurethane (TPU) masterbatch, as part of its GraphCore 01 product line. This new GEM demonstrates a 25% improvement in light-weighting capabilities and enhanced mechanical performance, with commercial interest from various industries, including clothing and sporting goods.
- In June 2024- Cabot expanded its Replasblak product family with two new grades of universal circular black masterbatches, designed for automotive applications including interior, exterior, and under-the-hood parts. These new grades, made from ISCC Plus-certified materials, offer high gloss and superior color performance while supporting sustainability through the use of recycled polymers. The new grades, Replasblak reUN5285 and reUN5290 enhance Cabot’s commitment to providing sustainable, high-performance solutions for the automotive industry.
Report Scope
| Report Features | Description |
|---|---|
| Market Value (2024) | USD 6.3 Bn |
| Forecast Revenue (2034) | USD 9.2 Bn |
| CAGR (2025-2034) | 3.9% |
| Base Year for Estimation | 2024 |
| Historic Period | 2020-2023 |
| Forecast Period | 2025-2034 |
| Report Coverage | Revenue Forecast, Market Dynamics, Competitive Landscape, Recent Developments |
| Segments Covered | By Form (Solid, Liquid), By Polymer Type (Polypropylene (PP), Polyethylene (LDPE, LLDPE, HDPE), Polyvinyl Chloride (PVC), Polyethylene Terephthalate (PET), Polyamide (PA), Acrylonitrile Butadiene Styrene (ABS), Polystyrene (PS), Polyurethane (PUR)), By Application (Blow Molding, Roto Molding, Extrusion, Injection Molding), By End-Use (Packaging (Rigid Packaging, Flexible Packaging), Automotive (Interior, Exterior), Construction (Pipes & Fittings, Doors & Windows, Fences & Fenestrations, Siding), Agriculture, Consumer Goods, Textile, Others), |
| Regional Analysis | North America – The US & Canada; Europe – Germany, France, The UK, Spain, Italy, Russia & CIS, Rest of Europe; APAC- China, Japan, South Korea, India, ASEAN & Rest of APAC; Latin America- Brazil, Mexico & Rest of Latin America; Middle East & Africa- GCC, South Africa, & Rest of MEA |
| Competitive Landscape | Cabot Corporation, LyondellBasell Industries Holdings B.V., Clariant AG, Avient Corporation, Ampacet Corporation, Plastika Kritis S.A., Hubron International, Tosaf Group, RTP Company, Plastiblends, Blend Colours, Penn Color Inc., Americhem, Broadway, Global Colors Group, Other Key Players |
| Customization Scope | Customization for segments, region/country-level will be provided. Moreover, additional customization can be done based on the requirements. |
| Purchase Options | We have three licenses to opt for: Single User License, Multi-User License (Up to 5 Users), Corporate Use License (Unlimited User and Printable PDF) |


