


Report Overview
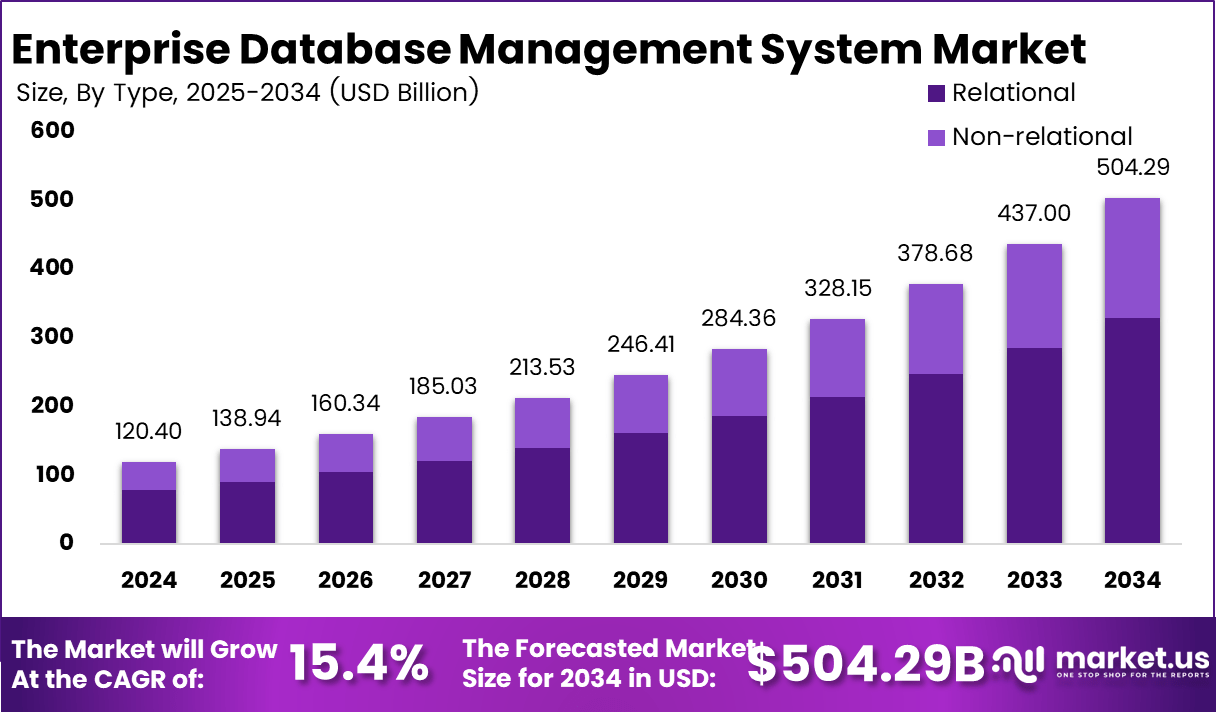
In 2024, the Global Enterprise Database Management System Market was valued at USD 120.4 billion. The market is projected to grow at a CAGR of 15.4% during 2025–2034, reaching approximately USD 504.2 billion by 2034. North America dominated the global market in 2024, accounting for the total market share and generating approximately USD 45.2 billion in revenue. Growth is being driven by rising business data from digital sales, cloud systems, AI tools, and connected enterprise operations.
The U.S. digital economy generated USD 2.6 trillion in 2022, equal to 10.0% of national GDP, and expanded 6.3% in real terms compared with 1.9% growth for the overall economy. Electronic shopping and mail-order sales also increased 9.5% to USD 1.117 trillion in 2022, creating more database activity across inventory, payments, customer records, fulfilment, and returns.
North America region accounted for 27% of connected global data centers in 2022, while U.S. data-hosting infrastructure investment reached USD 41 billion in 2021, after increasing 60% from 2018. AI adoption is creating another strong demand layer for enterprise databases. Among firms with 10 or more employees, AI use across OECD countries increased from 5.6% in 2020 to 14.0% in 2024. This growth is increasing demand for secure, scalable DBMS platforms, data integration, backup, database security, and performance-management tools.
Key Takeaways
- The Global Enterprise Database Management System (DBMS) Market was valued at USD 120.4 billion in 2024 and is projected to reach USD 504.2 billion by 2034, growing at a 15.4% CAGR.
- Relational databases led the type segment with a 65.4% share due to strong transaction control and reliability for regulated records.
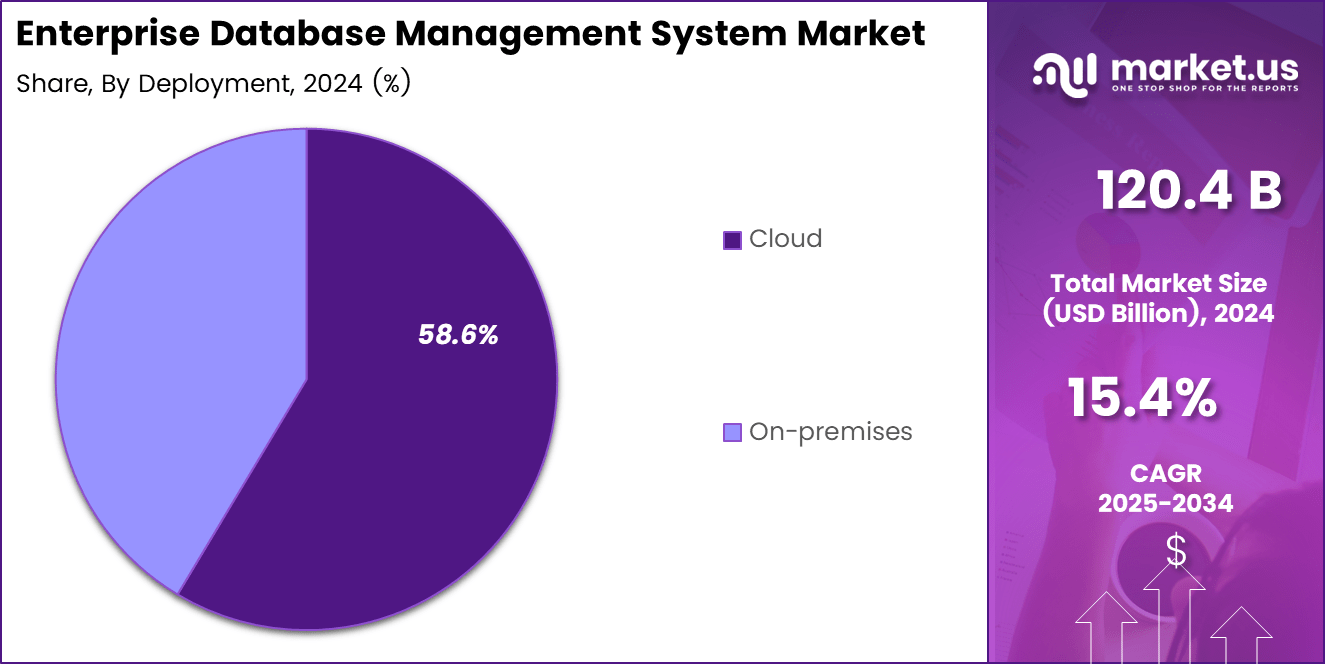
- Cloud deployment dominated with a 58.6% share, supported by flexible capacity, scalability, and remote data access.
- Large Enterprises accounted for 75.2% of the market due to complex global operations and strict data-management requirements.
- BFSI led the vertical segment with a 29.5% share, driven by high transaction volumes and stringent compliance needs.
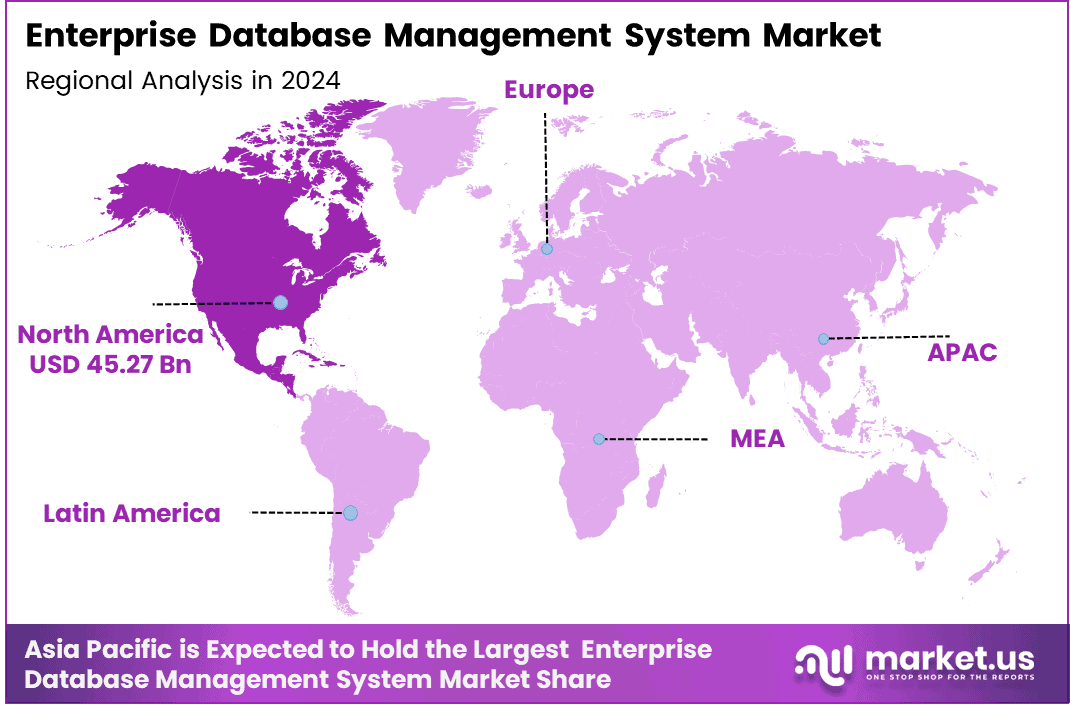
- North America dominated the market in 2024, generating approximately USD 45.2 billion in revenue.
By Type
Relational dominates with 65.4% due to proven transaction control for regulated records.
Relational databases lead the type segment because banks, retailers, public agencies, and large employers need fixed data fields, clear links between records, and accurate transaction controls. These systems help teams connect customer profiles, account balances, orders, invoices, stock levels, and audit records in one trusted structure.
The International Telecommunication Union counted 5.5 billion internet users in 2024, equal to 68% of the world population. This large online base creates more payments, service requests, account updates, and sales records that companies must process without error.
The World Bank reported that adults making or receiving digital payments in developing economies rose from 35% in 2014 to 57% in 2021. Such payment flows strengthen demand for relational systems because firms need consistent records for each customer and transaction.
By Deployment
Cloud dominates with 58.6% due to flexible capacity and remote data access.
Cloud deployment leads because it gives companies fast access to database capacity without requiring them to buy, install, and maintain all server hardware in their own sites. Eurostat found that 45.2% of EU enterprises bought cloud services in 2023, up 4.2 percentage points from 2021.
It also found that 43.0% of cloud-buying enterprises used cloud services to host their databases. These figures show that database workloads already form a major part of cloud spending. Cloud also ranks as the fastest-growing deployment option because businesses want quicker system launches and lower upfront technology costs.
Statistics Canada reported that 48% of Canadian businesses used cloud computing in 2023, compared with 45% in 2021. The information and cultural industries recorded the highest use rate, at 81%. Growing use in data-heavy sectors pushes more organizations toward managed cloud databases that providers can update, secure, back up, and scale.
By Organization Size
Large Enterprises dominate with 75.2% due to complex global operations and strict data controls.
Large enterprises hold the leading share because they manage many business units, customers, suppliers, employees, and systems across countries. They need enterprise DBMS platforms to combine core records, keep access controls, meet reporting rules, and support high transaction volumes across finance, sales, supply chains, and service teams. Eurostat reported that 41.17% of large EU enterprises used artificial intelligence in 2024, compared with 11.21% of small enterprises.
It also found that 78.44% of large enterprises employed ICT specialists, while only 14.04% of small enterprises did so. These gaps show why large firms spend more on advanced database tools: they have larger data teams, more software connections, and a greater need for secure data control. SMEs will grow fastest because cloud-based database services now reduce the cost and skill barrier that once limited adoption.
The U.S. Small Business Administration counted 34.8 million small businesses in the United States in 2024, employing 59.0 million people. This vast user base increasingly needs databases for online selling, customer service, payroll, stock tracking, and digital payments. Subscription pricing lets smaller firms start with limited capacity and add resources as activity grows. As more SMEs use AI, e-commerce, and digital accounting tools, they will require stronger database systems that connect these daily business records.
By Vertical
BFSI dominates with 29.5% due to high-volume transactions and strict compliance needs.
BFSI leads the vertical segment because banks, insurers, payment firms, and investment providers manage large volumes of high-value customer and transaction data every day. They need reliable databases to maintain account histories, process payments, calculate risk, detect fraud, support claims, and meet record-keeping rules. The Bank for International Settlements reported that annual cashless payments per person in advanced economies increased from 426 in 2021 to 468 in 2022.
In emerging and developing economies, the figure rose from 246 to 291 payments per person over the same period. Each additional payment adds data that financial firms must store, check, protect, and retrieve quickly. Retail and e-commerce will likely grow fastest because every online order creates a chain of database tasks, from product search and customer login to payment approval, delivery tracking, and returns.
UN Trade and Development estimated that business e-commerce sales across 43 economies approached USD 25 trillion in 2021 and increased a further 10% to almost USD 27 trillion in 2022. Retailers need scalable databases to update stock availability, personalize offers, manage supplier records, and prevent failed orders during busy sales periods. This direct link between rising online trade and transaction data will increase demand for cloud-ready and real-time DBMS platforms across retail operations.
Key Market Segments
By Type
- Relational
- Non-relational
By Deployment
- Cloud
- On-premises
By Organization Size
- Large Enterprises
- SMEs
By Vertical
- BFSI
- IT and Telecom
- Retail and E-commerce
- Healthcare and Life Sciences
- Government
- Manufacturing
- Media and Entertainment
- Others
Regional Analysis
In 2024, North America is expected to dominate the Enterprise Database Management System market, with a valuation of USD 45.27 billion. This is driven by the region’s advanced technological infrastructure, widespread adoption of cloud-based solutions, and high demand for secure and efficient data management systems across various industries, including finance, healthcare, and retail.
Additionally, North America’s strong regulatory frameworks, such as GDPR and HIPAA, create a need for robust database management systems. The presence of key players and the increasing reliance on big data analytics further contribute to North America’s market leadership.
US Market Size Analysis
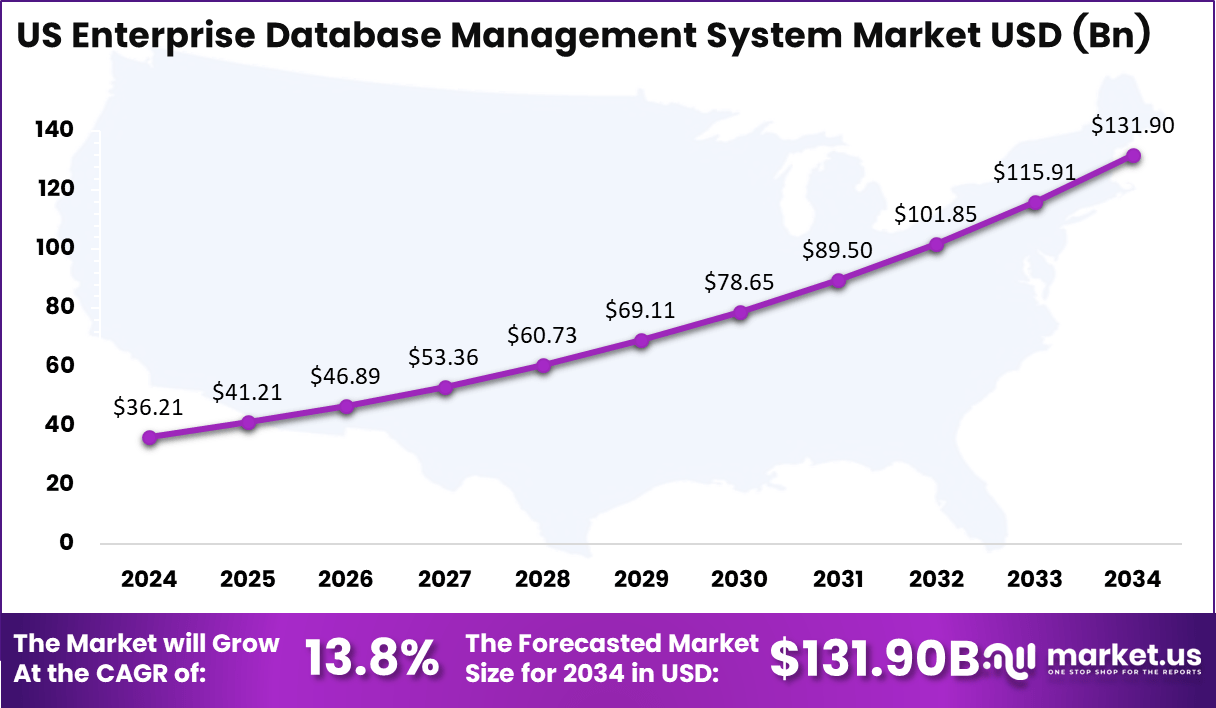
The US Enterprise Database Management System (DBMS) Market is projected to grow significantly from $36.21 billion in 2024 to $131.90 billion by 2034, driven by a CAGR of 13.8%. This growth is fueled by the ongoing digital transformation across industries, increasing cloud adoption, and the rising demand for data security and compliance.
As businesses embrace AI, big data, and machine learning, the need for scalable and efficient DBMS solutions intensifies, particularly in sectors like healthcare, finance, and retail. However, the market faces challenges, such as the high initial investment costs and the complexity of integrating new systems with legacy infrastructure.
Key Regions and Countries
North America
- US
- Canada
Europe
- Germany
- France
- The UK
- Spain
- Italy
- Rest of Europe
Asia Pacific
- China
- Japan
- South Korea
- India
- Australia
- Rest of APAC
Latin America
- Brazil
- Mexico
- Rest of Latin America
Middle East & Africa
- GCC
- South Africa
- Rest of MEA
Market Dynamics
Drivers
| Driver | (~) % Impact on CAGR Forecast | Geographic Relevance | Impact Timeline |
|---|---|---|---|
| Cloud-native database migration | +2.4% | Global | Short term (2 years or less) |
| Real-time transaction applications | +1.7% | North America, Asia Pacific | Short term (2 years or less) |
| AI workload data demand | +1.5% | North America, Europe | Medium term (2 to 4 years) |
| Data-sharing ecosystem expansion | +1.1% | Europe, Asia Pacific | Medium term (2 to 4 years) |
| Subscription software adoption | +0.9% | Global | Short term (2 years or less) |
Cloud-native database migration
Cloud-native database migration provides the largest current uplift because it converts periodic licence replacement into recurring consumption and managed-service spending. Eurostat recorded paid cloud-service use at 52.7% of EU enterprises in 2025, a gain of 7.4 percentage points from 2023, creating a wider installed base for managed database workloads.
According to Statistics Canada, 48% of Canadian businesses used cloud computing in 2023, while the information and cultural industries reached 81% adoption. The OECD also reported that AI use among firms with at least 10 employees rose from 5.6% in 2020 to 14.0% in 2024, increasing demand for scalable data storage and retrieval.
These shifts support an estimated +2.4% contribution to the 15.4% baseline CAGR by increasing database consumption, support renewals, and cross-selling of security, backup, and data-integration services.
Restraints
| Restraint | (~) % Impact on CAGR Forecast | Geographic Relevance | Impact Timeline |
|---|---|---|---|
| Sovereign-data compliance costs | -1.8% | Europe, Asia Pacific, Middle East | Short term (2 years or less) |
| Cloud budget approval limits | -1.3% | Global | Short term (2 years or less) |
| Export-control restrictions | -1.0% | United States, China, Asia Pacific | Medium term (2 to 4 years) |
| Legacy contract commitments | -0.9% | North America, Europe | Medium term (2 to 4 years) |
| Currency translation pressure | -0.7% | Latin America, Middle East & Africa | Short term (2 years or less) |
Sovereign-data compliance costs
Sovereign-data compliance creates the strongest near-term restraint because database providers and buyers must redesign data location, access, transfer, audit, and recovery processes before they can approve multinational deployments.
The European Commission confirms that the EU Data Act applied from 12 September 2025, adding switching, interoperability, and contractual requirements for data-processing services. Under the EU General Data Protection Regulation, the European Commission notes that serious violations can attract penalties of up to 4% of worldwide annual turnover.
These rules do not stop database demand, but they extend legal review, require local controls, and increase compliance engineering costs. The resulting approval delays and margin pressure support an estimated -1.8% drag against the baseline CAGR, particularly where enterprises operate across several legal jurisdictions.
Challenges
| Challenge | (~) % CAGR Friction Drag | Geographic Relevance | Mitigation Horizon |
|---|---|---|---|
| Data-center power constraints | -1.6% | North America, Europe, Asia Pacific | Long term (4 years or more) |
| Data engineering skills gap | -1.2% | Global | Medium term (2 to 4 years) |
| Hybrid system integration | -1.0% | Global | Medium term (2 to 4 years) |
| Cyber resilience burden | -0.9% | Global | Short term (2 years or less) |
| Data quality management | -0.8% | Global | Medium term (2 to 4 years) |
Data-center power constraints
Data-center power constraints create the largest ongoing operational friction because database capacity depends on facilities that can secure electricity, grid connections, cooling, and backup generation before new workloads can go live. The International Energy Agency reported that global data-center electricity demand grew 17% in 2025, while AI-focused data centers increased consumption by 50%.
The International Energy Agency projects total data-center electricity use will rise from 485 terawatt-hours in 2025 to roughly 950 terawatt-hours by 2030, or about 3% of global electricity demand. OECD analysis further indicates that about 90% of electricity used by data centers becomes low-grade waste heat.
This raises site-development costs, delays capacity delivery, and encourages providers to prioritize higher-margin workloads over lower-value database instances. The estimated -1.6% friction drag reflects constrained infrastructure availability rather than weaker customer demand, requiring long-term power contracts, energy-efficient database design, and geographically distributed capacity planning.
Opportunities
| Opportunity | (~) % Potential CAGR Upside | Geographic Relevance | Execution Window |
|---|---|---|---|
| Public-sector legacy modernization | +2.0% | Global | Medium term (2 to 4 years) |
| Vertical data service bundles | +1.5% | North America, Europe, Asia Pacific | Medium term (2 to 4 years) |
| Open-source support monetization | +1.3% | Global | Short term (2 years or less) |
| Emerging-market managed databases | +1.2% | Asia Pacific, Latin America, Africa | Long term (4 years or more) |
| Specialist platform consolidation | +1.1% | Global | Medium term (2 to 4 years) |
Public-sector legacy modernization
Public-sector legacy modernization remains future upside rather than a current driver because many agencies still procure and replace core systems through multi-year funding, tender, security-review, and implementation cycles. The World Bank’s GovTech Maturity Index covers 198 economies and evaluates public digital transformation through 48 indicators; its global average increased from 0.552 in 2022 to 0.589, showing progress but also a substantial implementation gap.
The United Nations assessed digital-government conditions across all 193 member states in its 2024 survey, indicating broad demand for dependable systems that can support digital public services. OECD data show that public procurement equaled 12.7% of GDP across member countries in 2023 and represented 29.9% of total government expenditure.
Providers can capture this white space by selling standardized migration, security, archive, and managed-operating packages that lower deployment effort and improve recurring-service margins. A reusable delivery model can reduce project-specific engineering hours and improve unit economics, supporting an estimated +2.0% upside to the baseline CAGR if procurement cycles convert into funded database modernization programs.
Key Players Analysis
Tier-1 leaders including AWS, Microsoft, Oracle, Google Cloud, SAP, and IBM are estimated to control around 56%–71% of enterprise DBMS spending. AWS likely holds 13%–16%, supported by about USD 129 billion in AWS sales in 2025, up 20% year on year.
Microsoft is estimated to hold 14%–17% of the market. Its Intelligent Cloud segment generated USD 106.3 billion in fiscal 2025, while Azure revenue exceeded USD 75 billion. Oracle likely represents 12%–15%, supported by USD 44.0 billion in cloud services and license-support revenue, up 12%.
Google Cloud is estimated to account for 7%–9% of enterprise DBMS spending. Its 2025 revenue increased by USD 15.5 billion, or 36%, while operating income reached USD 13.9 billion. These large vendors benefit from integrated cloud infrastructure, databases, AI services, security tools, and broad enterprise sales networks.
Tier-2 players such as Snowflake, MongoDB, Redis, and Teradata likely account for 6%–9% combined, while other providers retain roughly 20%–38%. Snowflake generated USD 4.7 billion in fiscal 2026 revenue, up from USD 3.6 billion, with a 125% net revenue retention rate. Teradata reported USD 1.492 billion in annual recurring revenue in Q1 2026, while SAP recorded EUR 21.02 billion in cloud revenue, up 23%, including EUR 18.12 billion from its cloud ERP suite.
Top Key Players
- Amazon Web Services
- Google Cloud
- International Business Machines Corporation
- Microsoft
- MongoDB, Inc.
- Oracle
- Redis
- SAP SE
- Snowflake Inc.
- Teradata
- Others
Recent Developments
- In January 2026, Snowflake signed an agreement to acquire Datometry’s database-migration technology. Snowflake stated that the technology can move legacy data-warehouse workloads up to 4 times faster and reduce migration costs by up to 90%, strengthening its ability to win migrations from Teradata and other older database systems.
- In February 2026, Oracle announced plans to raise USD 45–50 billion in gross cash proceeds during 2026 to expand Oracle Cloud Infrastructure capacity for contracted customer demand. The plan includes an at-the-market equity program of up to USD 20 billion, with roughly half of the funding expected from equity and the remainder from one investment-grade bond issue.
- In February 2025, MongoDB acquired Voyage AI for approximately USD 220 million in cash and stock. MongoDB recorded preliminary purchase consideration of USD 160.9 million and incurred USD 1.5 million in acquisition-related costs in the quarter ended April 30, 2025; the deal added embedding and reranking technology for AI data retrieval.
- In December 2025, IBM agreed to acquire Confluent for USD 31 per share in cash, representing an enterprise value of USD 11 billion. IBM positioned the transaction as the basis for an end-to-end data platform that connects, processes, and governs enterprise data for applications and AI agents; the companies expected closing by mid-2026.
Report Scope
| Report Features | Description |
|---|---|
| Market Value (2024) | USD 120.4 Billion |
| Forecast Revenue (2034) | USD 504.2 Billion |
| CAGR (2025-2034) | 15.4% |
| Base Year for Estimation | 2024 |
| Historic Period | 2020-2023 |
| Forecast Period | 2025-2034 |
| Report Coverage | Revenue Forecast, Market Dynamics, Competitive Landscape, Recent Developments |
| Segments Covered | By Type (Relational, Non-relational), By Deployment (Cloud, On-premises), By Organization Size (Large Enterprises, SMEs), By Vertical (BFSI, IT & Telecom, Retail & E-commerce, Healthcare & Life Sciences, Government, Manufacturing, Media & Entertainment, Others) |
| Regional Analysis | North America – US, Canada; Europe – Germany, France, The UK, Spain, Italy, Rest of Europe; Asia Pacific – China, Japan, South Korea, India, Australia, Singapore, Rest of APAC; Latin America – Brazil, Mexico, Rest of Latin America; Middle East & Africa – GCC, South Africa, Rest of MEA |
| Competitive Landscape | Enterprise Database Management System Market, Amazon Web Services, Google Cloud, International Business Machines Corporation, Microsoft, MongoDB, Inc., Oracle, Redis, SAP SE, Snowflake Inc., Teradata, Others. |
| Customization Scope | Customization for segments, region/country-level will be provided. Moreover, additional customization can be done based on the requirements. |
| Purchase Options | We have three licenses to opt for: Single User License, Multi-User License (Up to 5 Users), Corporate Use License (Unlimited Users and Printable PDF) |





























