Report Overview
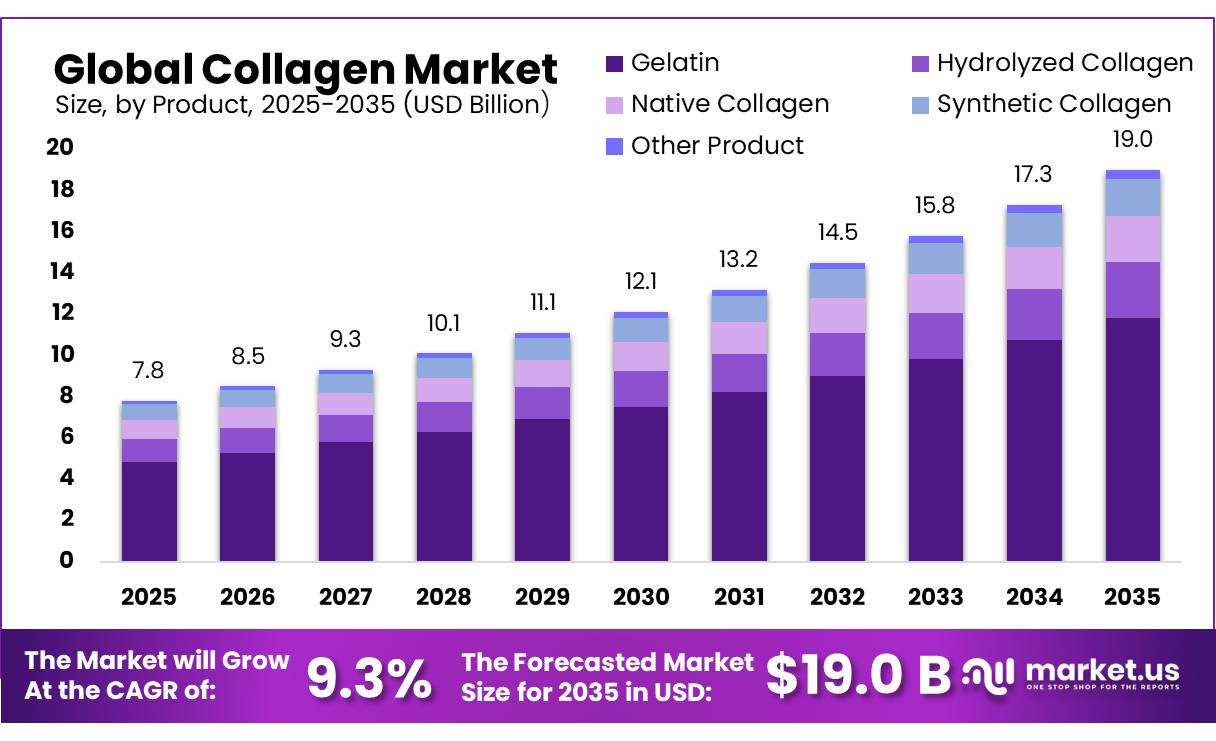
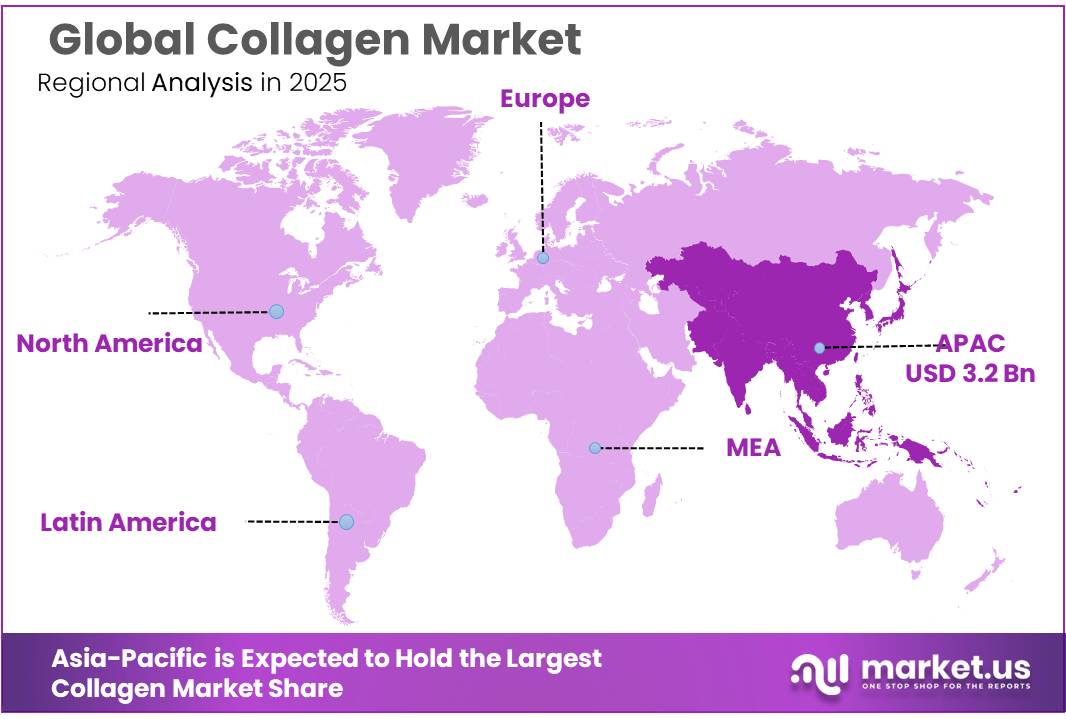
The Global Collagen Market size is expected to be worth around USD 19.0 Billion by 2035, from USD 7.8 Billion in 2025, growing at a CAGR of 9.3% during the forecast period from 2026 to 2035. In 2025, Asia-Pacific held a dominant market position, capturing more than a 41.23% share, holding USD 3.2 Billion revenue.
Key Takeaways
- Collagen Market size is expected to be worth around USD 19.0 Billion by 2035, from USD 7.8 Billion in 2025, growing at a CAGR of 9.3%.
- Gelatin held a dominant market position, capturing more than a 62.23% share of the collagen market.
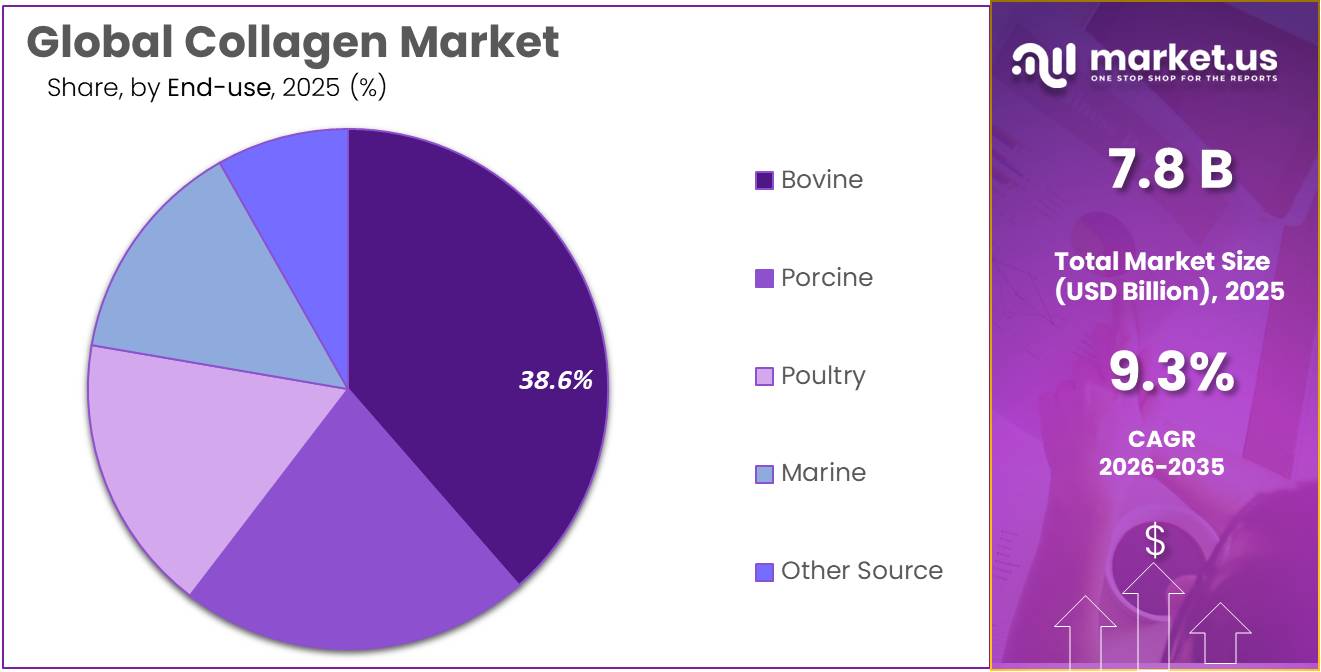
- Bovine held a dominant market position, capturing more than a 38.60% share of the collagen market.
- Food & Beverages held a dominant market position, capturing more than a 53.45% share of the collagen market.
- Distributors held a dominant market position, capturing more than a 67.56% share of the collagen market.
- Asia-Pacific held the leading position in the global collagen market in 2025, accounting for 41.23% of the market, valued at USD 3.2 billion.
By Product Analysis
By Source Analysis
By Application Analysis
By Disribution Channel Analysis
Key Market Segments
By Product
- Gelatin
- Hydrolyzed Collagen
- Native Collagen
- Synthetic Collagen
- Other Product
By Source
- Bovine
- Porcine
- Poultry
- Marine
- Other Source
By Application
- Food & Beverages
- Healthcare
- Cosmetics
- Other Application
By Disribution Channel
- B2B
- Distributors
Driver Analysis
Beauty-Supplement Formulation Demand — +0.6 Percentage Points
Beauty-positioned supplements create collagen-ingredient demand because manufacturers already formulate daily powders, drinks and capsules around recognizable branded peptides, but consumer positioning must be distinguished from proven clinical benefit. GELITA currently markets a preparation-specific 2.5 g daily formulation for beauty applications, establishing an existing commercial route to market rather than evidence that all collagen products have equivalent effects. Importantly, a 2025 systematic review of 23 randomized trials involving 1,474 participants found favorable pooled skin outcomes overall, but no significant benefit in the high-quality or non-pharmaceutical-funded subgroups, leading the authors to question support for skin-ageing claims.
The commercial driver is therefore manufacturers’ continued ingredient adoption, not an analyst endorsement that collagen prevents or treats skin ageing. In a constructed customer portfolio of 1 million users purchasing 180 daily servings annually at 2.5 g per serving, collagen demand is 450 tonnes; at an assumed USD 15/kg ingredient realization, annual supplier revenue is USD 6.75 million. Increasing active users by 10% adds 45 tonnes and USD 675,000, provided serving frequency and dose remain unchanged.
The +0.6-point sensitivity assumes 25% of terminal counterfactual revenue is beauty-sensitive and achieves approximately 11.6% cumulative commercial outperformance, adding 2.9% market-wide terminal revenue. Suppliers increasingly compete through sensory performance, preparation-specific documentation and customer formulation support; repeat purchasing, lawful claims and scrutiny of evidence remain material downside risks, so retail beauty spending is not counted directly as collagen-market revenue.
Drivers Impact Analysis
| Driver | (~) % Impact on CAGR Forecast | Geographic Relevance | Impact Timeline |
|---|---|---|---|
| Beauty-supplement formulation demand | +0.6 pp | US, EU, Japan, South Korea | Medium term (2–4 years) |
| Joint-health product adoption | +0.6 pp | US, EU, Japan, China | Long term (≥ 4 years) |
| Food and beverage incorporation | +0.6 pp | US, EU, China, Brazil | Medium term (2–4 years) |
| Medical-matrix procurement | +0.5 pp | US, EU, Japan | Long term (≥ 4 years) |
| Animal-nutrition portfolio expansion | +0.3 pp | US, EU, Japan | Medium term (2–4 years) |
| Source-qualified product portfolios | +0.4 pp | EU, US, Japan, Gulf states | Medium term (2–4 years) |
Restraint Analysis
Clinical-Evidence Uncertainty — −0.5 Percentage Points
Uncertainty over preparation-specific efficacy limits premium pricing, customer retention and manufacturers’ willingness to commit to differentiated collagen ingredients, particularly in beauty applications. A 2025 systematic review included 23 randomized trials involving 1,474 participants: pooled results favored collagen for selected skin outcomes, but the high-quality and non-pharmaceutical-funded subgroups did not show significant benefits, leading the authors to question the evidence supporting skin-ageing use. That finding does not establish that every preparation is ineffective, nor does it invalidate all joint-health evidence; it weakens the assumption that a general collagen label supports a universal benefit.
In a constructed ingredient portfolio, 500 tonnes annually sold at USD 15/kg generates USD 7.5 million of revenue. If evidence scrutiny reduces purchasing volume by 10%, revenue falls USD 750,000 at constant price; separately, losing a USD 2/kg evidence-based premium on the remaining 450 tonnes removes another USD 900,000, producing USD 1.65 million of total exposure without double counting volume already lost. At an assumed USD 10/kg variable production cost, contribution falls from USD 2.5 million to USD 1.35 million before fixed expenditure.
The −0.5-point sensitivity assumes 25% of terminal counterfactual revenue is evidence-sensitive and experiences a 9.2% realization shortfall, producing approximately 2.3% market-wide terminal erosion. Suppliers must therefore fund relevant studies and disclose preparation, dose and endpoints; this restraint concerns commercial confidence, distinct from the legal ability to advertise a claim.
Restraint Impact Analysis
| Restraint | (~) % Impact on CAGR Forecast | Geographic Relevance | Impact Timeline |
|---|---|---|---|
| Clinical-evidence uncertainty | −0.5 pp | US, EU, UK, Japan, South Korea | Long term (≥ 4 years) |
| Claim-related commercialization limits | −0.4 pp | EU; US supplement channels | Long term (≥ 4 years) |
| Qualified feedstock cost pressure | −0.4 pp | US, EU, Brazil, China | Medium term (2–4 years) |
| Dose-driven formulation costs | −0.4 pp | US, EU, China, Japan | Medium term (2–4 years) |
| Source and allergen exclusions | −0.3 pp | US, EU, India, Gulf states | Long term (≥ 4 years) |
| Medical-grade qualification barriers | −0.4 pp | US, EU, Japan | Long term (≥ 4 years) |
Opportunity Analysis
Preparation-Specific Evidence Platforms — +0.5 Percentage Points
The white space is to develop independently scrutinized, preparation-specific evidence that supports additional customer applications and defensible premiums, rather than simply attach a branded claim to existing beauty or joint-health demand. This investment must address a material evidence gap: a 2025 skin-ageing meta-analysis included 23 randomized trials and 1,474 participants, but found no significant benefit in high-quality or non-pharmaceutical-funded subgroups, despite favorable overall pooled results. Supplier documentation also distinguishes peptide compositions and manufacturing conditions, reinforcing that results from one preparation should not automatically substantiate another.
In a constructed program, three candidate preparations each require USD 1.5 million of analytical, safety and human-study expenditure, creating USD 4.5 million of initial investment. If two achieve commercially relevant results and each reaches 750 tonnes annually with a USD 2/kg ingredient premium, annual premium revenue is USD 3 million; subtracting USD 600,000 of incremental production, quality and continuing evidence costs leaves USD 2.4 million before selling expense and overhead.
Simple recovery of initial research expenditure is approximately 1.9 years after reaching that volume—not from study initiation—and unsuccessful candidates remain part of the investment cost. The +0.5-point sensitivity requires approximately 2.4% incremental terminal market revenue from genuinely new customers and sustained premiums, net of ordinary branded-peptide growth already forecast. Clinical success does not guarantee a legally usable claim: authorization and wording remain jurisdiction-specific, and neither disease-treatment claims nor universal collagen efficacy is assumed.
Opportunity Impact Analysis
| Opportunity | (~) % Potential CAGR | Geographic Relevance | Execution Window |
|---|---|---|---|
| Preparation-specific evidence platforms | +0.5 pp | US, EU, Japan, South Korea | Long term (≥ 4 years) |
| Co-located coproduct refining | +0.5 pp | Brazil, US, EU, Vietnam | Medium term (2–4 years) |
| Application-engineered collagen grades | +0.4 pp | US, EU, China, Japan | Medium term (2–4 years) |
| Native-collagen research materials | +0.4 pp | US, EU, Japan, South Korea | Long term (≥ 4 years) |
| Regional contract-finishing hubs | +0.3 pp | India, Indonesia, Brazil | Medium term (2–4 years) |
| Capability-led acquisition platforms | +0.3 pp | US, Germany, France, Singapore | Short term (≤ 2 years) |
Challenges Analysis
Hydrolysis Process Reproducibility — −0.4 Percentage Points
The manufacturing challenge is reproducing a specified peptide distribution and functional profile as raw-material characteristics, enzymes, residence time and process conditions change—not simply securing enough collagen-rich input. Published technical literature explains that enzyme selection and reaction time influence peptide sizes and sequences, while chemical hydrolysis can be harder to control; supplier materials likewise distinguish collagen peptides by composition and processing characteristics. This supports process sensitivity without establishing a universal commercial yield benchmark or proving that one molecular-weight range is clinically superior.
In a constructed plant processing 10,000 tonnes of wet input annually, a 10% saleable-product yield produces 1,000 tonnes; a decline to 9.5% reduces output by fifty tonnes, or 5%. At USD 14/kg realization, that is USD 700,000 of output-value exposure before replacement supply or reprocessing. If annual fixed conversion cost is USD 2 million, fixed cost per kilogram rises from USD 2.00 to approximately USD 2.11, while recovering output may require additional enzyme, processing time or input.
The −0.4-point sensitivity assumes 25% of terminal opportunity-enabled revenue is process-sensitive and experiences a 7.6% realization shortfall, producing approximately 1.9% aggregate terminal friction through inconsistent delivery and delayed customer conversion. Mitigation requires defined operating windows, enzyme-activity verification, in-process sampling and change control; this category concerns repeatable compliant output, whereas feedstock-price inflation and rejected incoming materials remain outside the calculation.
Challenges Impact Analysis
| Challenge | (~) % CAGR Friction Drag | Geographic Relevance | Mitigation Horizon |
|---|---|---|---|
| Hydrolysis Process Reproducibility | −0.4 pp | Brazil, US, EU, China | Long term (≥ 4 years) |
| Cross-Laboratory Specification Alignment | −0.3 pp | US, EU, Japan, China | Medium term (2–4 years) |
| Source-Traceability Data Integration | −0.3 pp | Brazil–EU, Asia–US, Asia–EU | Medium term (2–4 years) |
| Finished-Matrix Performance Consistency | −0.3 pp | US, EU, China, Japan | Medium term (2–4 years) |
| Transit and Inventory Synchronization | −0.3 pp | Asia–EU, Brazil–EU, Asia–US | Medium term (2–4 years) |
| Specialist Technical Workforce Development | −0.2 pp | US, Germany, France, China | Long term (≥ 4 years) |
Geopolitical Impact Analysis
Geopolitical Impact of Ongoing Wars on the Collagen Market
The ongoing Middle East conflict and Russia-Ukraine war are creating indirect pressure on the global collagen market through higher energy costs, shipping delays, and raw material transportation challenges. Collagen manufacturers depend on a steady supply of bovine hides, porcine skin, fish-processing by-products, chemicals, and processing materials. Disruptions across the Strait of Hormuz, Red Sea, and Black Sea are increasing freight costs and making international deliveries less predictable.
According to the Central Bank of Ireland’s 2026 report, global oil supply declined by approximately 10 million barrels per day in March 2026, while Brent crude prices increased from USD 69 per barrel in February to USD 104 per barrel in May 2026. These increases are putting pressure on collagen extraction, drying, packaging, and transportation expenses. The World Bank also projected a 32% increase in global energy prices during 2026. Consequently, collagen producers may face higher operating costs and tighter profit margins, particularly those dependent on international raw material sourcing.
However, these disruptions are also encouraging manufacturers to diversify suppliers, strengthen regional sourcing, improve inventory management, and invest in efficient production technologies. Such measures are expected to support supply chain resilience despite geopolitical uncertainty.
Regional Insights
Dominating Region: Asia-Pacific – 41.23% Market Share, USD 3.2 Billion
Asia-Pacific held the leading position in the global collagen market in 2025, accounting for 41.23% of the market, valued at USD 3.2 billion. The region’s dominance is supported by strong demand for collagen-based dietary supplements, functional foods, pharmaceutical ingredients, and personal care products. China, Japan, and South Korea are important consumption and manufacturing markets, driven by increasing interest in beauty nutrition, healthy ageing, and preventive healthcare. The region also benefits from established food-processing and aquaculture industries. According to the Food and Agriculture Organization (FAO), Asia produced approximately 179 million tonnes of aquatic animals and algae in 2024, representing 76% of global production.
Marine-based collagen and nutraceutical applications are emerging as important growth opportunities across Asia-Pacific. Increasing demand for collagen powders, beauty supplements, functional beverages, and specialized nutritional products is encouraging manufacturers to expand their product portfolios. Japan and South Korea have established consumer markets for beauty and wellness products, while China offers opportunities through its expanding functional nutrition and food ingredient industries. According to FAO, Asian aquaculture produced approximately 130 million tonnes of aquatic animals and algae in 2024, providing a substantial raw material base for marine-derived ingredient development.
Key Regions and Countries Insights
- North America
- US
- Canada
- Europe
- Germany
- France
- The UK
- Spain
- Italy
- Rest of Europe
- Asia Pacific
- China
- Japan
- South Korea
- India
- Australia
- Rest of APAC
- Latin America
- Brazil
- Mexico
- Rest of Latin America
- Middle East & Africa
- GCC
- South Africa
- Rest of MEA
Key Players Analysis
Rousselot, part of Darling Ingredients, is a major manufacturer of collagen and gelatin solutions for the food, nutraceutical, pharmaceutical, and biomedical industries. The company has more than 130 years of industry experience and operates 16 production facilities across 8 countries and 4 continents. Its portfolio includes more than 400 collagen and gelatin products, including Peptan and Nextida. Rousselot focuses on product innovation, advanced collagen peptides, and specialized ingredients for health and wellness applications.
GELITA AG is a Germany-based manufacturer specializing in collagen proteins, gelatin, and bioactive collagen peptides. Founded in 1875, the company has more than 150 years of industry experience, employs over 2,900 people, and operates more than 20 production sites worldwide. Its products serve the food, pharmaceutical, dietary supplement, cosmetics, and medical technology industries. GELITA continues to focus on research, production efficiency, and specialized collagen ingredients for applications such as joint health, skin nutrition, and pharmaceutical formulations.
Tessenderlo Group participates in the collagen industry through its PB Leiner business, which manufactures gelatin and collagen peptides for food, pharmaceutical, and health applications. In December 2025, Tessenderlo Group signed a definitive agreement with Darling Ingredients to combine PB Leiner and Rousselot into a new collagen-focused company. Under the proposed structure, Darling Ingredients would hold an 85% ownership stake, while Tessenderlo Group would hold 15%. The partnership aims to strengthen global manufacturing capabilities and expand collagen-based health, wellness, and nutrition products.
Top Key Players Outlook
- Rousselot
- GELITA AG
- Tessenderlo Group
- STERLING Biotech
- Weishardt Holding SA
- Juncà Gelatines SL
- Symatese
- Regenity
- Collagen Solution LLC
- ConnOils LLC
- Advanced BioMatrix, Inc.
- Other Key Players
Recent Developments
- In FY2025, Zydus Lifesciences reported the formation of a 50:50 joint venture with Sterling Biotech following its acquisition of a 50% stake for INR 550 crore from Perfect Day Inc. The partnership also planned a specialized manufacturing facility for fermented animal-free proteins, although this development relates to alternative proteins rather than collagen production.
- In May 2026, Weishardt Holding SA introduced Naticol UltraPeptide, an ultra-low molecular-weight marine collagen ingredient with an average molecular weight of 500 Daltons and approximately 45% di- and tripeptides. The ingredient was developed for use in powders, capsules, gummies, shots, and skincare formulations, with reported effective daily intake starting at 0.5 grams.
Report Scope
| Report Features | Description |
|---|---|
| Market Value (2025) | USD 7.8 Bn |
| Forecast Revenue (2035) | USD 19.0 Bn |
| CAGR (2026-2035) | 9.3% |
| Base Year for Estimation | 2025 |
| Historic Period | 2020-2024 |
| Forecast Period | 2026-2035 |
| Report Coverage | Revenue Forecast, Market Dynamics, Competitive Landscape, Recent Developments |
| Segments Covered | By Product (Gelatin, Hydrolyzed Collagen, Native Collagen, Synthetic Collagen, Other Product), By Source (Bovine, Porcine, Poultry, Marine, Other Source), By Application (Food & Beverages, Healthcare, Cosmetics, Other Application), By Disribution Channel (B2B, Distributors) |
| Regional Analysis | North America – US, Canada; Europe – Germany, France, The UK, Spain, Italy, Rest of Europe; Asia Pacific – China, Japan, South Korea, India, Australia, Singapore, Rest of APAC; Latin America – Brazil, Mexico, Rest of Latin America; Middle East & Africa – GCC, South Africa, Rest of MEA |
| Competitive Landscape | Rousselot, GELITA AG, Tessenderlo Group, STERLING Biotech, Weishardt Holding SA, Juncà Gelatines SL, Symatese, Regenity, Collagen Solution LLC, ConnOils LLC, Advanced BioMatrix, Inc., Other Key Players |
| Customization Scope | Customization for segments, region/country-level will be provided. Moreover, additional customization can be done based on the requirements. |
| Purchase Options | We have three licenses to opt for: Single User License, Multi-User License (Up to 5 Users), Corporate Use License (Unlimited User and Printable PDF) |