
Quick Navigation
Report Overview
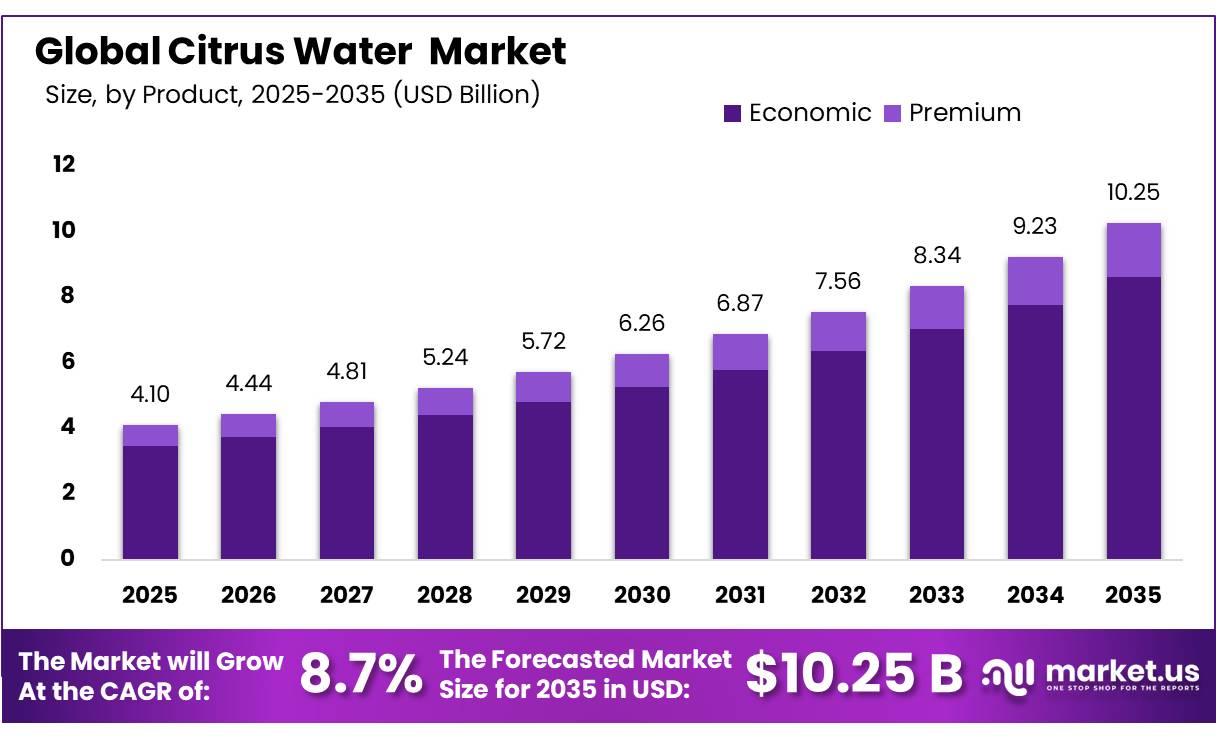
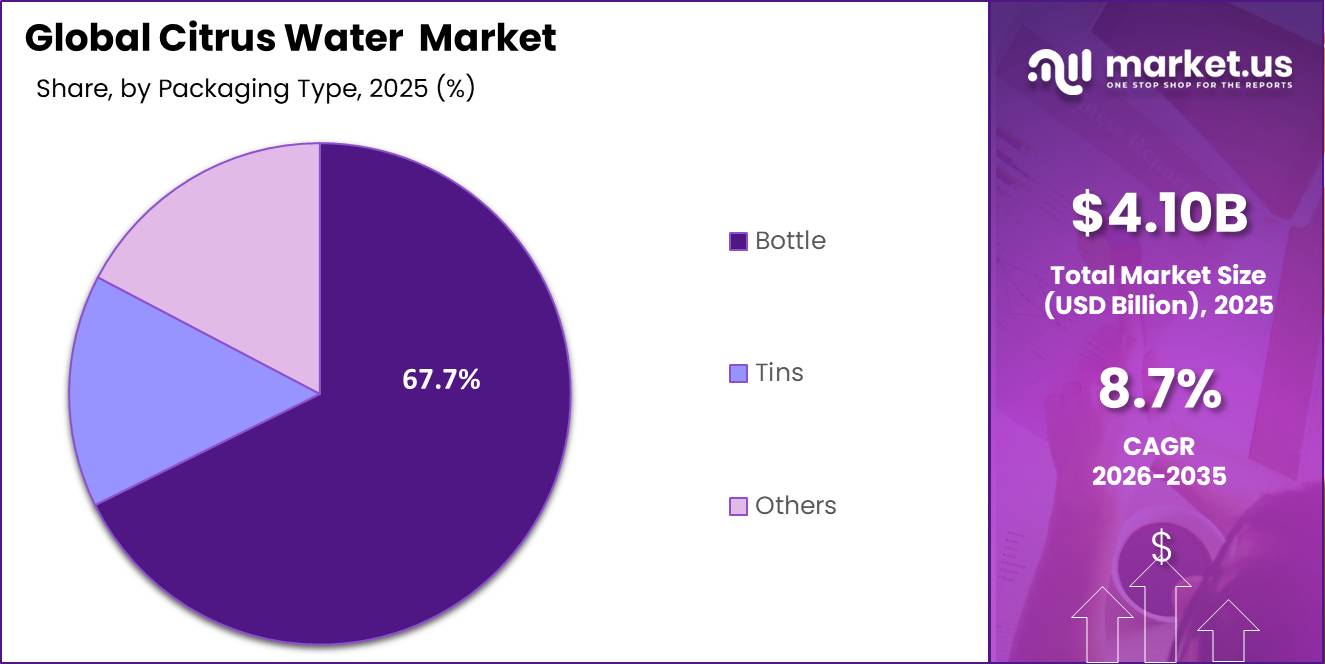
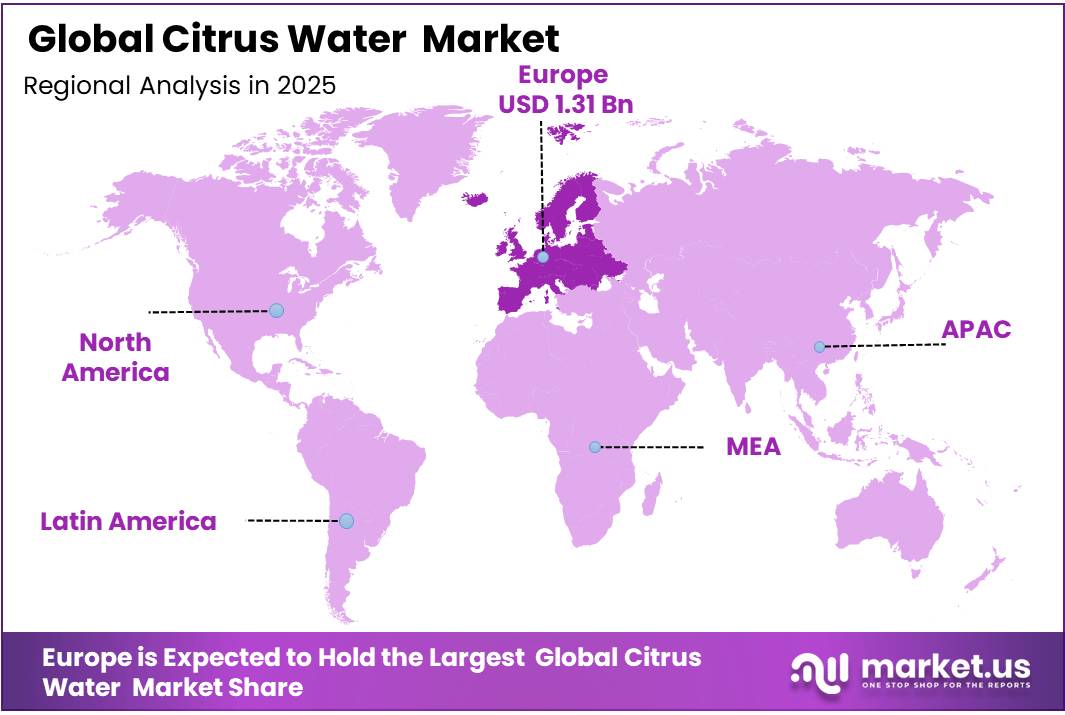
In 2025, the Global Citrus Water Market was valued at USD 4.10 billion, and between 2026 and 2035, this market is estimated to register a CAGR of 8.7%, reaching about USD 10.25 billion by 2035. Europe held a dominant market position, capturing more than a 32.1% share, holding USD 1.30 billion in revenue.
Citrus water is a naturally or artificially infused beverage that combines water with the essence, extracts, or juice of citrus fruits such as lemon, lime, orange, and grapefruit, providing a refreshing, flavorful, and health-conscious alternative to traditional sugary drinks. Citrus water differs from other flavoured beverages in that it is both a hydration product and a functional wellness offering, sitting at the intersection of clean-label consumer demand and the broader global shift away from carbonated, sugar-laden drinks.
- USDA’s 2025/26 outlook projects global fresh-orange production at 45.9 million tonnes, with 17.1 million tonnes moving to processors. Global orange-juice production is forecast at 1.4 million tonnes, while lemon and lime output is projected to fall by more than 700,000 tonnes to 10.1 million tonnes.
Key Takeaways
- The global Citrus Water market was valued at USD 4.10 billion in 2025.
- The global market is projected to grow at a CAGR of 8.7% and is estimated to reach USD 10.25 billion by 2035.
- On the basis of Product, the Economic Citrus Water dominated the market, constituting 84.1% of the total market share.
- Based on the Source, Orange dominated the Citrus Water market, with a substantial market share of around 48.0%.
- Based on the Packaging Type, Bottle led the market, comprising 67.7% of the total market.
- Among the Distribution Channels, Hypermarket and Supermarket held a major share in the Citrus Water market, accounting for 56.4% of the market share.
- In 2025, Europe was the most dominant region in the global Citrus Water market, accounting for 32.1% of the total global consumption.
The World Citrus Organisation separately forecast Northern Hemisphere citrus production at 27.40 million tonnes for 2025/26, down 1.51% year on year and 5.13% below the four-season average. Lemon output was expected to decline 12.38% to 4.23 million tonnes. These movements increase the value of multi-origin sourcing, processor contracts and efficient recovery of citrus essences and peel oils.
Demand is supported by consumers seeking hydration with more taste but less sugar than conventional soft drinks and full-strength juice. WHO advises keeping free sugars below 10% of daily energy intake, with a reduction to 5% offering additional benefits. This favours unsweetened citrus water and products using limited juice content. Regulation is also shaping formulation.
Citrus Water Market Segmentation
Product Analysis
Economic Product Type Represents the Dominant Segment
The Economic product type leads the global citrus water market with an 84.1% share, mainly due to its affordable pricing and broad consumer reach. It appeals to daily hydration consumers who prefer flavored, low-cost beverages. Wider retail availability also supports its strong sales across supermarkets, convenience stores, and online channels.
The segment’s dominance is further supported by rising demand from price-sensitive households and younger consumers seeking refreshing alternatives to sugary drinks. Brands continue to expand economic citrus water lines with simple flavors, practical packaging, and promotional offers, helping the segment maintain high volume sales in both developed and emerging markets.
Premium citrus water mainly appeals to higher-income and wellness-focused consumers who are willing to spend more on beverages that support healthier lifestyles, clean-label preferences, and functional nutrition. As interest in health and wellness continues to grow globally, this segment is gradually gaining attention despite its smaller market size.
Packaging Type Analysis
Bottle Packaging Represents the Dominant Segment
Bottle packaging dominates the global citrus water market, accounting for 67.7% of total share. Its strong position comes from a mix of convenience, easy distribution, and efficient large-scale production that other packaging formats struggle to match. For consumers, bottles offer practical everyday benefits such as portability, resealability, and easy on-the-go use, which fits perfectly with how citrus water is commonly consumed whether at the gym, in offices, while travelling, or during outdoor activities. Both PET and glass bottles are widely accepted by consumers and retailers, making them the preferred packaging option across different markets.
From a manufacturing perspective, bottle packaging also works smoothly with modern filling and distribution systems, allowing beverage companies to produce and supply products efficiently at scale. This makes bottles the standard choice not only for major global beverage brands but also for smaller regional producers looking for reliable and cost-effective packaging solutions.
Distribution Channel Analysis
Hypermarket and Supermarket Represents the Dominant Segment
Hypermarkets and supermarkets dominate global citrus water distribution, accounting for 56.4% of total sales. Walk into any supermarket or hypermarket today and the beverages aisle tells you everything you need to know about where citrus water is being bought. Hypermarkets and supermarkets dominate global citrus water distribution, accounting for 56.4% of total sales and that dominance is deeply rooted in everyday consumer shopping behaviour. Most people still pick up their beverages as part of their regular weekly grocery run, and large format retail stores are where those purchasing decisions happen most consistently and at the highest volume.
One of the biggest advantages of supermarkets and hypermarkets is their ability to offer a wide variety of products in convenient, high-traffic shopping environments. For citrus water brands, strong shelf visibility plays an important role because consumers often make quick or impulse purchase decisions while browsing beverage aisles. Placing citrus water alongside other health drinks, flavoured beverages, and wellness products increases the chances of both first-time trials and repeat purchases.
Source Analysis
Orange Represents the Dominant Source Segment
Orange is the most widely used citrus source in the global citrus water market, accounting for 48.0% of total consumption. Its strong position comes largely from its universal popularity and the familiarity consumers have with orange-based beverages around the world. For decades, orange juice has been a staple in breakfasts, snacks, and everyday beverage consumption across many cultures, making orange one of the most trusted and recognisable fruit flavours globally. Because consumers are already comfortable with its taste, they are naturally more likely to choose orange-flavoured citrus water when shopping.
Lime has gained popularity because of its strong connection with craft beverages, mocktails, and cocktail culture, giving it a refreshing and premium image among consumers. Grapefruit, on the other hand, appeals more to health-conscious buyers who prefer a stronger, slightly bitter flavour often associated with wellness and low-sugar beverage trends. Mixed citrus variants attract consumers looking for more variety and a richer flavour experience, combining different citrus fruits to create more layered and unique taste profiles in a single drink.
Key Market Segments
By Product
- Economic
- Premium
By Source
- Lemon
- Orange
- Lime
- Grapefruit
- Mixed
By Packaging Type
- Bottle
- Tins
- Others
By Distribution Channel
- Hypermarket and Supermarket
- Retail Stores
- Online Retails
Drivers
Health-led sugar avoidance lifts citrus water substitution
In Europe, UNESDA members committed to a further 10% reduction in average added sugars in soft drinks from 2019 to 2025 across the EU-27 and UK, and the sector reports a 12.4% reduction from 2019 to 2024 plus a 35.1% decline since 2000, showing that reformulation and portfolio migration are not niche moves but category-wide operating priorities.
In the U.S., sugar-reduction benchmarks have also remained commercially relevant, with modeled NSSRI 2026 targets implying up to 21% lower added sugar intake for children and youth if achieved, reinforcing the policy and public-health environment that favors unsweetened or lightly flavored waters over higher-sugar alternatives.
For citrus water brands, this changes the business model from impulse refreshment to everyday hydration: the category competes less on indulgence and more on repeatable consumption frequency, pantry stocking, and wellness positioning, which is why this driver adds an estimated +2.4 percentage points to forecast CAGR in 2026–2030.
Drivers Impact Analysis
| Driver | (~) % Impact on CAGR | Geographic Relevance | Impact Timeline |
|---|---|---|---|
| Health-led sugar avoidance lifts citrus water substitution | +2.4% | North America core, UK/EU, urban APAC | Short term (≤ 2 years) |
| Citrus flavor leadership strengthens mainstream demand | +1.9% | U.S. core, Canada, Western Europe, Gulf retail hubs | Short term (≤ 2 years) |
| Premium sparkling and functional adjacency raises price realization | +1.6% | North America, Japan, South Korea, Australia, tier-1 China | Medium term (2-4 years) |
| Packaging regulation accelerates recyclable lightweight formats | +1.1% | EU core, UK follow-through, developed APAC spill-over | Medium term (2-4 years) |
| Retail and convenience channel expansion improves trial economics | +1.4% | U.S., EU, India metros, Southeast Asia corridors | Short term (≤ 2 years) |
| Citrus raw material volatility pushes innovation in blends and sourcing | +0.8% | Brazil-linked global supply chains, U.S., EU, APAC importers | Long term (≥ 4 years) |
Restraints
Citrus input volatility
The largest structural restraint remains citrus raw-material instability because the category depends on a flavor system whose economics are influenced by concentrate, essential oil, and natural extract markets tied to diseased and weather-stressed citrus supply basins; USDA’s Brazil outlook put MY 2025/26 orange production at 330 million 90-pound boxes, but in-field revisions and trade reporting later cut the commercial outlook closer to 306.7 million boxes, while Fundecitrus-based coverage for 2026–27 pointed to only 255.2 million 40.8-kilogram boxes and greening infection affecting 47.6% of orange trees in the main Brazilian belt, alongside rainfall running about 70% below expectations in parts of the season.
For citrus water producers, even when direct juice inclusion is low, flavor houses reprice citrus inputs, substitution options narrow, and procurement teams are forced into shorter contracting windows, higher inventory buffers, and wider landed-cost assumptions, which compresses gross margin and delays SKU expansion; the result is an estimated -2.1 percentage-point drag on CAGR because brands often respond by reducing promotional depth, reformulating to mixed-citrus profiles, or postponing geographic rollout until input costs normalize.
Restraint Impact Analysis
| Restraint | (~) % Impact on CAGR Forecast | Geographic Relevance | Impact Timeline |
|---|---|---|---|
| Citrus input volatility | -2.1% | Brazil-linked global chains, U.S., EU, APAC importers | Medium term (2-4 years) |
| Packaging cost inflation | -1.7% | North America core, EU, developed APAC | Short term (≤ 2 years) |
| Packaging compliance burden | -1.3% | EU core, UK adjacency, export-to-EU suppliers | Medium term (2-4 years) |
| Freight route disruption | -1.1% | Europe-bound APAC/MENA corridors, India-EU lanes | Short term (≤ 2 years) |
| Private-label price pressure | -1.5% | U.S., UK, Western Europe, mature urban retail Asia | Short term (≤ 2 years) |
| Water-quality scrutiny costs | -0.9% | U.S. core, Canada, EU premium retail | Long term (≥ 4 years) |
Opportunity
Functional citrus hydration
The broader flavored and functional water category was valued around $6.15 billion in 2025 with an 11.2% growth profile, while market tracking for 2026 beverage launches shows strong acceleration in hydration claims and measurable-benefit positioning, indicating that consumers are already rewarding efficacy-coded liquids rather than just low-calorie taste.
For citrus water companies, the opportunity is to move from a gross-margin band closer to mainstream bottled refreshment into a premium mix where ASP can rise by roughly 20% to 40%, promotional dependence can fall by 300 to 600 basis points, and CAC can be amortized over higher repeat rates if formulas create a daily-use ritual; that is why this can add an estimated +2.6 percentage points above baseline CAGR, especially in developed markets where functionality is a monetizable claim set rather than a niche premium.
Opportunity Impact Analysis
| Opportunity | (~) % Potential CAGR Upside | Geographic Relevance | Execution Window |
|---|---|---|---|
| Functional citrus hydration | +2.6% | North America core, Japan, South Korea, Australia, tier-1 China | Short term (≤ 2 years) |
| Foodservice refill formats | +1.8% | EU core, UK, urban North America | Medium term (2-4 years) |
| India and SEA premium entry | +2.1% | India metros, Indonesia, Vietnam, Thailand, Philippines | Medium term (2-4 years) |
| DTC subscription multipacks | +1.4% | U.S., Canada, UK, Germany, UAE | Short term (≤ 2 years) |
| Botanical-citrus premium line | +1.7% | Western Europe, U.S. coastal, South Korea, Singapore | Short term (≤ 2 years) |
| M&A of niche hydration brands | +1.9% | U.S., EU, Australia, GCC | Long term (≥ 4 years) |
Challenges Analysis
Volatile maritime logistics
A persistent challenge for citrus water is the structurally unstable sea-freight environment rather than any single temporary shock, with the 2026 Red Sea crisis illustrating how quickly beverage logistics can swing from normalized to stressed: rerouting Asia→EU and related corridors via the Cape of Good Hope adds roughly 8–12 days of transit time and has driven full-container-load rate surges of 30–60% on some lanes, while UNCTAD data cited for earlier phases of the crisis indicated that up to 30% of global container trade was affected and trade volumes across the corridor fell by about 42% in a two‑month window.
Over a full planning cycle this ongoing friction is modeled to shave around -1.2 percentage points off otherwise achievable CAGR by depressing the speed at which brands expand into new geographies, increasing the payback period on export-focused marketing, and embedding higher logistics cost variances into unit economics that are hard to fully price through in a low‑value‑per‑liter category.
Challenges Impact Analysis
| Challenge | (~) % CAGR Friction Drag | Geographic Relevance | Mitigation Horizon |
|---|---|---|---|
| Volatile maritime logistics | -1.2% | Europe-bound APAC/MENA lanes, India→EU, China→Med | Medium term (2-4 years) |
| PFAS and water testing load | -1.0% | EU regulatory hubs, U.S., Canada | Long term (≥ 4 years) |
| Complex PPWR packaging shift | -0.9% | EU core, UK, export-to-EU suppliers | Long term (≥ 4 years) |
| SKU complexity and portfolio drag | -0.8% | U.S., EU, developed APAC retail | Medium term (2-4 years) |
| Talent and capability gaps | -0.7% | Global brand owners, key co-pack hubs | Long term (≥ 4 years) |
| Retail margin and mix pressure | -0.9% | North America core, UK, Western Europe | Medium term (2-4 years) |
Geopolitical Impact Analysis
US Tariff Policy on Citrus Imports Directly Disrupting Global Supply Chains for Citrus Water Manufacturers
The global citrus water market has become more sensitive to geopolitical trade policies than its simple, healthy image might suggest, and 2025 has highlighted this clearly. The United States introduced a 50% tariff on Brazilian citrus products set to take effect from August 2025, significantly disrupting one of the world’s most important citrus trade relationships. Since Brazil supplies a large share of orange juice and citrus concentrates used globally, this sudden cost increase has had a direct impact on beverage manufacturers that rely on these inputs.
As a result, companies have been forced to diversify suppliers more quickly, exploring alternatives in regions such as Mexico, Spain, and South Africa. Beyond cost pressures, the situation has also introduced greater uncertainty into long-term planning, as potential trade tensions and retaliatory measures could further disrupt supply stability.
Regional Analysis
Europe Represents the Most Dominant Region in the Global Citrus Water Market
Europe holds the leading regional position in the global citrus water market with a 32.1% share in 2025 a dominance that reflects the region’s deeply embedded culture of flavoured and functional water consumption, strong health and wellness awareness, and well-developed premium beverage retail infrastructure. Rising awareness about sugar reduction and healthy lifestyles has significantly increased the shift from sugary drinks to flavoured and functional water across Europe, with supermarkets and hypermarkets dominating distribution and supporting consistent consumer access to citrus water products at both economic and premium price points.
Among the remaining regions, North America follows as a large and trend-setting market with high consumer awareness around functional hydration, Asia Pacific is the fastest-growing region driven by rising health consciousness and expanding middle-class beverage consumption, while Latin America and Middle East & Africa represent emerging growth frontiers with strong long-term demand potential tied to urbanisation and increasing disposable incomes.
Key Regions and Countries Covered
- North America
- The US
- Canada
- Europe
- Germany
- France
- The UK
- Spain
- Italy
- Russia & CIS
- Rest of Europe
- APAC
- China
- Japan
- South Korea
- India
- ASEAN
- Rest of APAC
- Latin America
- Brazil
- Mexico
- Rest of Latin America
- Middle East & Africa
- GCC
- South Africa
- Rest of MEA
Key Players Analysis
The global citrus water market operates within a moderately consolidated competitive landscape where the world’s largest beverage corporations command significant scale advantages through their distribution networks, marketing budgets, and brand recognition while an increasingly confident cohort of independent, clean-label niche brands competes effectively by offering ingredient transparency, functional enrichment, and direct-to-consumer accessibility that the giants struggle to replicate at speed.
Major players like PepsiCo, Coca-Cola, and Nestlé dominate the market by leveraging their extensive distribution networks, large marketing budgets, and strong brand loyalty filling store shelves with comparable citrus-infused products including PepsiCo’s bubly sparkling water, Coca-Cola’s AHA sparkling water, and Nestlé’s flavoured mineral water ranges. This dominance creates meaningful shelf-space and distribution barriers for emerging brands, but the rapid growth of e-commerce and direct-to-consumer channels is steadily democratising market access in ways that are reshaping the competitive dynamics of the entire category
The Major Players in the Industry
- PepsiCo
- The Coca-Cola Company
- Nestle
- Danone
- Keurig Dr Pepper
- National Beverage Corp.
- Talking Rain Beverage Company
- Hint Inc.
- Spindrift Beverage Co.
- Suntory Beverage & Food
- Polar Beverages
- Waterloo Sparkling Water
Key Development
- PepsiCo Canada also launched bubly POP in April 2026, including a lemon-lime option made with real fruit juice. Each 355 mL can contains no more than 3 grams of sugar and 20 calories, and the product is sold in 6-packs. In merger and acquisition activity, PepsiCo completed its USD 1.95 billion purchase of poppi in May 2025, equal to a net purchase price of USD 1.65 billion after expected tax benefits.
- For investment and expansion, PepsiCo spent USD 4.415 billion on capital projects in 2025, including USD 1.344 billion in PepsiCo Beverages North America. The company generated USD 93.925 billion in 2025 net revenue, showing that it has the financial and distribution strength to expand citrus, sparkling-water and functional hydration products.
- Coca-Cola HBC agreed in October 2025 to acquire a 75% controlling stake in Coca-Cola Beverages Africa from The Coca-Cola Company and Gutsche Family Investments for a combined USD 2.6 billion, with completion expected by the end of 2026.
- The Coca-Cola Company spent USD 2.112 billion on property, plants and equipment during 2025, including 31.7% in North America. The company recorded USD 47.941 billion in net operating revenue and sold 33.8 billion unit cases in 2025.
Report Scope
| Report Features | Description |
|---|---|
| Market Value (2025) | US$4.10 Bn |
| Forecast Revenue (2035) | US$10.25 Bn |
| CAGR (2026-2035) | 8.7% |
| Base Year for Estimation | 2025 |
| Historic Period | 2020-2024 |
| Forecast Period | 2026-2035 |
| Report Coverage | Revenue Forecast, Market Dynamics, Competitive Landscape, Recent Developments |
| Segments Covered | By Product Type (Economic and Premium), By Source (Lemon, Orange, Lime, Grapefruit, and Mixed), By Packaging Type (Bottle, Tins, and Others), By Distribution Channel (Hypermarket and Supermarket, Retail Stores, and Online Retails) |
| Regional Analysis | North America – The US & Canada; Europe – Germany, France, The UK, Spain, Italy, Russia & CIS, Rest of Europe; APAC– China, Japan, South Korea, India, ASEAN & Rest of APAC; Latin America– Brazil, Mexico & Rest of Latin America; Middle East & Africa– GCC, South Africa, & Rest of MEA |
| Competitive Landscape | PepsiCo The Coca-Cola Company Nestle Danone Keurig Dr Pepper National Beverage Corp. Talking Rain Beverage Company Hint Inc. Spindrift Beverage Co. Suntory Beverage & Food Polar Beverages Waterloo Sparkling Water |
| Customization Scope | Customization for segments, region/country-level will be provided. Moreover, additional customization can be done based on the requirements. |
| Purchase Options | We have three licenses to opt for: Single User License, Multi-User License (Up to 5 Users), Corporate Use License (Unlimited Users and Printable PDF) |


