


Report Overview
In 2025, the Global Blockchain in Supply Chain Market was valued at USD 9.91 billion and is projected to reach approximately USD 697.78 billion by 2035, growing at a CAGR of 53.2% during 2026–2035. North America accounted for over 36.0% of global revenue, representing around USD 3.57 billion in 2025, supported by its advanced logistics infrastructure, high trade volumes, and early adoption of digital supply chain technologies.
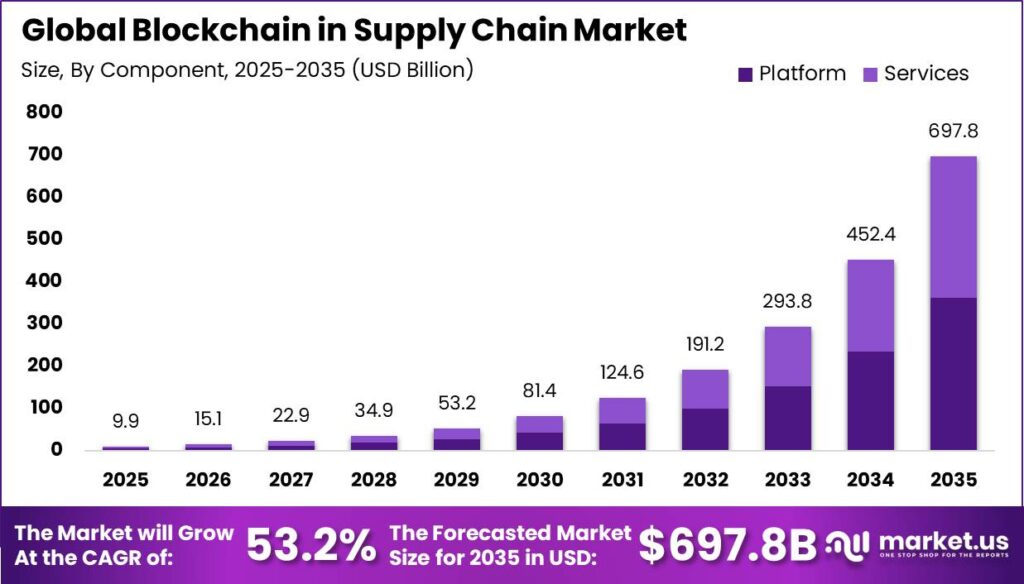
The strong growth outlook is driven by the increasing complexity of global trade networks and the rising need for transparency, traceability, and faster transaction processing. According to UNCTAD, global maritime trade handled around 12.7 billion tons of cargo in 2024, with more than 80% of global merchandise trade by volume transported by sea.
Global container traffic also reached approximately 192.9 million TEU in 2025, highlighting the scale of supply chain operations worldwide. As every shipment involves multiple documents, tracking updates, and financial processes, blockchain solutions can improve efficiency by enabling secure data sharing, automated verification, and smart contract-based transactions.
Key Takeaway
- The Global Blockchain in Supply Chain Market generated USD 9.91 billion in revenue in 2025 and is projected to reach USD 697.78 billion by 2035, expanding at a 53.2% CAGR during 2026–2035.
- Platform solutions dominated the component segment with 52.0% share in 2025, driven by demand for blockchain networks enabling secure data exchange and supply chain traceability.
- Product traceability led the application segment with 30.0% share, as businesses focus on improving transparency, compliance, and end-to-end shipment visibility.
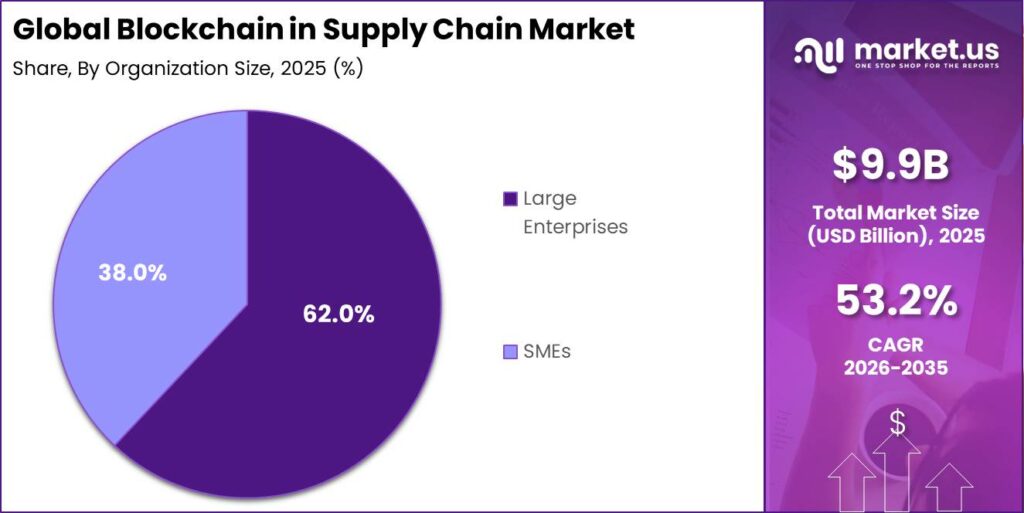
- Large enterprises held the leading position by organization size with 62.0% share, supported by higher technology investments and large-scale supply chain operations.
- SMEs contributed 38.0% share, driven by growing access to affordable blockchain platforms and cloud-based solutions.
- Healthcare & Pharma accounted for 25.0% of end-user demand, supported by the need for secure product tracking, regulatory compliance, and counterfeit prevention.
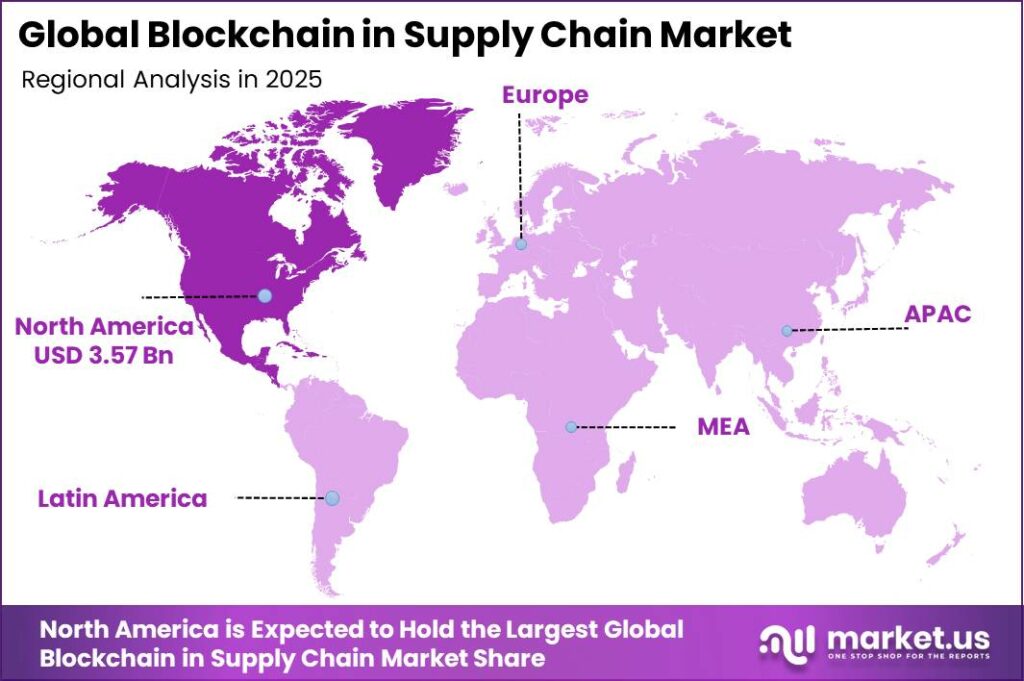
- North America captured over 36.0% of global revenue in 2025, representing approximately USD 3.57 billion, due to advanced logistics infrastructure and early blockchain adoption.
By Component
The Platform component accounts for approximately 52% of global blockchain in supply chain revenues, as it provides the core infrastructure required for enterprise blockchain adoption. With global merchandise trade reaching around USD 24 trillion and total goods-and-services trade reaching USD 31 trillion in 2022, companies are increasingly investing in digital systems that enable secure and transparent supply chain operations.
Blockchain platforms offer permissioned distributed databases, consensus mechanisms, and smart contract capabilities to manage millions of shipment, customs, and inventory transactions across global networks. This is particularly important as nearly two-thirds of global trade flows through global value chains, where data sharing, compliance, and traceability remain major challenges.
By Application
Product traceability accounts for approximately 30% of blockchain-in-supply-chain deployments, making it the leading application segment due to its direct impact on transparency, compliance, and risk reduction. The growing need for reliable product verification is driven by the scale of global trade, with merchandise trade exceeding USD 24 trillion annually and counterfeit products accounting for around USD 467 billion, or 2.3% of global imports, due to limited provenance visibility.
Food supply chains further strengthen demand for traceability solutions, as food loss and waste create economic losses of nearly USD 1 trillion annually, partly due to inefficient recalls, poor batch tracking, and limited supply chain visibility. Blockchain-based traceability platforms address these challenges by creating an immutable record of product movement, origin, and transformation history across supply networks.
By Organization Size
Large enterprises account for about 62% of global spending on blockchain-enabled supply chain solutions, highlighting their dominance in this segment. The World Trade Organization reports that global merchandise exports exceeded USD 25 trillion in 2022, with a large share managed by multinational manufacturers, retailers, and logistics companies operating complex, multi-tier supplier networks across multiple regions.
For these organizations, trade documentation, customs compliance, and coordination delays can contribute 10–15% of total transaction costs, making automation and digitization key drivers of efficiency improvement.
By End User
The Healthcare and Pharmaceutical segment accounts for approximately 25% of global blockchain in supply chain deployments, making it the leading end-user segment by adoption and growth potential.
This dominance is driven by the sector’s complex supply networks, strict regulatory requirements, and high need for product authenticity. Global medicines spending is projected to approach around USD 2 trillion within the current decade, with billions of prescription units moving through fragmented, multi-tier supply chains.
Healthcare supply chains require advanced track-and-trace capabilities under regulations such as the DSCSA in the US and the EU Falsified Medicines Directive, which mandate item-level serialization, end-to-end visibility, and secure data records. Blockchain technology supports these requirements through immutable ledgers, smart contracts, and automated verification processes.
Key Market Segments
By Component
- Platform
- Public Blockchain
- Private Blockchain
- Consortium Blockchain
- Services
- Integration Services
- Consulting Services
- Support & Maintenance
By Application
- Product Traceability
- Food Safety Tracking
- Pharma Track & Trace
- Smart Contracts
- Automated Payments
- Contract Execution
- Payment & Settlement
- Inventory & Provenance
- Compliance & Auditing
By Organization Size
- Large Enterprises
- Fortune 500
- Mid-Large Corps
- SMEs
- Small Enterprises
- Medium Enterprises
By End User
- Healthcare & Pharma
- Food & Beverage
- Food Producers
- Food Distributors
- Automotive
- Logistics & Transport
- Manufacturing
- Others
Market Dynamics
Drivers
| Driver | (~) % CAGR | Geographic Relevance | Impact Timeline |
|---|---|---|---|
| Regulatory Traceability Mandates (DSCSA, FSMA, EU ESPR) | +8.5% | North America, European Union | Short term (2 years or less) |
| Enterprise Demand for End-to-End Supply Chain Transparency | +7.2% | Global, highest in North America, Western Europe, Asia Pacific | Short term (2 years or less) |
| Smart Contract Automation Displacing Manual Procurement & Invoicing | +6.0% | Global, led by North America and Western Europe | Short term (2 years or less) |
| Counterfeit & Gray Market Suppression in Pharma & Electronics | +5.4% | Global, highest in Southeast Asia, Latin America, Sub-Saharan Africa | Medium term (2 to 4 years) |
| Convergence of Blockchain with IoT Sensor Networks for Real-Time Tracking | +4.8% | Global, led by North America, Germany, Japan, South Korea | Medium term (2 to 4 years) |
| Government & Multilateral Body Pilot Programs Accelerating Enterprise Proof-of-Concept Conversion | +3.2% | Asia Pacific (China, Singapore, India), Middle East | Medium term (2 to 4 years) |
Regulatory Traceability Mandates (DSCSA, FSMA, EU ESPR)
This regulatory convergence is structurally converting blockchain supply chain from a discretionary technology investment into a compliance-driven line item, compressing enterprise sales cycles from typical cycles of 18 to 24 months to as few as 6 to 9 months for regulated verticals, and simultaneously shifting vendor monetization models from project-based implementation fees toward recurring SaaS and Blockchain-as-a-Service subscription contracts that provide more predictable revenue and expand total contract values.
Restraints
| Restraint | (~) % CAGR | Geographic Relevance | Impact Timeline |
|---|---|---|---|
| High Total Cost of Ownership Blocking SME & Mid-Market Adoption | -6.8% | Global, most acute in South Asia, Southeast Asia, Latin America, Sub-Saharan Africa | Short term (2 years or less) |
| Absence of Unified Cross-Jurisdictional Legal & Contractual Framework for Smart Contracts | -4.5% | Global, most acute in EU, ASEAN, Gulf Cooperation Council | Medium term (2 to 4 years) |
| Legacy ERP & WMS Integration Lock-In Delaying Deployment Timelines | -3.9% | Global, highest in North America and Western Europe (SAP & Oracle-dominant enterprises) | Short term (2 years or less) |
| GDPR & Regional Data Privacy Law Conflicts with On-Chain Immutability | -3.2% | European Union, Brazil (LGPD), India (DPDP Act) | Medium term (2 to 4 years) |
| Consortium Governance Failures & Multi-Stakeholder Trust Deadlocks | -2.4% | Global, most visible in automotive, retail, and financial services consortia | Medium term (2 to 4 years) |
High Total Cost of Ownership Blocking SME & Mid-Market Adoption
For small and mid-sized enterprises, which constitute the majority of tier-2 and tier-3 supply chain participants globally, collectively delivering initial CapEx that industry association procurement surveys and institutional case studies place in the range of $250,000 to $1.2 million for a mid-complexity deployment, before annual operational expenditures of 15 to 20% of that figure for maintenance and upgrades.
The restraint operates as a demand multiplier in the wrong direction: every tier-2 supplier unable to onboard reduces the completeness of the provenance graph by an estimated 20 to 30% per missing node tier, materially undermining the end-to-end traceability claims that drive the enterprise sales cycle.
Vendors are responding with lightweight SaaS onboarding tools and subsidized node-as-a-service models, but adoption among firms with annual revenues below approximately $10 million remains structurally constrained in the near term, capping addressable network density and compressing the effective revenue per enterprise anchor deal by 30 to 40% relative to a fully connected supply chain scenario.
Challenges
| Challenge | (~) % CAGR | Geographic Relevance | Mitigation Horizon |
|---|---|---|---|
| Cross-Platform Interoperability Deficit | -5.6% | Global, most acute where multi-platform consortia co-exist (EU, North America, Asia Pacific) | Medium term (2 to 4 years) |
| Blockchain Developer Talent Scarcity | -4.3% | Global, most severe in South Asia, Southeast Asia, Sub-Saharan Africa | Long term (4 years or more) |
| On-Chain Data Quality & Oracle Integrity Risk | -3.7% | Global | Medium term (2 to 4 years) |
| Network Throughput & Latency at Industrial Scale | -3.1% | Global, most acute in high-frequency logistics (e-commerce, cold chain, automotive) | Medium term (2 to 4 years) |
| Energy Consumption & ESG Reporting Friction | -1.8% | European Union, North America (ESG-disclosure-regulated markets) | Short term (2 years or less) |
Cross-Platform Interoperability Deficit
The blockchain supply chain ecosystem has fractured into a heterogeneous landscape of competing permissioned networks including Hyperledger Fabric, R3 Corda, ConsenSys Quorum, VeChain, and several proprietary industry consortia, each operating with distinct consensus protocols, data schemas, and smart contract execution environments that do not natively communicate with one another.
The structural vulnerability is that a single cross-border transaction in industries such as pharmaceutical distribution or automotive parts sourcing may traverse 3 to 5 independently operated blockchain networks, each requiring bespoke bridging middleware, cross-authentication relay layers, or API gateway translations, adding 4 to 8 weeks of systems integration per network boundary and inflating per-integration project costs by an estimated 25 to 35% relative to a single-platform deployment.
While GS1 standards adoption and emerging cross-chain interoperability protocols are beginning to provide partial remediation, which elevates professional services cost-to-revenue ratios for solution vendors to levels approaching 60 to 70% of total contract value on complex deployments, compressing software margins and deterring pure-play SaaS pricing models.
Opportunities
| Opportunity | (~) % CAGR | Geographic Relevance | Execution Window |
|---|---|---|---|
| Tokenized Invoice & Trade Finance Monetization for Emerging-Market SMEs | +7.4% | South & Southeast Asia, Latin America, Sub-Saharan Africa | Medium term (2 to 4 years) |
| Decarbonization & Scope 3 Carbon Credit Verification via On-Chain Audit Trails | +5.9% | European Union, North America, Australia, Japan | Medium term (2 to 4 years) |
| AI-Augmented Smart Contract Anomaly Detection & Predictive Risk Scoring | +4.7% | Global, led by North America and Western Europe | Medium term (2 to 4 years) |
| Pharmaceutical Cold Chain & Clinical Trial Data Integrity as a Standalone Vertical | +4.1% | North America, European Union, Japan, South Korea | Short term (2 years or less) |
| Defense & Dual-Use Aerospace Parts Provenance Authentication | +3.5% | United States, European Union, India, South Korea | Long term (4 years or more) |
| Micro-Insurance & Parametric Risk Transfer Embedded in Supply Chain Smart Contracts | +2.8% | South Asia, Southeast Asia, Sub-Saharan Africa | Long term (4 years or more) |
Tokenized Invoice & Trade Finance Monetization for Emerging-Market SMEs
This opportunity remains almost entirely uncaptured as of 2026: the structural mechanism involves converting verified supply chain invoices into programmable on-chain tokens that can be fractionally sold into global liquidity pools, collateralized in decentralized lending protocols, or settled automatically upon EPCIS-verified delivery events.
The white space is grounded in the World Economic Forum’s estimate that blockchain adoption in trade infrastructure has the potential to increase global trade by up to $1 trillion over the next decade, driven primarily by closing the financing gap that leaves an estimated 40 to 50% of cross-border SME transactions in emerging markets unfunded due to lack of collateral-grade documentation, the exact problem that on-chain invoice provenance solves.
From a unit-economics standpoint, invoice tokenization compresses the traditional accounts-receivables financing cost for an emerging-market supplier from a range of 8 to 15% annualized discount rate to a projected 3 to 6% once blockchain-verified receivables can access global institutional liquidity directly, representing a 40 to 60% margin improvement for the supplier and a meaningful differentiation.
Geopolitical Impact Analysis
Geopolitical tensions are reshaping the cost structure and deployment timelines of blockchain-based supply chain platforms by affecting tariffs, sourcing strategies, and infrastructure costs. US–China trade tensions have increased average bilateral tariffs to around 16–17% since 2019, raising the cost of imported blockchain infrastructure components such as servers, networking equipment, secure IoT gateways, and specialized chips.
Rising geopolitical risks are also accelerating supplier diversification. A one-standard-deviation increase in geopolitical risk exposure increases the probability of import diversification by approximately 0.96–1.39 percentage points, representing 37–53% of the baseline diversification probability of 2.6%. Companies are therefore requalifying suppliers across regions such as ASEAN and India, redesigning distributed ledger networks, and extending blockchain implementation and testing timelines.
Logistics and energy challenges are further influencing blockchain adoption. Global average port call time increased from 36.8 hours in 2022 to 40.5 hours in 2023, adding around 3.7 hours per vessel call and delaying the movement of ICT equipment required for blockchain nodes, data centers, and IoT tracking systems.
The International Energy Agency projects data center electricity consumption to exceed 1,000 TWh by 2026, while cryptocurrency-related energy consumption is expected to grow by more than 40% to around 160 TWh. These pressures are driving demand for distributed, energy-efficient blockchain architectures focused on resilience, compliance, and cost efficiency.
Regional Analysis
North America maintained its leadership in the blockchain in supply chain market, accounting for approximately 36% of global revenue, equivalent to around USD 3.57 billion. The region benefits from strong adoption across logistics providers, retailers, and manufacturers, with the United States contributing approximately USD 0.76 billion in blockchain supply chain spending in 2024.
The region’s growth is supported by broader blockchain and supply chain technology adoption trends. North America represented around 34.8–47% of the global blockchain technology market value and nearly 44% of supply chain analytics revenues during the mid-2020s, reflecting strong investment in digital transformation and traceability solutions.
North America is expected to remain a key growth contributor, with estimates indicating that around 47% of incremental global blockchain supply chain spending will originate from the region. These factors reinforce its position as the leading hub for enterprise-grade blockchain supply chain deployments.
Key Regions and Countries
North America
- US
- Canada
Europe
- Germany
- France
- The UK
- Spain
- Italy
- Rest of Europe
Asia Pacific
- China
- Japan
- South Korea
- India
- Australia
- Rest of APAC
Latin America
- Brazil
- Mexico
- Rest of Latin America
Middle East & Africa
- GCC
- South Africa
- Rest of MEA
Key Players Analysis
Tier-1 participation in blockchain-enabled supply chain solutions is primarily driven by large enterprise software providers that integrate blockchain capabilities into existing ERP, cloud, and supply chain platforms rather than standalone blockchain companies. IBM, Oracle, and SAP hold a strong market position by embedding blockchain-based traceability, provenance, and trade digitization features into broader digital transformation programs.
IBM reported USD 61.9 billion in revenue in 2023 and USD 11.2 billion in free cash flow, supporting its ability to scale blockchain solutions through its wider software and consulting ecosystem. IBM Food Trust demonstrated practical adoption, with Walmart using the platform to trace over 25 food products across five suppliers, reducing traceability time from days to seconds.
SAP and Oracle represent another major Tier-1 group by integrating blockchain functionality into their enterprise software ecosystems. SAP reported EUR 13.7 billion in cloud revenue in 2023 and is incorporating blockchain into supply chain traceability and agricultural solutions, primarily as an enhancement to its existing SAP S/4HANA and digital supply chain platforms.
Oracle provides blockchain capabilities through Oracle Blockchain Applications and Oracle Blockchain Cloud Service, including solutions such as Intelligent Track and Trace, Lot Lineage and Provenance, and Intelligent Cold Chain, integrated with Oracle SCM Cloud and ERP Cloud.
Top Key Players in the Market
- IBM (IBM Food Trust)
- SAP SE
- Oracle Blockchain
- Maersk (TradeLens)
- Microsoft Azure BC
- Walmart (Food Safety)
- Everledger
- Provenance
- VeChain
- Ambrosus
- TraceLink
- Chronicled
Recent Developments
- In February 2026, TraceLink announced that its network of 310,000+ customers and trading partners completed a major serialization and traceability initiative in 2025. The company is expanding its blockchain-enabled orchestration platform across healthcare supply chains, supporting hundreds of millions of serialized units annually.
- In October 2025, IBM launched Digital Asset Haven on IBM Cloud to help enterprises tokenize and manage supply chain data across hybrid blockchain networks. The platform builds on IBM Food Trust’s previous tracking of millions of food products.
- In April 2025, Microsoft upgraded Blockchain Supply Chain Manager on Azure by integrating AI analytics and decentralized ledgers for provenance tracking, supplier verification, and compliance monitoring. The platform enables automated smart-contract workflows for global supply chains.
Report Scope
| Report Features | Description |
|---|---|
| Market Value (2025) | USD 9.91 Billion |
| Forecast Revenue (2035) | USD 697.78 Billion |
| CAGR (2026-2035) | 53.2% |
| Base Year for Estimation | 2025 |
| Historic Period | 2020-2024 |
| Forecast Period | 2026-2035 |
| Report Coverage | Revenue Forecast, Market Dynamics, Competitive Landscape, Recent Developments |
| Segments Covered | By Component (Platform, Services), By Blockchain Type (Public Blockchain, Private Blockchain, Consortium Blockchain), By Application (Product Traceability, Food Safety Tracking, Pharma Track & Trace, Smart Contracts, Automated Payments, Contract Execution, Payment & Settlement, Inventory & Provenance, Compliance & Auditing), By Organization Size (Large Enterprises, Fortune 500, Mid-Large Corporations, SMEs, Small Enterprises, Medium Enterprises), By End User (Healthcare & Pharma, Food & Beverage, Food Producers, Food Distributors, Automotive, Logistics & Transport, Manufacturing, Others) |
| Regional Analysis | North America – US, Canada; Europe – Germany, France, The UK, Spain, Italy, Rest of Europe; Asia Pacific – China, Japan, South Korea, India, Australia, Singapore, Rest of APAC; Latin America – Brazil, Mexico, Rest of Latin America; Middle East & Africa – GCC, South Africa, Rest of MEA |
| Competitive Landscape | IBM (IBM Food Trust), SAP SE, Oracle Blockchain, Maersk (TradeLens), Microsoft Azure BC, Walmart (Food Safety), Everledger, Provenance, VeChain, Ambrosus, TraceLink, Chronicled |
| Customization Scope | Customization for segments and region/country-level will be provided. Moreover, additional customization can be done based on the requirements. |
| Purchase Options | We have three licenses to opt for: Single User License, Multi-User License (Up to 5 Users), Corporate Use License (Unlimited Users and Printable PDF) |





























